XAU/USD 12 October 2025 Intraday AnalysisH4 Analysis:
-> Swing: Bullish.
-> Internal: Bullish.
Analysis and bias remains the same as analysis dated 20 October 2025.
Price has printed as per previous intraday expectation by printing a bearish CHoCH which indicates, but not confirms, bullish pullback phase initiation.
Price is currently trading within an established internal range, however, I will continue to monitor price with regards to depth of pullback.
Intraday expectation:
Price to continue bearish, react at either discount of 50% internal EQ, or H4 supply zone before targeting weak internal high priced at 4,380.990.
Note:
The Federal Reserve’s sustained dovish stance, coupled with ongoing geopolitical uncertainties, is likely to prolong heightened volatility in the gold market. Given this elevated risk environment, traders should exercise caution and recalibrate risk management strategies to navigate potential price fluctuations effectively.
Additionally, gold pricing remains sensitive to broader macroeconomic developments, including policy decisions under President Trump. Shifts in geopolitical strategy and economic directives could further amplify uncertainty, contributing to market repricing dynamics.
H4 Chart:
M15 Analysis:
-> Swing: Bullish.
-> Internal: Bearish.
You will note how price remains contained in consolidation between a supply and demand zone. The rest of my analysis and bias remains the same as bias date 29 October 2025.
As expected, price has printed a bullish CHoCH to indicate bullish pullback phase initiation.
Price is now trading within an established internal range.
Intraday expectation:
Price to continue bullish, react at either premium of internal 50% EQ or M15 demand zone before targeting weak internal low, priced at 3,886.465.
Note:
Gold remains highly volatile amid the Federal Reserve's continued dovish stance, persistent and escalating geopolitical uncertainties. Traders should implement robust risk management strategies and remain vigilant, as price swings may become more pronounced in this elevated volatility environment.
Additionally, President Trump’s tariff announcements, particularly against China, are expected to further amplify market turbulence, potentially triggering sharp price fluctuations and whipsaws.
M15 Chart:
Fractal

Brent crude againThe max bat is playing out in real time.
Brent is going to keep going up.
Will link idea from Pico bottom.

BTC HARMONICSBtc 1M fractal close. 102400 ish.
Two harmonics one up one down.
See how price reacts see which is victorious.
112500 upper target if we go up.

Good zones o work with, nasdaq 11-11-25Low volume nodes and gaps, usually are good zones to work with.

BTC Wyckoff DistributionFor all the WyCkOfF nEvEr WoRkS bros - publishing on Nov 11 and will come back to this in a few days/weeks (depending on which phase we're in). We're likely either in phase D and might see another quick drive past the SOW (Signs of Weakness) or even the AR (Automatic Reaction), followed by a sharp decline. Or we're in phase E and we're about to get a brutal decline in the coming days. 🍿
My thesis on why the accumulation and distribution cycles seem a lot more visible this cycle is because of etfs and large institutional involvement.

XVGUSD Livermore Accumulation Cylinder - VERGEVerge is currently ranging through a Livermore Accumulation Cylinder pattern. A breakout is expected soon.
In my opinion, as the fractal projection suggests, the future bottom will be at the level of the current ATH, $0.25.
This is not a financial advice. Do you own research.

Privacy is Pricy Again — How Zcash Got Back in the GameA significant shift is recently observed in the cryptocurrency space, indicating a resurgence of interest in privacy. The sharp rise of Zcash (ZEC) — over 46% in the week following Galaxy Research's analysis — is a clear example of this trend, reflecting the market's demand for untraceable funds.
Zcash, after years on the sidelines, has returned to the forefront, confirming that the fundamental cypherpunk ideals of privacy hold high value in the modern financial system.
1. Technological Breakthroughs and Zcash’s Fundamental Growth
The Zcash rally is driven not only by speculation but also by major improvements that have made privacy both more accessible and more effective:
Removing Barriers (Zashi & NEAR Intents): The use of zk-SNARKs (zero-knowledge proofs) has become more user-friendly. Enhanced user experience (UX) in new wallets (like Zashi) and integration with cross-chain mechanisms like NEAR Intents have removed the technical friction associated with "shielding" transactions.
Strengthening Anonymity: The most crucial network metric for Zcash is the increase of shielded coins in the Orchard pool to over 30% of the total supply. The more coins are "hidden," the larger the anonymity set becomes, which mathematically increases the difficulty of tracing transactions.
Technological Edge: Zcash, unlike some competitors, offers quantum-resistant cryptography and a stronger privacy mechanism via zk-SNARKs, which allows transaction validation without revealing the amount, sender, or receiver.
2. Zcash as a Counter-Trend to Transparency
The sharp price increase of ZEC after years of stagnation reflects a broader market narrative:
Reaction to Institutionalization: Against the backdrop of Bitcoin's growing transparency and institutionalization (ETFs, centralized custodians), Zcash is positioning itself as “encrypted Bitcoin”—an asset that refocuses attention on the decentralized and private nature of crypto assets.
Regulatory Balance: Zcash utilizes optional privacy, which, according to analysts, may provide the project with greater regulatory resilience compared to coins where privacy is mandatory by default.
Repricing Privacy: The market has demonstrated that the demand for confidentiality has not disappeared. The Zcash rally has forced investors to re-evaluate all privacy-focused projects, proving that, amid increasing online surveillance, the ability to transact privately has once again become a highly valuable feature.
Summary: Zcash is back in the game, bolstered by strong technological improvements that have made its privacy accessible and effective. The sustained nature of this growth will depend on whether the project can convert this speculative momentum into stable growth in user and network activity.

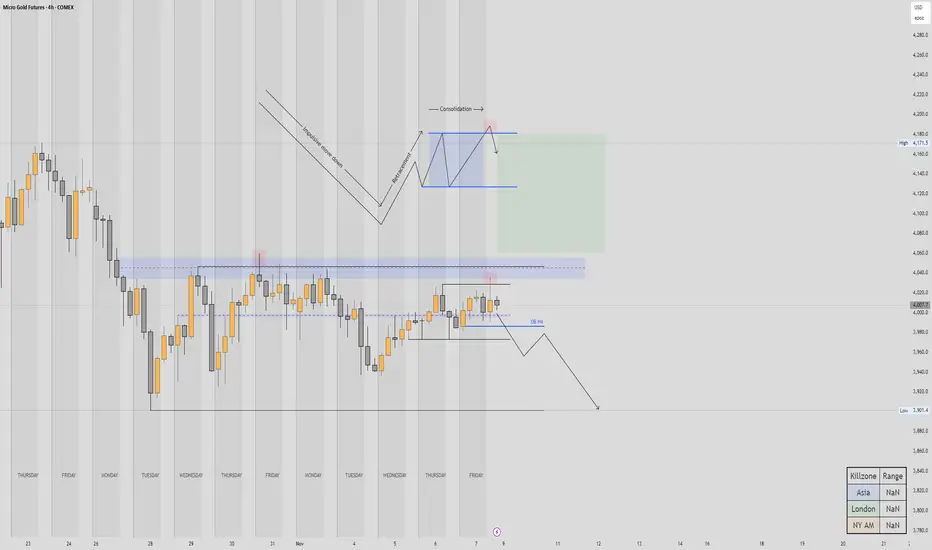
Gold futures to break back down the 4000?As we all know Gold has had an incredible rally this year,
Though, it's been consolidating for the last two weeks, and as far as the structure of the consolidation, some of the liquidity has been taken from the daily FVG on Oct the 30th, leaving a permanent high on the H4 chart with a nice bearish candle
Then it consolidated again for a bit, got an impulse to the downside, retraced with difficulty back to the H4 order block, to consolidate again last 2 days of last week. Finally , it printed what could be more of a permanent high on friday afternoon.
The combination of this, plus the last two day's candles looking bearish, starts to advocate for a bearish bias.
Therefore I'd like to see the price go and reach for the low of the range, after it's breaking the H4 structure
Of course this idea could be invalidated, if Gold was to break above the recent high and the Daily FVG, then we'd reasses the situation.
Still, I would be cautious for longs, Gold has been very extended for a very long time, needs to cool off a bit so we can go buy some coins again!
Cheers!
GBPUSD Retracement then back down GBPUSD kind of the same as EU
Very mean push down last week as expected, but, also it printed a quiet agressive reversal Weekly candle, therefore, I would like to see the price open low, reach into last week's wick, then back into the range, if it was to go and grab some liquidity into the FVG first, that would make a very good candidate for a short term long,
There is always the possibility for the price to open higher and trade higher then we'd adjust but, prefered scenario, trade lower, then back to previous week high,
If it does that, I'm not sure we'll have the reversal back to resume the downtrend this week, we left a lot of liquidity on the upside, I don't see the price just shooting down, it's possible, but less probable,
So for this week, looking at the continuation of the retracement up, then will start looking for sign or reversals back to the south. This 0.62/0.79 zone looks very appealing!
Good week and happy trading!

EURUSD for a short term reversal Looking at EURUSD to continue its reversal a little further, before resuming its downtrend
Scenario 1 :
Price reacts to the lower daily OB and the week opens low so we can go get some liquidity in the FVG we left open from last week
That would give it some fuel to keep going higher a little more and hit the liquidity on the upside
In this case we could take some longs from that FVG back to previous week high
Scenario 2 :
We open higher, and then I'd expect a mean reversal back to previous week low,
In any case i'll be prepared

Personal Account vs Prop firm TradingHere’s where a lot of traders miss the point.
Prop firms sound good on paper — funded accounts, big leverage, short-term payout structure. That’s attractive to retail and newer traders. But let’s be honest — true SMC traders see deeper.
A prop firm is a classroom. A personal account is freedom.
⚖️ Prop Firms:
• Beginner-friendly, structured, and can help build discipline early.
• But they come with strict rules — max drawdown, time limits, no weekend holds, no high-impact news trading.
• These rules can kill genuine SMC plays, because Smart Money often holds setups that develop midweek and deliver through Friday.
• Some prop firms even close trades automatically during volatile pullbacks — meaning your well-timed institutional entry could be cut off early.
Prop firms test you on rule-following, not market mastery.
💼 Personal Accounts:
• You control risk, timing, trade management, and exposure — full freedom.
• You can hold trades through the weekend, manage partials your way, and let multi-day structures complete.
• You can size positions sustainably — not recklessly, but with intent — and manage equity growth over time.
• It demands mastery, discipline, and emotional control — but that’s the essence of becoming a true trader, not a funded participant.
“Prop firms build discipline. Personal accounts build legacy.”
🧭 My Take:
I respect prop firms — they have their place. But I’m a personal account believer.
Why? Because Smart Money Concepts require freedom to express trade ideas dynamically, without artificial restrictions.
A true SMC trader isn’t trying to pass a challenge — he’s trying to understand and move with the market.
Prop firms serve the student. Personal accounts serve the master.
✍️ Closing Statement
“The real education starts when you stop testing history and start studying live footprints.
Prop firms can train your discipline, but personal mastery is built when your decisions shape your own equity.
Trading is not about probabilities — it’s about reading precision, cause, and intent. That’s the Smart Money way.”

ZEN (Horizen) Could Behave Well In The Weeks AheadIts funny how human psychology may repeat Beauty is that charts can visually show you patterns, no matter the timeframe. Its amazing how human psychology may repeat itself. Beauty here is that charts can visually show you human psychology in patterns, no matter the timeframe you're comparing them to.
It has many similar tokenomics as Zcash (ZEC)
DISCLAMER:
Non of this should be take as a financial advise. Be well.

FRACTAL and elliott wavesI think the structure in 2011 is very similar to the one in 2025.
Due to the fractal and Elliott waves, I expect a drop to 3666 on the route I've drawn.
I've already published my chart showing the next steps.

BTC - What if #1What a move corn, what a move.
Although it's a what if for, becomes an expectation when i see that bear div on rsi.
An impulsive move like this may very well complete as diagonal, and when you see diagonals at the highs with HTF divs, you run away.
If that happens to work, i'd not think for a second to buy that dip as the expection should be new highs, but i'd not be married to that idea - which takes me to the 2nd idea :

Bitcoin 35-months bull + 12-months bear pattern🧠 Why It Makes Sense
Halving Cycle Anchor:
Each halving (every ~4 years) tends to kick off or extend a bull phase. The roughly 35-months bull periods correspond well to the time from one halving to the next major top.
Human & Institutional Behavior:
Market psychology and macro liquidity cycles (QE, risk appetite, etc.) also seem to align with that 3–4 year rhythm.
Diminishing Returns, But Similar Structure:
While each cycle’s magnitude (ROI multiple) shrinks, the shape and timing remain surprisingly consistent — suggesting behavioral and structural patterns repeat.
⚠️ Caveats
Macro Environment Shift: The 2024–2025 cycle is happening under higher interest rates, institutional ETFs, and much greater liquidity depth. Those could flatten or stretch the cycle.
Reduced Volatility: Each cycle’s drawdowns and peaks become smaller in percentage terms, which could eventually distort timing patterns.
ETF & Derivatives: With more efficient capital and hedging, the “35/12” symmetry might smooth out.

Bitcoin 52-week bull + 52-week bear pattern🧠 Why It Makes Sense
Halving Cycle Anchor:
Each halving (every ~4 years) tends to kick off or extend a bull phase. The roughly 152-week bull periods correspond well to the time from one halving to the next major top.
Human & Institutional Behavior:
Market psychology and macro liquidity cycles (QE, risk appetite, etc.) also seem to align with that 3–4 year rhythm.
Diminishing Returns, But Similar Structure:
While each cycle’s magnitude (ROI multiple) shrinks, the shape and timing remain surprisingly consistent — suggesting behavioral and structural patterns repeat.
⚠️ Caveats
Macro Environment Shift: The 2024–2025 cycle is happening under higher interest rates, institutional ETFs, and much greater liquidity depth. Those could flatten or stretch the cycle.
Reduced Volatility: Each cycle’s drawdowns and peaks become smaller in percentage terms, which could eventually distort timing patterns.
ETF & Derivatives: With more efficient capital and hedging, the “152/52” symmetry might smooth out.

BTC/USD – Bullish Reversal PlaySMC | ICT | Bill Williams | 1H Bias
BTC swept HTF liquidity and reacted from a clean discount zone, showing displacement and reclaim structure.
📍 Key Levels
Entry Zone: ~$101,800 – $102,000
SL: ~$98,729 – $98,793
TP1: $106,000
TP2: $109,961 (premium zone + liquidity target)
📊 Confluences
HTF sell-side liquidity sweep
Bullish BMS after sweeping lows
Reaction from SMC demand block
Bill Williams Alligator shifting bullish (jaw opening)
SMT divergence into the lows
Price leaving discount → moving toward inefficiency
🎯 Trade Logic
Sell-side taken → buy-side liquidity draw
Targeting FVGs + imbalance fill above
Scaling partials at liquidity pockets & premium zone
Bias remains bullish into premium pricing — reassess if price rejects $109K zone.

BCOUSD Oil has taken all the fractal lows and is looking to the upside. If dxy softens as I believe we go up a ton. The low time frame pattern is easily recognizable. HTF bullish and done falling. Time is soon for the black viscous stuff.

Gold has unfinished business at the top.Gold will start its bullish move from the 3,840 zone if it doesn’t begin from the current price around 3,934. There’s still unfinished business at 4,438.6 that the market needs to complete. CMCMARKETS:GOLD

EURUSD BUYTrade idea
I’m planning a long on EUR/USD since the price just touched the 0.7 Fibonacci retracement level. I’ll enter with a 1:10 risk-reward setup and target 1.166 for the move.
Fundamental bullish reasons for EUR/USD this week
The European Central Bank (ECB) could surprise with a hawkish-tilt commentary (or at least less dovish than expected) — markets are flashing that any hawkish surprise from the ECB would give the euro a boost.
The Federal Reserve (Fed) appears to have less room to cut interest rates or loosen policy aggressively, which weakens the U.S. dollar in relative terms and supports the euro.
There is also scope for the euro to gain momentum if U.S. economic data disappoints (weaker data = weaker dollar) or if European data holds up. The euro is being priced as having upside potential relative to the dollar.

Solana (SOL/USD) – 288-Day Cycle ObservationCycle analysis suggests Solana continues to follow a 288-day dominant rhythm, with clear recurring phases marking key market turns.
Each full cycle has produced a well-defined crest and trough roughly every 9–10 months, maintaining consistent periodicity since late 2023. The most recent cycle low occurred around April 2025, placing the next expected time window for a cyclical low in early 2026.
This study focuses purely on time-based behaviour, independent of price levels. The objective is to identify when key inflection points are most likely to occur, based on the underlying rhythm visible in historical data.
If the 288-day pattern remains intact, Solana may continue in the declining phase of its ongoing cycle, progressing toward its next temporal turning point.
Note: This analysis is for educational and timing research purposes only and does not constitute financial advice.
Until next time!

Bitcoin/USDT FuturesBitcoin/USDT Futures will first go up and then down, and news will only accelerate this.
So first Touch point of 3 in above 2 .
In the short term, the trend will be upward and in the long term, downward.

XAU/USD 03 November 2025 Intraday AnalysisH4 Analysis:
-> Swing: Bullish.
-> Internal: Bullish.
Analysis and bias remains the same as analysis dated 20 October 2025.
Price has printed as per previous intraday expectation by printing a bearish CHoCH which indicates, but not confirms, bullish pullback phase initiation.
Price is currently trading within an established internal range, however, I will continue to monitor price with regards to depth of pullback.
Intraday expectation:
Price to continue bearish, react at either discount of 50% internal EQ, or H4 supply zone before targeting weak internal high priced at 4,380. 990.
Note:
The Federal Reserve’s sustained dovish stance, coupled with ongoing geopolitical uncertainties, is likely to prolong heightened volatility in the gold market. Given this elevated risk environment, traders should exercise caution and recalibrate risk management strategies to navigate potential price fluctuations effectively.
Additionally, gold pricing remains sensitive to broader macroeconomic developments, including policy decisions under President Trump. Shifts in geopolitical strategy and economic directives could further amplify uncertainty, contributing to market repricing dynamics.
H4 Chart:
M15 Analysis:
-> Swing: Bullish.
-> Internal: Bearish.
Analysis and bias to remain the same as yesterday's bias date 29 October 2025.
As expected, price has printed a bullish CHoCH to indicate bullish pullback phase initiation.
Price is now trading within an established internal range.
Intraday expectation:
Price to continue bullish, react at either premium of internal 50% EQ or M15 demand zone before targeting weak internal low, priced at 3,886.465.
Note:
Gold remains highly volatile amid the Federal Reserve's continued dovish stance, persistent and escalating geopolitical uncertainties. Traders should implement robust risk management strategies and remain vigilant, as price swings may become more pronounced in this elevated volatility environment.
Additionally, President Trump’s tariff announcements, particularly against China, are expected to further amplify market turbulence, potentially triggering sharp price fluctuations and whipsaws.
M15 Chart:
