AI TrendSpot | Schneider ElectricRevenue ↑ 15.67% (TTM)
Profit ↑ 18.87% (TTM)
Operating Margin – Stable (TTM)
Technicals – Weekly trend reversal in progress
AI Insight: Keep stock on radar.
Fundamental Analysis

NOU(TSX: NOU) — Swing Trade💰 NOU — Swing Trade Breakdown (TSX: NOU)
🏢 Company Snapshot
Nouveau Monde Graphite Inc. is a Québec-based developer of graphite and battery-anode materials. The company’s integrated mine and battery plant strategy has put it at the center of Canada’s EV supply chain narrative. Recent price momentum follows strong interest in critical minerals and graphite demand tied to EV growth.
📊 Fundamentals
NOU remains a development-stage, pre-revenue company — not yet profitable, so traditional metrics like P/E don’t apply. The price-to-book sits around 5×, a premium to peers, suggesting investors are pricing in future production success. Debt remains low with a debt-to-equity ratio near 0.15, and the company holds roughly $73 M CAD in cash against ~$18 M CAD in debt.
However, free cash flow is deeply negative (-$70 M TTM), and ROE sits around -53%, reflecting the heavy capital burn of early-stage mine development.
Summary: Healthy balance sheet for a small-cap, but still a high-risk bet on future execution rather than current profitability.
📈 Trends & Catalysts
Revenue Growth: Minimal — still pre-production.
EPS Trend: Losses widening as project spending increases.
Cash Flow: Negative, typical for early miners.
Balance Sheet: Solid liquidity but ongoing share dilution.
Catalysts:
Final Investment Decision (FID) expected for Phase 2 mine and Bécancour plant.
Government and EV-supply-chain incentives for Canadian graphite.
Technical breakout momentum following months of accumulation.
Risks:
Execution and funding risk.
High valuation vs fundamentals.
Possible dilution if additional financing is needed.
🪙 Industry Context
Graphite and battery materials are seeing renewed strength. Over the last month, the graphite segment has rallied hard — with NOU up roughly +50% and nearly +90% YTD — outperforming broader materials. Sentiment remains bullish, though volatility is high as traders rotate through battery-related names.
📐 Technicals
NOU recently surged from around C$2.50 to nearly C$8.00, then retraced back toward support near C$3.50–3.80, which aligns with its 50-day SMA around C$3.44. The 200-SMA sits lower near C$2.75, confirming a still-bullish long-term structure.
RSI has cooled from overbought levels (mid-60s), indicating the stock could be setting up for a secondary leg higher if demand returns.
Support is seen between C$3.30–3.50, with major resistance between C$5.50–6.60. Volume expanded sharply on the rally, then tapered during the pullback — suggesting profit-taking rather than a trend reversal.
🎯 Trade Plan
Entry Zone: C$3.50–3.80 (near support and 50-SMA)
Stop Loss: C$2.90 (below last swing low)
Target: C$6.60 (prior resistance)
Risk/Reward: ≈ 2:1
Alternate Setup: Break and close above C$5.00 with volume for a continuation move toward C$7+
🧠 My Take
This is a momentum swing on a speculative name — not a fundamental investment. I like the setup technically: clean pullback after a breakout, strong long-term trend, and supportive sector tailwind. A patient entry near the 50-SMA with a tight stop offers a solid R/R setup.
I’m watching for confirmation with volume; if it holds above C$3.50 and reclaims C$4.00, it could make another leg toward C$6+. Below C$3.30, the setup breaks down — take the loss quickly.
Bias: Bullish swing setup on retest of support within an emerging uptrend.

Can AAPL Earnings Fuel Its Rally?Apple (AAPL) extended gains to a record high, briefly pushing its market capitalization past the USD 4 trillion mark as strong iPhone 17 demand and a broad tech rally buoyed sentiment. Early data from Counterpoint Research showed iPhone 17 sales outpacing the previous generation by 14% in the first 10 days across the US and China, underscoring resilient consumer demand despite higher price points. However, signs of moderating lead times and delayed AI feature rollouts may temper momentum ahead of Thursday’s earnings, where investors will focus on iPhone sustainability and progress in Apple’s AI strategy.
From a technical perspective, AAPL is approaching the resistance at 127.2% Fibonacci Extension at 275. A break above this level may prompt a further rise toward the 161.8% Fibonacci Extension at 290. Conversely, a retracement may prompt a retest of the support at 245.
By Li Xing Gan, Financial Markets Strategist Consultant to Exness

EUR/USD Technical Outlook – October 29, 2025The EUR/USD pair is currently trading around 1.1628, showing a mild pullback after failing to hold above the 1.1660 short-term resistance. The broader structure on the H1 timeframe still suggests a bearish bias, as price remains below key swing highs and continues to respect descending structure points.
Key Technical Levels
Resistance 1: 1.1660 – Short-term supply zone and potential retest area.
Resistance 2: 1.1720 – Major structure resistance aligned with previous liquidity grab.
Support 1: 1.1570 – Key short-term demand zone.
Support 2: 1.1500 – Extended target area if bearish continuation holds.
Trading Strategy Idea
Price may attempt a minor retracement toward 1.1660, which aligns with the Fibonacci 61.8% retracement of the recent downswing. A rejection from this level could confirm renewed selling pressure, leading to a potential move back toward 1.1570 – 1.1560 zone.
Traders may look for bearish confirmation (RSI divergence or EMA crossover) before entering short positions.
Market Bias: Bearish below 1.1660
Invalidation: A clear breakout above 1.1720 would shift bias to neutral.

Hyperscale Data, Inc. Common Stock (GPUS)Last chart was unclear in chart..
Plz return to it and stick on it
Target price = 3.28$ and above
Again Highly recommended for Buying.

Nvidia (NVDA) Shares Surpass $200 for the First TimeNvidia (NVDA) Shares Surpass $200 for the First Time
Yesterday, Nvidia’s (NVDA) share price climbed above the psychological threshold of $200 for the first time, pushing the company’s market capitalisation close to $5 trillion.
Why Are NVDA Shares Rising Today?
Several bullish factors are driving Nvidia’s share price higher:
→ Massive order backlog: The company reported pre-orders for its AI processors totalling an astonishing $500 billion.
→ Strategic partnership with the US government: CEO Jensen Huang announced plans to build seven AI supercomputers for the US Department of Energy.
→ Expansion into telecoms: Nvidia has invested $1 billion in Nokia, acquiring a 2.9% stake in the Finnish company to jointly develop AI-RAN and 6G technologies.
Technical Analysis of Nvidia (NVDA)
Back on 23 September, our analysis of the NVDA chart identified:
→ an upward channel outlining the stock’s price movements this autumn;
→ a breakout from a Bullish Flag pattern (shown in red);
→ a projection that strong fundamentals, the rapid advance of AI technology, and expectations of a Fed rate cut could enable bulls to overcome the $183 resistance level and target the psychological $200 mark.
That projection has materialised since:
→ the Bullish Flag breakout level has acted as support (marked with a bold blue line);
→ NVDA price swings have provided anchor points to refine the current channel.
What’s Next for Nvidia Shares?
Note the bullish gaps (highlighted by arrows) that indicate a demand imbalance. The rapidly strengthening upward momentum could drive NVDA’s share price towards the upper boundary of the channel, particularly as several major events approach today:
→ the Federal Reserve’s interest rate decision and subsequent press conference;
→ quarterly earnings releases from Microsoft (MSFT), Alphabet (GOOGL), and Meta Platforms (META), all of which are expected to reaffirm their commitment to AI development.
This article represents the opinion of the Companies operating under the FXOpen brand only. It is not to be construed as an offer, solicitation, or recommendation with respect to products and services provided by the Companies operating under the FXOpen brand, nor is it to be considered financial advice.

Hyperscale Data, Inc. Common Stock (GPUS)Yesterday, a wave correction of wave 2 completed, that reach upto 62% of W1.
Now, we expecting the Motive Powerful 3rd wave that aims to reach 3.28$ and above could be.
Accumulation zone could take 1 day, and could take more days .
This Stock is Highly recommended for Buying from present level upwards.
Expecting massive Positive news coming days.

DOW JONES 30 HIGH PROBABILITY SETUP SOON!!!🚨 DJ30 HIGH PROBABILITY SELL SETUP 🚨
* Here We Can See Clearly The Next Potential Moves For US30 Coming Hours/Days.
* Keep Your Eyes Close On Your Trading Positions.
* Happy PIP Hunting Traders.
FXKILLA.

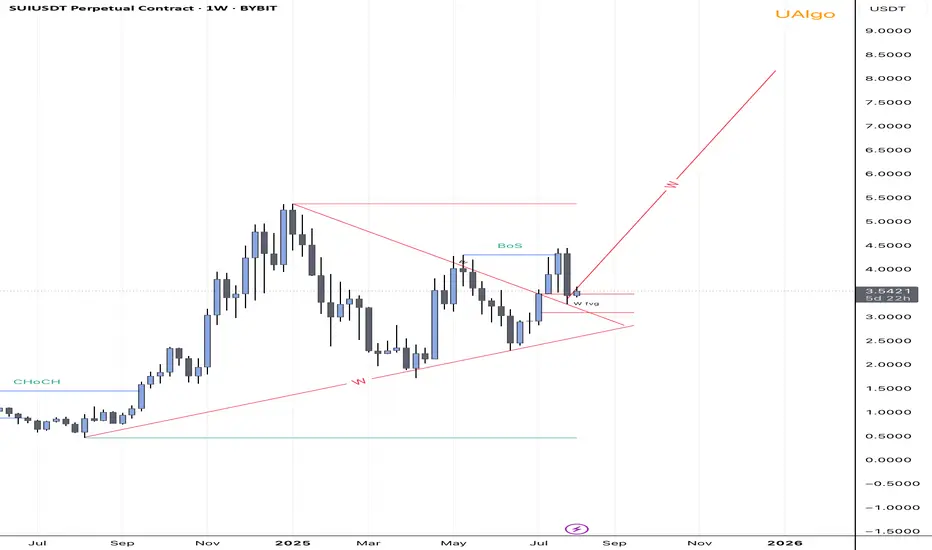
SUI Bullish Breakout Confirmed- $8 Target In sight! Hey everyone,
Today marks an important moment for SUI. We’ve just witnessed a clean breakout from a long-term symmetrical triangle on the weekly timeframe, supported by a confirmed Break of Structure (BoS) and a weekly Fair Value Gap (FVG) acting as strong support.
Price respected the FVG zone and bounced, showing clear bullish intent. With strong structure forming and momentum building, I’m targeting the $8 region as the next major level of interest. Market structure is bullish, and the confluence of trendline support, FVG, and the breakout gives me confidence in this move.
Key Highlights:
• Weekly CHoCH followed by BoS 🚀
• Price broke out of triangle and retested FVG🚀
• Bullish continuation structure (W formation)🚀
• Targeting $5.5 → $8 range if momentum holds🚀
1000PEPE looks good from here?I did my analysis on different times frames, On higher time frame we are bearish, Short time frame up or down is unpredictable. On as you guy can see price didn’t respect trend and breakdown’ It’s does means that 100% is goin down because we also have Fib Support may that change the market direction from bearish to bullish. We also have FVG which didn’t respect it also and As you guys can see the situation of market mostly up and down by news. So I don’t expect anything good news for the market right now but we should prepare for everything. Those analysts on daily time frame.

BTC WILL CRUSH. BTC ENTRY POINTAs we predicted on our last Analysis BTC exactly reacted and went the direction we wants.
So now if BTC first rejected from 106100-106700, Then we will see a opportunity to go short until 102k. If BTC didn't not respect 106100-106700, And went up with high volume then more likely reject from 107800-108500 above breaker FVG, From there we can go short only if we got rejected.
NOTE: we should wait for the confirmation, The confirmation will be Rejection from those two area.
Analysis: 1H

SOL 2D BULLISH, Entry points New HH coming up?So guy as we have seen a downtrend SOL from 180 price resistance and so now price trading on very critical area. We have fvg on 2D around 120-123 and still haven’t not been taken. So there is two scenarios and mostly like price will reject from fvg and head toward to W fvg which we have Above on Weekly TF. The confirmation will be respect to fvg and overall market conditions. Also I am bearish on SOL 2 weekly TF, which we should not forget. If price respect to fvg and overall market conditions was bullish then we can enter around 120-130 and TP will be 210-220

SHOULD WE WORRY ABOUT BTC? NEXT MOVE BTC Rejected From 4H FVG Around 110001-110613. Also, we should not forget made double top. And then headed to 106800 area. And MOST IMPORTANT BREAK BELLOW the TREND LINE. Now try to retest the TRENDLIND. If successfully retest and reject, then that will be an opportunity to open short. NOTE: WE SHOULD WAIT FOR THE RETEST CONFERMATOIN.

Bullish channel breakout on USTEC, potential for further gains? USTEC rose to fresh highs as AI demand and strong semiconductor orders bolstered investor sentiment.
SK Hynix customers have secured its entire memory chip lineup for 2026, reinforcing confidence in tech earnings momentum. Attention now turns to upcoming earnings from Big Tech to gauge the sustainability of the USTEC's rally.
From a technical perspective, USTEC broke out of the ascending channel's upper bound at 26000. If the index sustains its bullish momentum above the 26000 threshold, the price could gain upward momentum toward the 127.2% Fibonacci Extension and resistance at 27200. Conversely, if USTEC returns within the channel and 26000 threshold, the index may retest the support at 25200.
By Li Xing Gan, Financial Markets Strategist Consultant to Exness

GOLF FOMC prep prediction 2Scenario 2:
-Powell mentions continued rate cuts with dovish tone still, and stating unemployment still to high.
-Then we can expect Gold reach previous ATH's again or even make new Highs.

GOLD Pre FOMC Prediction 1Scenario 1:
- Priced in -0.25% rate cut happens.
- Neutral to Hawkish tone by Powell.
- Powell mentions inflation is still an issues therefor their job on inflation is not complete
- No future mentioned on rate cuts.
Impact on Gold = Gold rises to upside short term for liquidity grab before further comments in the coming days/weeks by members mentioning rate hold or even hikes, which will result in Gold dropping even more aggressively.

“Gold (XAUUSD) – Liquidity Grab & Break of Structure | Long SetuGold executed a clean liquidity sweep below equal lows (EQH) before breaking structure to the upside, confirming a potential bullish reversal from discount levels.
Key Confluences:
🔹 Liquidity sweep below 3950 (EQH zone)
🔹 Reclaim of internal structure + break of trendline
🔹 Entry from demand / discount zone (Fibo 0.38–0.5 retrace)
🔹 Volume profile shows strong acceptance above 3969 (POC)
🔹 Targeting PDH (Previous Day High) and imbalance fill near 4026
Bias: Bullish → Looking for continuation toward 4020–4030 area.
Invalidation: Break back below 3950 zone.
Words of Swizr:
🕰 Patience | Discipline | Edge

Gold Correction after edging lower ahead of Fed decision• Gold prices hover near 3,975 USD, consolidating within a well-defined descending channel as investors await the Federal Reserve’s policy decision later today. The metal has been weighed by resilient U.S. economic data, a firmer dollar, and rising Treasury yields ahead of the FOMC statement and press conference.
• Fundamentally, today’s FOMC decision is pivotal. Markets expect the Fed to hold rates at 4.00%, but attention will center on the policy tone and updated economic projections. A hawkish lean or hints of slower rate cuts would strengthen the dollar and pressure gold, while dovish communication emphasizing growth risks could lift the metal temporarily.
• Gold’s near-term direction hinges on the Fed’s tone. The path of least resistance remains downward unless prices reclaim the 4,020–4,045 resistance band. Below 3,960, bearish momentum could accelerate toward 3,900, extending the broader correction phase that began in mid-October.
Read the full article here:
erranteacademy.com

GOLD (XAU/USD): FED ALERT! IS THE BOTTOM IN?Hello TradingView Community! Gold is standing at a critical juncture. The convergence of the US Federal Reserve (FED) decision, US-China trade talks, and geopolitical risks is setting the stage for significant market movement.
1. 🌍 Fundamental Analysis (Macro): Geopolitics vs. Rate Cuts
Bearish Headwinds: Positive developments in US-China trade discussions eased comprehensive trade war fears, causing safe-haven demand to drop and pushing Gold below the $3,900 mark.
Strong Support Factors:
The market is heavily anticipating the FED will cut borrowing costs by 25 basis points at the conclusion of its two-day meeting (scheduled for tonight/early tomorrow). Lower rates typically support Gold (a non-yielding asset).
Escalating US-Russia geopolitical tensions (new sanctions, canceled meetings) and the ongoing US government shutdown highlight internal instability, providing a continuous underlying bid for the safe-haven metal.
2. 📈 Technical Analysis: Wave C Bottom and Rebound Targets
Based on the Elliott Wave structure on your chart, the technical picture is sharp:
Wave C Completion: The recent drop to $3,892.152 appears to have completed the 5-wave structure of the larger corrective Wave C. This suggests a strong possibility that a major bearish cycle has ended.
LONG Target: If the rebound scenario holds, Gold is targeting the crucial Fibonacci resistance zone: $4,135 - $4,180.
Key Levels to Watch:
Confirmation Resistance: A decisive break above $4,042 will strongly confirm the upward momentum.
Stop-Loss (SL): Risk management demands a strict stop-loss placed just below the Wave C low at $3,892.152.
Conclusion: The combination of geopolitical support, FED rate cut expectations, and the technical signal of a potential Wave C bottom offers an attractive Risk/Reward setup for LONG (Buy) positions. All eyes are now on the FED announcement tonight/tomorrow morning!
#XAUUSD #GOLD #FED #ElliottWave #TradingView #MarketUpdate What are your thoughts? Are you going Long or Short into the FED event? 👇
Would you like me to draft a quick contingency plan for Gold in case the FED's statement is unexpectedly hawkish (less dovish than expected)?

GOLD (XAU/USD): FED ALERT! IS THE BOTTOM IN?Hello TradingView Community! Gold is standing at a critical juncture. The convergence of the US Federal Reserve (FED) decision, US-China trade talks, and geopolitical risks is setting the stage for significant market movement.
1. 🌍 Fundamental Analysis (Macro): Geopolitics vs. Rate Cuts
Bearish Headwinds: Positive developments in US-China trade discussions eased comprehensive trade war fears, causing safe-haven demand to drop and pushing Gold below the $3,900 mark.
Strong Support Factors:
The market is heavily anticipating the FED will cut borrowing costs by 25 basis points at the conclusion of its two-day meeting (scheduled for tonight/early tomorrow). Lower rates typically support Gold (a non-yielding asset).
Escalating US-Russia geopolitical tensions (new sanctions, canceled meetings) and the ongoing US government shutdown highlight internal instability, providing a continuous underlying bid for the safe-haven metal.
2. 📈 Technical Analysis: Wave C Bottom and Rebound Targets
Based on the Elliott Wave structure on your chart, the technical picture is sharp:
Wave C Completion: The recent drop to $3,892.152 appears to have completed the 5-wave structure of the larger corrective Wave C. This suggests a strong possibility that a major bearish cycle has ended.
LONG Target: If the rebound scenario holds, Gold is targeting the crucial Fibonacci resistance zone: $4,135 - $4,180.
Key Levels to Watch:
Confirmation Resistance: A decisive break above $4,042 will strongly confirm the upward momentum.
Stop-Loss (SL): Risk management demands a strict stop-loss placed just below the Wave C low at $3,892.152.
Conclusion: The combination of geopolitical support, FED rate cut expectations, and the technical signal of a potential Wave C bottom offers an attractive Risk/Reward setup for LONG (Buy) positions. All eyes are now on the FED announcement tonight/tomorrow morning!
#XAUUSD #GOLD #FED #ElliottWave #TradingViewIndia #MarketUpdate What are your thoughts? Are you going Long or Short into the FED event? 👇

EUR/CAD slips below trend support as BoC decision and oil resiliEUR/CAD weakens toward 1.6200 after failing to sustain gains above 1.6325, as the euro struggles for momentum ahead of the ECB meeting while markets brace for the Bank of Canada’s policy announcement.
The technical setup has turned bearish following a clean break below the multi-week ascending trendline, with momentum and volume confirming downside continuation. Immediate targets lie at 1.6180 and 1.6150, with a potential extension toward 1.6100 if the BoC maintains a hawkish tone.
Fundamentally, the BoC decision later today is the key catalyst. A cautious-hawkish hold combined with resilient oil prices could strengthen the CAD further, whereas a dovish surprise signaling earlier rate cuts would trigger a short squeeze back toward 1.6325–1.6380.
The euro remains under pressure from soft consumer sentiment and a lack of fresh catalysts, leaving EUR/CAD directionally biased to the downside in the near term, barring an unexpected shift in BoC guidance or a hawkish ECB signal later in the week.
Read the full article here:
erranteacademy.com

Gbpusd buyGbpusd buy@1.3220
SL @ 1.3130
Tp @ 1.3313
I am looking at buying Gbpusd cfd / 6B futures price is testing a key demand zone after sweeping out liquidity i expect price to rally to the upside.

Crude Oil is InflationOne of the best ways to gauge where inflation is heading is by tracking the relationship between crude oil prices and the U.S. Consumer Price Index (CPI).
If we take a moment to observe their movement from the 1980s to today, we can see that they have generally moved in tandem. The year of their peaks and troughs are in synchronization.
So, who is leading whom?
Is it the inflation data that drive crude oil prices higher or lower — or is it crude oil prices that influence the inflation trend?
WTI Crude Oil Futures & Options
Ticker: MCL
Minimum fluctuation:
0.01 per barrel = $1.00
Disclaimer:
• What presented here is not a recommendation, please consult your licensed broker.
• Our mission is to create lateral thinking skills for every investor and trader, knowing when to take a calculated risk with market uncertainty and a bolder risk when opportunity arises.
CME Real-time Market Data help identify trading set-ups in real-time and express my market views. If you have futures in your trading portfolio, you can check out on CME Group data plans available that suit your trading needs www.tradingview.com
