Think Long TermI'm not claiming to be a good trader, or even a decent investor! But those of us who have decided to leave short-term trading and pursue longer-term trading, things start to show that they are better than they appear.
Also, it's wayy less stressful 😂
Keep your head up. We're in a support zone, which means this is the best place to buy. In terms of growth, now that LTC is getting its first ETFs we should be able to see LTC make it back to its all-time high and maybe even higher. This should only take a couple years at most, especially seeing that it took less time for BTC and ETH to return to near all-time highs post-ETF. Might take some time due to the somewhat disappointing initial inflows to the beforementioned LTC ETFs, but what I'm trying to say is that LTC will grow over time. Just gotta give it some time. Buy now, hold for a year or so, and we should make it beyond $300 in no time 🙂
Of course, all of this is just my opinion 😂
Fundamental Analysis

Smart money Concept (SMC)Bearish Analysis Breakdown – XAU/USD (15M)
🧠 Market Structure
The overall structure remains bearish, showing lower highs and lower lows.
You correctly identified a Consolidation Zone where the market accumulated orders before executing a Break of Structure (BOS) to the downside — a strong signal of institutional intent.
After the breakout, the price forms a Change of Character (CHOCH) followed by a Fake Out and Rejection inside the 5M Order Block (OB-5M).
This confirms that institutions are mitigating previous positions and preparing for a continuation toward the Sell-Side Liquidity zone.
🧩 Confluences
• Resistance Zone: Price reacted perfectly at this level after the mitigation of the OB.
• BOS + CHOCH + Fake Out: These three elements combine to confirm bearish control.
• Institutional Intent: The market is targeting the LL (Last Low) at 3,887, where liquidity is resting.
🎯 Trade Plan
• Sell Entry: 3,964
• Stop Loss: 3,989
• Take Profit: 3,887
• Risk/Reward Ratio: 1:3
The trade setup is perfectly aligned with the continuation of the bearish leg, following institutional structure and liquidity flow.
💬 Conclusion
This is a professional-level bearish setup, showing precise understanding of Smart Money Concepts and multi-timeframe structure. Good luck traders… ✌🏻😉
“Patience in following structure leads to precision.”

PENGU bear market started for it#PENGU / USDT
Price lost 6 months uptrend line which is breakdown bullish structure
As result this could be just the beginning of bearish market for it in the coming weeks
Invalidation: price will turn bullish if ONLY able to breakout and hold above red zone marked in my chart
Note : price wont drop as straight line it moves like waves

BTCUSD.P Overall Weekly Trend: The most recent weekly analysis points towards a correction or consolidation phase following a significant prior move. Many technical ratings for the 1-week timeframe show a Sell signal.

$INTC - Best in the sector against Trump tariffsIntel is a semiconductor technology giant, renowned for its x86 processors that dominate the CPU segment, top revenue in Q2 2025 came from PC chips (Client Computing Group, ~$7.9B) and server/AI chips (Data Center & AI, ~$3.9B) . Other revenue includes foundry services ($4.4B) and legacy businesses ($1.1B).
But, for the last 4 years the company has experienced one disaster after another:
- Loss of Market Share & Intensified Competition vs AMDs Ryzen and NVIDIA AI GPUs has been major drivers for last 4 years of decline.
- Gross margin dropped to around 38–39% in 2024—a steep fall from pre‑pandemic levels above 60%, while NVIDIA maintained margins above 75%.
- Intel perpetually lagged in transitioning to advanced nodes (7 nm, 5 nm), resulting in costly delays and reduced competitiveness .
- Credit rating downgrade: In August 2025, Fitch downgraded Intel’s credit rating from BBB+ to BBB (negative outlook) due to weak demand and deteriorating profitability . S&P had already downgraded Intel to BB+, and Moody's also cut its rating in 2024 .
Recent events and price action show its time for a buy at these prices.
- Spin-off of Network & Edge (NEX) group: Intel announced the spin-off of its Network and Edge Group (NEX) into an independent entity focused on critical communications and networks, seeking external investors while retaining a major stake .
- Workforce reduction and factory cancellations: Intel confirmed layoffs of ~24,000 employees (~15% of workforce) and cancellation of chip plant projects in Germany and Poland . New CEO Lip-Bu Tan plans to cut the headcount to ~75,000 by year-end 2025 .
- Executive departures and internal reorganization: Three corporate VPs (Kaizad Mistry, Ryan Russell, Gary Patton) announced retirement from manufacturing operations amid deep restructuring . Intel also cut its manufacturing capacity planning and engineering teams as part of an efficiency-driven reorganization .
- Recent key products/services: Intel launched new Xeon 6 CPUs for AI workloads (e.g. Xeon 6776P) and is preparing Panther Lake CPUs (PCs) for 2025 . It also began 18A node production in Arizona and sold part of its Mobileye stake (~$922M) to boost liquidity .
Price/sales: Intel (0.80), AMD (10.3), NVIDIA (29.6), QCOM (3.68)
Wrap-Up
Intel's last four years have been marked by a series of structural, competitive, and strategic challenges—ranging from manufacturing delays to margin erosion and intense pressure from rivals like AMD and NVIDIA. Yet, the tide may be turning. With decisive actions like major cost-cutting initiatives, new AI-focused products, and progress in advanced node production, Intel is signaling a strategic pivot. Trading at a deep discount relative to peers based on the price-to-sales ratio, the stock reflects much of the past negativity. For investors seeking a long-term turnaround play in the semiconductor sector, now could be the moment to re-evaluate Intel’s potential.
Let’s see if this chip giant can turn the corner. Cheers!
Pablin

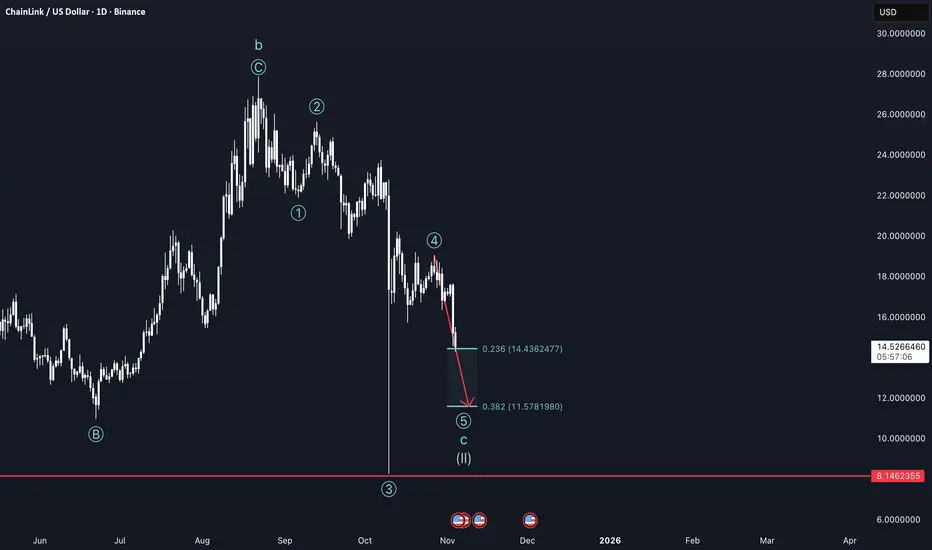
Chasing Lows - LINK weekly update Nov 04 - 10thAfter an astronomical gym session, I am now happy to review Chainlink to you!
Due to a negative macro outlook short-term, Altcoins and Bitcoin dropped in the beginning of the week and will be dropping further throughout the week.
Looking at the structure I am considering the current movement to be part of a larger correction of the supercycle wave 2, were we are internally at the wave c on the cycle and in the fifth wave in the primary cycle. For now we technically reached the first price target for short fifth waves, but since I expect Ethereum to also go down I believe we are gonna drop to the 0.382 extension level of the fifth wave, at $11.57.
On the way there we are going to fill a lot of orders as the orderbook shows a lot of them, also at the price target. As we go down I do not recommend opening short positions because a lot of people will call Altcoins and the Alt-Season dead, leading to a lot of shorts and a gradually increasing chance of short-squeezes. The bottom could be in if funding rates on the daily turn negative, and RSI enters oversold areas on the 2 week chart.
This thesis also gets supported by the VIX, which is rising and therefore indicates a risk off sentiment and the USDT dominance chart as it rises also and gets near the top.
I urgently need to point out that at this point an ending of the downtrend gets more possible the lower we fall. Buying here is a great opportunity and the lower we get the more the effect of dollar cost averaging comes into play.
EJ Makes Massive Descent, Could Further Falls Come?Here is OANDA:EURJPY on the 4Hr Chart and after making a new Higher High @ 178.818, has created a Lower Low @ 176.098, surpassing the most recent Higher Low @ 176.629.
This is a Break in Trend and we should suspect price to fall further on EJ if price can:
- Confirm Trend Change by printing a Lower High
Now on the chart, based on the Lower Low, the Fibonacci Tool lays out a couple favorable areas
First, being the last Higher Low @ 176.629 which lays right below the 23.6% Retracement level @ 176.740.
Secondly, the 50% Retracement Level @ 177.458 where there was Consolidation before the decline in price.
*This deep of a pullback could threaten the Bearish momentum built up from the break down and creating the Lower Low.
Fundamentally, the Yen seen a rise in strength after a couple key things happened:
- BOJ held Interest Rates unchanged @ .5%
- Toyko CPI numbers came out hotter than expected with a Forecast of a .1% increase to 2.6% with Actual coming in at 2.8%, a .3% increase!
*This gives the BOJ to hike rates to help with inflation taking off too hot and this could very well strengthen the Yen more!

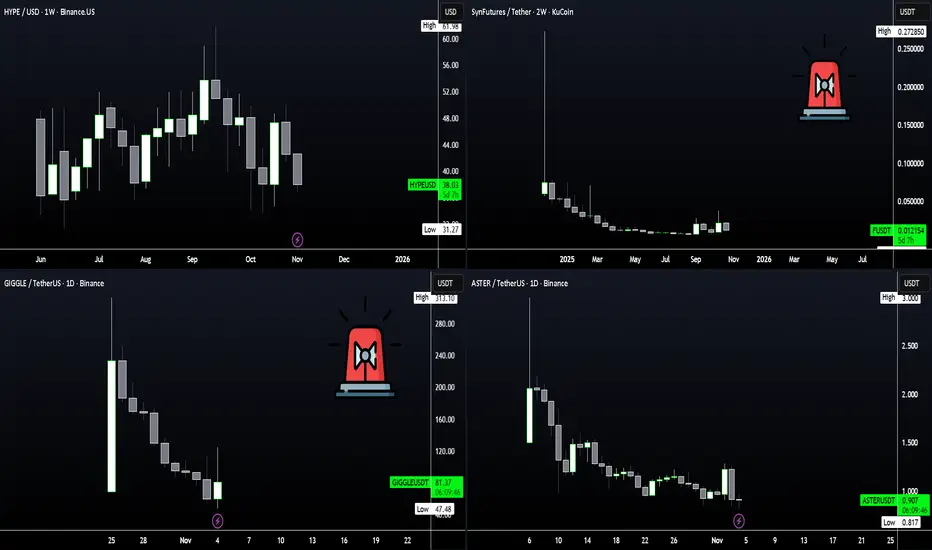
HYPE. sale.The guys from the arbitrum, having decided to earn some extra money. They wrote an exchange called "hyperliquid" on their knee. That is, they literally tell everyone, "We will hyper-liquidate your orders."
With technologies that have already been tested on other decentralized exchanges that were once promoted and sunk into oblivion.
They also came up with a kind of "whale". Which go either into a long or short position for some astronomical amounts with the entire deposit. Naturally, this is promoted on all public pages on social networks.
This is done in order to attract the public and earn extra money on commissions and liquidations.
It is clear that in fact there are no "whales" there. That these are fake accounts embedded by developers in the program itself to attract attention.
Well, enterprising guys are selling HYPE tokens to everyone.

How To Trade NEW ALTS - SECRET PATTERN !!New Alts - a Pattern
Newly released alts all seem to follow the same pattern, at least for the first few weeks. From the frontpage chart, you'll notice a very interesting "fractal" if we can call it that.
It goes something like this:
🚀 Opening Candle 💥 Top Out 👇 Hard Drop ❕ Re-enters opening price or goes under 🔁 Bottoms out (HERE IS WHERE YOU BUY) 🚀 Higher Highs follow.
With this said, it seems evident that you should WAIT to buy a coin that has just been released on the exchange. Although you could try to jump in to the moving train, the risk is simply too high if you do not already have a position.
ALTS that have already retraced, bottomed out and establishing higher lows. These alts you could easily preset TP targets from 15% onwards, depending on your risk appetite.
📈HERE are some examples:
JTO, almost there:
RVF, full retracement and beyond (This could be a warning sign as a liquidity drain)
RAY, clear bottom, full retracement, approaching re-accumulation zone:
ADA, full retracement, hard bounce, approaching key re-accumulation zone:
ALWAYS remember to take caution in the volatile world of crypto with a SL and reasonable targets. Remember that trading newly released alts and memecoins greatly increase the risk on top of the existing risk of crypto.
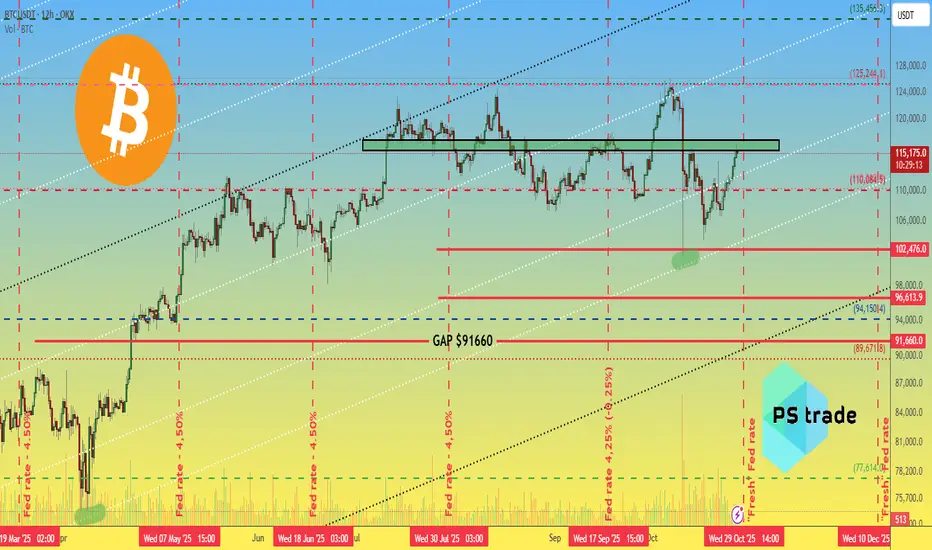
Crypto Markets Enter a Volatile Week Ahead of Key Global EventsKey events shaping volatility this week:
Oct 29: FED rate decision (expected -0.25%)
Oct 30: Trump–Xi meeting in South Korea
Market sentiment:
Fear & Greed Index jumped from 22–34 → 51
Short-term optimism is returning as macro uncertainty softens
CRYPTOCAP:BTC Technical Zone:
Current resistance: $115,500–117,000
Support: $110,000
A confirmed breakout above 117K could open the way to the next bullish leg on OKX:BTCUSDT
Question remains: is this the start of a new rally or just a pre-correction bounce?
______________
◆ Follow us ❤️ for daily crypto insights & updates!
🚀 Don’t miss out on important market moves
🧠 DYOR | This is not financial advice, just thinking out loud.
EURUSD: two possible scenarios for buy setupEURUSD: two possible scenarios for buy setup. EURUSD will have a bullish move, either with correction, or with continuation move.
Cheers


Silver (XAGUSD): Possible buy setupSilver (XAGUSD): Possible buy setup. Plan is clear. I think this is SMT and there will be a huge amount of liquidity here. Let's see if I am right.
Cheers

Gold (XAUUSD): Possible buy setup, refinedGold (XAUUSD): Possible buy setup, refined. Price took some more liquidity before going up.
Cheers

Silver (XAGUSD): Possible buy setup, refinedSilver (XAGUSD): Possible buy setup, refined. Price took more liquidity before going bullish.
Cheers

EURNZD Strong Bearish ViewCurrently EURNZD is moving at Supply zone so there are high chances that once bearish impulse is coming in EURNZD very soon .

Gold (XAUUSD): Possible sell setupGold (XAUUSD): Possible sell setup. Wait for a clear breakout, with additional confirmation.
Cheers

Gold (XAUUSD): High probability setupGold (XAUUSD): High probability setup. If price breaks and holds it is a good high probability setup.
Cheers

BTC at Double Channel Support — Next Impulse Loading?📉 BTC at Double Channel Support — Next Impulse Loading? 🎯
Bitcoin is currently testing a double channel confluence support near $100,211 , a level that’s been both technically and psychologically relevant across the 15m, 1H, and 4H views.
The left pane shows the descending red channel, where price just wicked below support and reclaimed — a signal we’ve seen in prior reversals.
The right pane highlights the broader blue/green support — creating a high-probability reaction zone.
🔹 Technical Support: $100,211
🔹 Local Resistance: $105,161 → $110,596
🔹 Major Target: $122,955 - $138,888 zone
The bullish case strengthens if BTC flips $105,161 on strong volume. But failure to hold $100K opens doors to $97,389 and $96,821 next.
Zooming out: this is a classic inflection zone — the reaction here could define BTC's next multi-thousand move.
🛠️ Smart traders aren't guessing — they’re preparing for both outcomes.
Trading Wisdom 📜
Inflection points > predictions.
In markets, it’s not about being right — it’s about being ready. If this is the bottom, let the chart prove it before the ego jumps in. 🎯
Disclaimer
Disclaimer: I’m just sharing wisdom, not instructions. No licenses, no guarantees — just years of trading scars and precision chartwork. Be smart, protect your capital, and don’t copy blindly. 138k remains my target for the year guys..let's see!
One Love,
The FXPROFESSOR 💙
A lot of people ask how I trade — truth is, it’s pretty simple. I have a daily budget, and I enjoy trading. I’ve moved away from getting married to altcoins, so you’ll notice I post less of them lately. But I still trade every day. I buy dips around key support/resistance levels and exit just below if invalidated. Sometimes it takes more than one attempt, but patience is part of the game. Yes, I use high leverage — that’s my style, and it keeps me engaged. The real secret? Take some profit when it works. That’s it. 💙

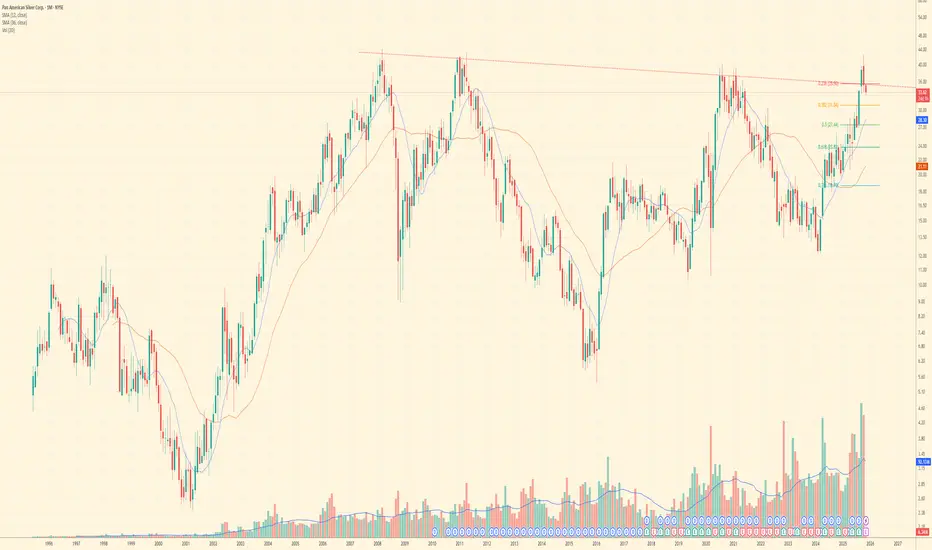
Did PAAS confirm breakout?PAAS is at a crucial inflection point.
- Long-Term Breakout: Price recently broke out above the multi-year descending trendline (red dashed line) with strong volume.
- Price Target: A confirmed breakout opens the door for a potential double in price, aiming towards the all-time highs and beyond ($70.00+).
This technical signal is strongly backed by the company's recent performance:
- Silver Rally: Spot silver trading above $42/oz, driven by industrial (solar) and investment demand.
- Financial Strength: PAAS reported $1B+ cash and a 20% dividend increase tied to net cash.
- Growth Driver: The low-cost Juanicipio asset will boost silver production by 34% and significantly lower all-in sustaining costs next year.
The combination of a strong technical setup and robust fundamental catalysts makes PAAS a prime breakout candidate. Watch the closing price carefully!
Disclaimer: This is not financial advice. Trade responsibly.
The End of Bitcoin’s Bull Cycle — No volumeMaybe we should consider that there’s a risk of a price correction down to $74,000.
It’s hard to say this is the end of the cycle, but it’s important to take profits step by step and move forward with caution — I have nothing more to add.
A bunch of fools caused the end of this cycle, since day 543 after the halving was supposed to mark the end of the cycle — the traditional 4-year cycles.
It’s better to look for bottoms, not tops.

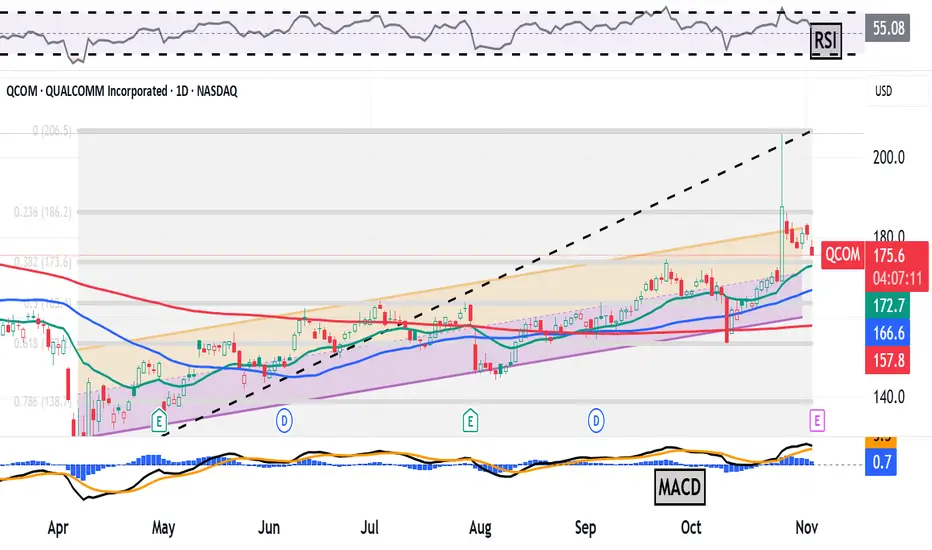
Qualcomm Rose 11% in One Day on AI Plans. What Its Chart SaysSemiconductor designer Qualcomm NASDAQ:QCOM , which is known for providing products to the consumer-electronics industry, rose more than 11% to a 15-month high in a single day last week when it announced a pivot into the world of artificial intelligence. Let's see what QCOM's chart and fundamentals say following the news and ahead of this week's earnings release.
Qualcomm's Fundamental Analysis
QCOM plans to release fiscal Q4 numbers after the market close on Wednesday, with Wall Street currently looking for $2.86 in adjusted earnings per share on roughly $10.75 billion of revenue.
That would represent a 6.3% annual gain in earnings from the $2.69 in adjusted EPS that QCOM reported in the same period last year. Revenue would likewise have risen some 5% from about $10.24 billion a year earlier.
In fact, 16 of the 26 sell-side analysts that I know of that cover this name have revised their earnings estimates higher since the quarter began, while only nine have lowered their projections. (One estimate remains unchanged.)
Of course, markets will also want to hear management's commentary on the shift to AI, which will put Qualcomm in head-to-head competition with likes of Nvidia NASDAQ:NVDA and Advanced Micro Devices NASDAQ:AMD .
Qualcomm's Technical Analysis
Now let's look at QCOM's chart going back some eight months and running through Friday afternoon:
Readers will see that Qualcomm rose 70.5% between hitting a 17-month intraday low of $120.80 on April 7 and a $205.95 session high on Oct. 27 following the AI announcement.
Still, QCOM has for the most part methodically traded during this whole period within the confines of the Raff Regression model that I created above (marked with orange and pink fields).
That said, the stock has come in some after its Oct. 27 blow-off top -- perhaps because Qualcomm's new AI-friendly chips won't be ready for a number of months.
As QCOM pulled back, it felt around for support close to the 38.2% Fibonacci-sequence retracement level of the stock's entire 2025 rally (marked with gray shading in the chart above).
That's the downside pivot here, but there's technical help for Qualcomm not far below the 38.2% Fib level.
QCOM's 21-day Exponential Moving Average (or "EMA," marked with a green line at $171.60) lies nearby. That's where we might find out if the swing crowd is on board with Qualcomm's recent upward move.
If not, Qualcomm's 50-day Simple Moving Average (or "SMA," denoted with a blue line) and its 200-day SMA (the red line) aren't far below the 21-day EMA.
Those are levels where the professional money managers might be, so there's plenty of possible support for QCOM indicated in the chart above.
All in, Qualcomm's upside pivot could be the stock's recent $205.95 high. Conversely, the stock's downside pivot could be that 38.2% Fib level.
As for the stock's secondary technical indicators, Qualcomm's Relative Strength Index (the gray line at the chart's top) is quite robust, yet not overbought technically.
Meanwhile, the stock's daily Moving Average Convergence Divergence indicator (or "MACD," denoted by black and gold lines and blue bars at the chart's bottom) is overtly bullish.
Within the MACD, the histogram of the 9-day EMA is well into positive territory, while the 12-day EMA rides above the 26-day EMA and both are above the zero-bound. Those are all bullish technical signals.
An Options Option
Options traders who want to go long on QCOM while getting paid to take on equity risk might utilize what's called a "bull-put spread."
This is constructed by selling one put and buying a second one with a lower strike, but the same expiration date. Here's an example:
-- Sell one QCOM $175 put with a Nov. 7 expiration date (i.e. after this week's earnings). This costs about $3.75.
-- Buy one QCOM Nov. 7 $165 put for roughly $1.30.
Net Credit: $2.45
Should Qualcomm -- which closed at $180.72 Monday -- never trade as low as $175 prior to the options' Nov. 7 expiration, the trader will simply pocket the $2.45 net credit.
And should the stock trade below $175 at expiration but not below $165, the trader would end up long 100 shares of QCOM at a $172.55.
But what if the shares take a serious beating between now and Nov. 7? Well, if QCOM drops below $165 at expiration, the trader in the example above would have lost $10 on the equity trade less the $2.45 net credit for the bull-put spread. That works out to a $7.55 net loss.
(Moomoo Technologies Inc. Markets Commentator Stephen "Sarge" Guilfoyle had no position in QCOM at the time of writing this column, but was long NVDA and AMD.)
This article discusses technical analysis, other approaches, including fundamental analysis, may offer very different views. The examples provided are for illustrative purposes only and are not intended to be reflective of the results you can expect to achieve. Specific security charts used are for illustrative purposes only and are not a recommendation, offer to sell, or a solicitation of an offer to buy any security. Past investment performance does not indicate or guarantee future success. Returns will vary, and all investments carry risks, including loss of principal. This content is also not a research report and is not intended to serve as the basis for any investment decision. The information contained in this article does not purport to be a complete description of the securities, markets, or developments referred to in this material. Moomoo and its affiliates make no representation or warranty as to the article's adequacy, completeness, accuracy or timeliness for any particular purpose of the above content. Furthermore, there is no guarantee that any statements, estimates, price targets, opinions or forecasts provided herein will prove to be correct.
Options trading is risky and not appropriate for everyone. Read the Options Disclosure Document ( j.moomoo.com ) before trading. Options are complex and you may quickly lose the entire investment. Supporting docs for any claims will be furnished upon request.
Options trading subject to eligibility requirements. Strategies available will depend on options level approved.
Maximum potential loss and profit for options are calculated based on the single leg or an entire multi-leg trade remaining intact until expiration with no option contracts being exercised or assigned. These figures do not account for a portion of a multi-leg strategy being changed or removed or the trader assuming a short or long position in the underlying stock at or before expiration. Therefore, it is possible to lose more than the theoretical max loss of a strategy.
Moomoo is a financial information and trading app offered by Moomoo Technologies Inc. In the U.S., investment products and services on Moomoo are offered by Moomoo Financial Inc., Member FINRA/SIPC.
TradingView is an independent third party not affiliated with Moomoo Financial Inc., Moomoo Technologies Inc., or its affiliates. Moomoo Financial Inc. and its affiliates do not endorse, represent or warrant the completeness and accuracy of the data and information available on the TradingView platform and are not responsible for any services provided by the third-party platform.