Natural Gas Building Momentum for a New Impulsive RallyNatural Gas Building Momentum for a New Impulsive Rally
On the 4-hour timeframe, Natural Gas is forming large continuation patterns, signaling potential for another upward move.
An accumulation phase was observed in early September 2025, followed by another at the beginning of October. As we enter a new month, the price may be preparing to launch a fresh impulsive leg to the upside, as illustrated in the chart, before entering another corrective phase.
Key target levels:
4.28
4.48
4.60
You may find more details in the chart!
Thank you and Good Luck!
❤️PS: Please support with a like or comment if you find this analysis useful for your trading day❤️
Fundamental Analysis

PHARMA Stock @ ATH_LAURSLAbHi traders,
Currently Pharma stock closed higher with Bullish breakout with Bullflag Pattern.
Go long until it breaks previous Monthly Candle Low or Market structure.
Better time entries @ daily timeframe with Technical support and find opportunities in F&O.

Gold frame 15m 3\11\2025This Analysis by Royal Trading Academy for training and teaching gameplay in XAUUSD & Forex

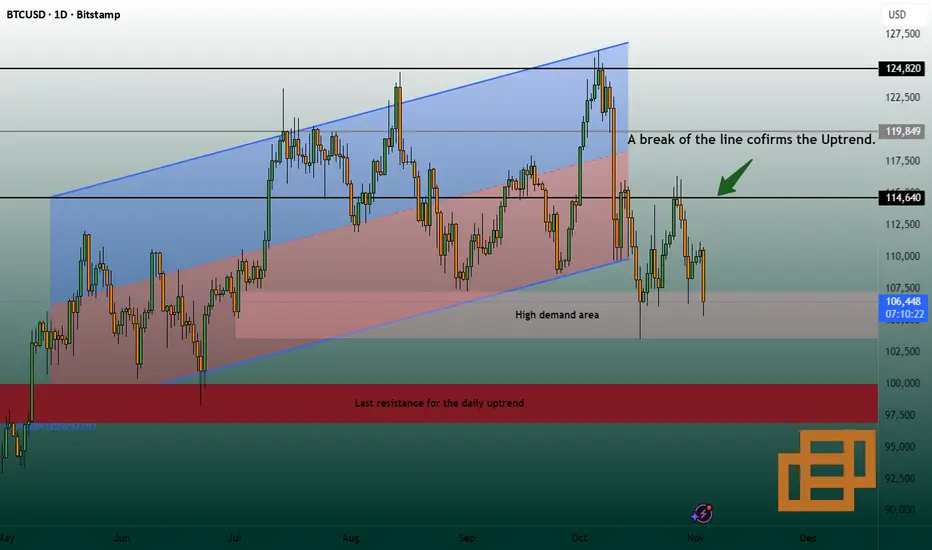
Bitcoin Daily Analysis – November 03, 2025Welcome back to Bitcoin Daily Analysis 💹
😶🌫️ Bitcoin is currently facing a lot of uncertainty — market conditions have created confusion among both short-term and long-term holders.
In my opinion, we’re in a phase where it’s best to wait and observe how price reacts to this zone 👀.
Personally, I still believe the overall trend remains bullish 🚀 — as long as we don’t see a confirmed breakdown below the 98,000 zone on the daily timeframe, the bullish structure stays intact 📈
Your profit and capital safety depend on your patience and consistency — so stay behind the charts and be ready to catch the next opportunity 🎯
And as always — don’t forget risk and capital management 💼📉
Disclaimer:
This content is for informational purposes only and does not constitute financial or investment advice. © DIBAPRISM
Larry D.Kohn
#XAUUSD(GOLD):We are still bearish, this week is decider! Gold experienced a decline during today’s Asian session before recovering sharply to the 4030 area. Currently, the price is consolidating within a narrow range between 4010 and 4030. This behaviour suggests a period of accumulation, where buyers and sellers are unable to establish a clear directional advantage. Given the anticipated volatility in the coming week, particularly with macroeconomic data releases, traders should exercise caution and implement disciplined risk management strategies.
The initial decline in the Asian session may have been driven by short-term profit-taking and liquidity searches by major market participants. However, the swift recovery to 4030 indicates strong buying interest at lower levels, suggesting that gold remains in a bullish trend on larger timeframes. This range-bound movement between 4010 and 4030 is forming a temporary consolidation zone.
A detailed examination of the 1-hour chart reveals multiple touchpoints within this range, indicating strong short-term support at 4010 and resistance near 4030. Candlestick patterns suggest indecision, with several doji and spinning-top formations, further confirming the likelihood of price manipulation and liquidity grabs throughout the week.
Like and comment for more such chart analysis!
Team Setupsfx_

DXY Has 99 Problems, Getting Above 100 Is One!Here we have TVC:DXY on the Weekly Chart.
Now clearly outlined we can see there is a very valuable level here @ 99-100 that the USD:
- Used as Resistance from 2015 til the Bullish Breakout in April 2020
- Used as Support from 2023 til the Bearish Breakdown in April 2025
Fundamentally is a very sketchy scenario because with the Shutdown causing lack of important data needed, The Federal Reserve is making Interest Rate cuts. This weakens the Dollar because it makes it less favorable to Foreign Investing.
On the flip side, Consumers Dollars are able to stretch further allowing them to purchase more but unfortunately we still combat the inflated prices on goods. Companies have the ability to get there raw ingredients cheaper, resume hiring processes, etc.
The slow creeping rise in Inflation has the Federal Reserve in a position to want to be ready to potentially Hike Rates when the Inflation, they believe, from the Tariffs will hit but as of yet, the recent CPI numbers came out not as hot as they thought, possibly playing into the reason for making the latest cut.
Nevertheless, by the last FOMC meeting, it would seem that there is a chance that was the last cut this year that may be made, if:
- Inflation continues to rise
or
- Continued softening labor market

Will $Aradel Aradel Fractal Setup Repeat? Down -18% from ATHARADEL’s Fractal Setup — Will History Repeat?
Is Aradel ( NSENG:ARADEL ) moving in repeating fractals? — a pattern of strong rallies, quick pauses, sharp pullbacks, and steep recoveries. Each dip in this sequence has so far created the foundation for the next rally leg, showing how market psychology often mirrors itself on the chart. Current price: 710naira/share
---
The First Fractal
The first major pattern appeared when price rallied from **₦520 → ₦689 (+29%)**, followed by a mild correction of about –13%.
That retracement found support around the moving average zone, after which the stock continued its steady climb — confirming strong buyer re-entry at lower levels.
---
The Current Setup
This latest fractal looks even more aggressive.
Price surged from ₦580 → ₦869 (+49%) before pulling back sharply — already down roughly –18%.
Currently, the ₦710 zone is acting as a short-term support level.
If this area holds, it could mark the end of the correction and the start of the next bullish swing.
The Fractal Projection
If history rhymes once more, the next upward leg could target the **₦950–₦1,000** resistance range — a natural extension zone aligning with prior swing highs.
However, a decisive breakdown below **₦624** would invalidate the fractal and signal a deeper retracement phase, possibly toward the longer-term trend support.
Summary
* Current support: ₦710 (key pivot)
* Fractal invalidation: ₦624
* Next potential target: ₦950–₦1,000
* Trend bias: Bullish if ₦710 holds; neutral-to-bearish if ₦624 breaks.
Fractals don’t predict price — they simply hint where institutional interest and historical rhythm may align. #ARADEL #NGX #NigerianStocks #PriceAction #FractalPattern #TechnicalAnalysis #InvestingNigeria

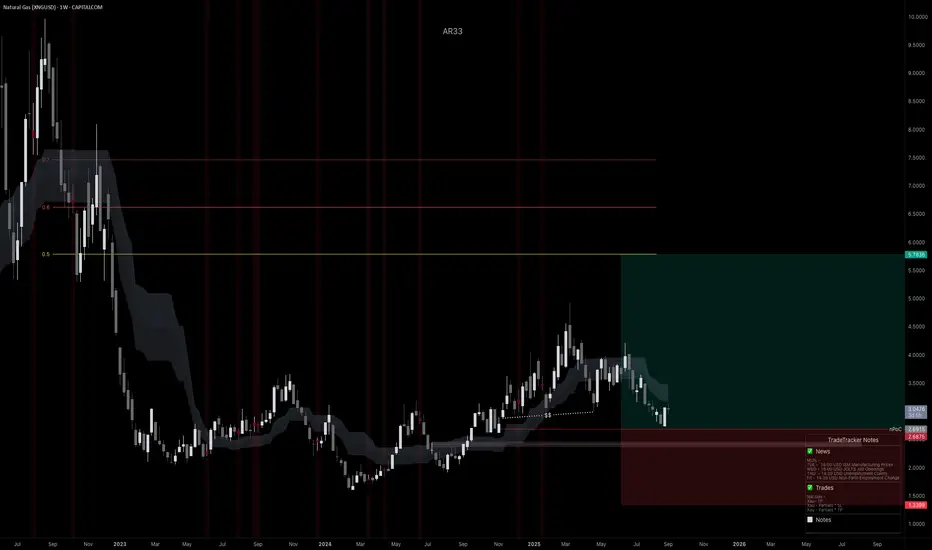
XNGUSD, Accumulation to Expansion? Weekly Long Into Winter RiskI’ve initiated a long on Natural Gas from weekly structure. Price has rotated inside this area since ’23 and is now reacting at a confluence of trendline support + prior demand. The plan is to hold into Q4, when seasonality (heating demand + potential hurricane/LNG disruptions) often provides upside tailwinds. Risk is defined on the weekly chart; I’ll manage around swings and let the position work.
Technicals (Weekly)
• Range base reclaimed: Price is bouncing from the same 2023–2024 accumulation zone (roughly 2.5–3.0).
• Multi-touch trendline support: Current candle is reacting at the rising base trendline; wicks show responsive buying.
• Structure targets: First objective is a move back into mid-range supply; extension aims toward the upper band shown on the chart.
Fundamentals Supporting Long Bias
• Seasonality: Q4 typically brings rising Heating Degree Days across the Northern Hemisphere; winter risk premia often get priced ahead of the draw season.
• LNG pull: Ongoing ramp in global LNG demand + incremental U.S. export capacity tends to tighten the domestic balance on cold forecasts or unplanned outages elsewhere.
• Supply discipline: Gas rig counts have lagged after the 2024 price slump; that slower supply response can tighten later-year balances if weather cooperates.
• Weather & Gulf risk: Peak hurricane season can interrupt Gulf production and processing, periodically supporting price.
• Europe draw season: As EU storage transitions from injection to draws, import needs rise, keeping a bid under seaborne gas.
Trade Plan:
• Entry: From weekly support (see chart).
• Management: Trail below fresh higher lows on the daily; take partials at fib/structure levels; let a runner target the upper band if momentum broadens.
What Breaks the Thesis
• A persistently warm Q4, outsized storage overhang into winter, major LNG outages/delays, or a renewed surge in production that swamps demand.
Note: Please remember to adjust this trade idea according to your individual trading conditions, including position size, broker-specific price variations, and any relevant external factors. Every trader’s situation is unique, so it’s crucial to tailor your approach to your own risk tolerance and market environment.
Gbpusd buyGbpusd buy@1.3220
SL @ 1.3130
Tp @ 1.3313
I am looking at buying Gbpusd cfd / 6B futures price is testing a key demand zone after sweeping out liquidity i expect price to rally to the upside.

Monthly Analysis: Bitcoin (BTC), Issue 279 The analyst expects Bitcoin’s price to decline by the specified end time (countdown timer), based on quantitative analysis.
The take-profit level simply represents a potential price range during this period — it’s optional and not a guarantee that the price will reach it.
You don’t need to go all-in or use leverage to trade wisely.
Allocating only a portion of your capital helps keep overall risk low.
Our approach follows institutional portfolio management principles — not the “all-in or blow-up” style often promoted on social media.
Performance is evaluated over the entire time window, regardless of whether the take-profit level is hit.
The validity of this analysis is based on a specific time range (until 01 Dec 2025), and after this period, the analysis will be reviewed and updated (once every 28 days).

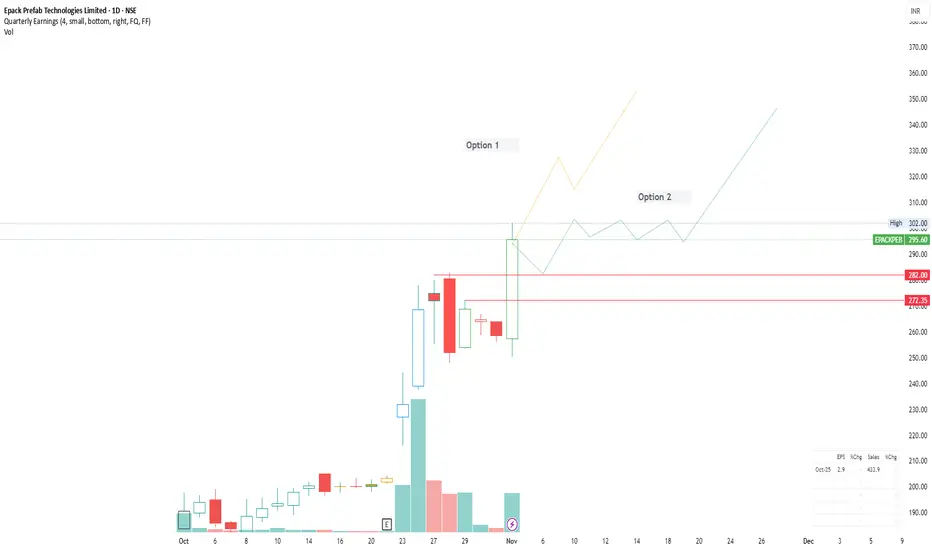
ePack Prefab - Go LongThe company's shares were listed on the NSE and BSE on October 1, 2025, following a ₹504 crore IPO. Price consolidated for few days created a new based and may go up based on the Q2 results and company's Credit rating to A+
The stock debuted at a discount but saw a significant rally after the strong Q2 results were announced, with the share price hitting an all-time high of ₹251 on October 24, 2025.
November Gold Paradox: Expected Strength Meets Blurred Direction
🍂 November typically brings seasonal bullish moves for Gold; demands from India and China, central bank interest, and safe-haven flows as the year winds down.
⭐But November 2025 opens with hesitation, not momentum.
October closed with fresh all-time highs, followed by a sharp end-month correction that broke short-term structure. Now, Gold begins November range-bound, lacking both clarity and fundamental conviction.
Contributing to this indecision is the U.S. government shutdown, which has delayed critical economic data. Without jobs reports or inflation metrics, the Fed has no updated visibility and traders are left without macro confirmation to support directional conviction. While shutdowns often support Gold as a safe haven, the current blackout has instead amplified uncertainty.
🔹 This first week already carries weight: ISM Manufacturing PMI on Monday (negative for Dollar as of recent release) and ADP Employment on Wednesday; two of the few confirmed releases still standing despite the shutdown. They could offer short-term directional clues if volatility aligns with structure, but just as easily trigger reactive spikes that fade within hours. Either way, the message is the same let structure confirm before conviction takes over.
Until that changes, structure not sentiment is the only valid guide.
📚 November’s Setups in Disguise
Gold is trading November more in anticipation.
Because the market isn’t lost, but simply waiting for structure to confirm direction.
Our metal is moving between defined zones, reacting level to level, not to headlines or speculation.
For now, price is holding inside a decision area, no breakout yet and that telling us to be patient.
Here’s the paradox:
→ If Gold begins to rally this month, the whispers of an early Fed pivot will return. Risk appetite expands, and momentum traders chase continuation.
→ If it sells off, those same expectations get priced out. The safe-haven flows unwind, and bearish narratives resurface.
→ But if Gold simply stays trapped in a wide, reactive range both buyers and sellers become liquidity for one another if they do not pay attention.
And that’s the part most traders miss. November is a preparation month.
Volatility without confirmation is dangerous.
→ Read the structure, not the headlines.
→ Trade the reaction, not the assumption.
→ Focus on your system, not the noise.
Clarity will come, but maybe not in the first week.
⚖️ The Mindset Shift This Market Demands
Beware this not the Gold environment we were trading even two months ago.
We’ve entered a phase where volatility has changed: one-minute candles can travel 200+ pips, and price can sweep both sides of structure in minutes. Volumes in a day can exceed 2000+ pips.
🔹 Think in wider zones, not narrow scalps.
High timeframe levels — like H1/30M and H4 — are providing more stability in these volatile conditions. Entries defined there, confirmed on M15 or M5, are showing better follow-through.
🔹 Consider reducing your lot sizes.
Not as a rule, but as a response to the increased range and unpredictability. What worked with older volatility may now lead to outsized losses in the blink of an eye.
🔹 Let go of urgency.
This isn’t about catching every move. In fact, the best setups in this market come from not chasing, but letting structure unfold first. 1 good setup/day is more than enough.
🔹 Trade with the trend first — countertrend only with caution.
The current volatility makes every retracement look like opportunity, but most reversals are just liquidity sweeps. Until structure confirms a real shift, fading moves is riskier than riding them.
XAUUSD has changed pace again. And the traders who are adapting ,without needing to predict ,are the ones who’ll stay in profit in this cycle.
This November isn’t a month for bold predictions, so let’s trade what’s real, adjust often, and survive cleanly into December, with capital and clarity intact.
If this article gave you clarity for the weeks ahead, drop a 🚀 and follow us ✅for Trading Psychology articles and daily ideas.

Vintage CoffeeVintage Coffee has given good result
EBIDT saw a YoY increase of 127%.
EPS (Earnings Per Share) rose by 125% to ₹1.37.
The company's revenue grew by 89.51% YoY to ₹135.61 crore.
The operating profit surged by 345.7%, indicating improved operational efficiency and cost management.
The growth suggests successful market expansion strategies.

Monthly Analysis:Ethereum (ETH), Issue 279The analyst expects Ethereum’s price to decline by the specified end time (countdown timer), based on quantitative analysis.
The take-profit level simply represents a potential price range during this period — it’s optional and not a guarantee that the price will reach it.
You don’t need to go all-in or use leverage to trade wisely.
Allocating only a portion of your capital helps keep overall risk low.
Our approach follows institutional portfolio management principles — not the “all-in or blow-up” style often promoted on social media.
Performance is evaluated over the entire time window, regardless of whether the take-profit level is hit.
The validity of this analysis is based on a specific time range (until 01 Dec 2025), and after this period, the analysis will be reviewed and updated (once every 28 days).

CADJPY - Bullish IdeaA through Fundametnal and technical analysis.
CAD is looking strong this week while JPY is beasrish.
Sasonality alligns with the analysis.


XAUUSD – Long Setup (15m)Looking for a long entry around 4010.80, aligning with prior demand + HVN shelf + bullish FVG.
Stop below 3990 (invalidates structure).
Targeting 4060.80, which aligns with the opposing POI high and completion of the prior imbalance.
Structure shows liquidity sweep under 3990, reclaim of value area, and bullish displacement through 4020 confirming buyers in control.
⚙️ Trade Plan:
• Entry: 4010.80
• Stop: < 3990
• TP1: 4035 (LVN reaction zone)
• TP2: 4060.80 (POI completion)
• R:R ≈ 1:2.7
Watching for continuation during London / NY expansion windows.

Week 11.03 - 11.07 Prep Last Week :
Last week we opened on a gap above Value and made a push over Edge top where we found our top and larger sellers for the week. Return to above VAL provided selling back into and eventually under the Edge. Holding under the Edge got us under MAs and changed the trend from uptrend to downtrend on 30m and 1h Time Frames, 2hr and 4hr frames only changed into correction without fully changing into downtrend. Holds under the Edge also provided good sells into lower VAH/Value for the gap fill towards end of the week when we got Month End profit taking but we were not able to fill the gap, instead we ran out of Supply Friday Midday and got end of the week short covering which drove price back out Value without filling the gap or staying in Value.
This Week :
So far this week we have again opened over Value and have been balancing between VAH and Edge in Globex, right now Edge again provided good sell back towards VAH and it may seem like it can continue selling but this will be the area to be careful at, at least to start the week as we are starting New Month, New week and it would be best to see what order flow we get, of course it is possible that we just continue lower right away but also this could be an area where we will see more covering above the Gap which can keep price over it and eventually once selling slows down could give another rotation towards/into and possible over the Edge.
As mentioned last week we are currently inside 915 - 875 +/- Intraday Range with 900 - 890 being its mean and price can stay within this range until it accepts under 870 - 65 areas without popping back over 75 then we know we have accepted in lower Intraday Range of 870 - 830 and can continue through its targets which would be 855 - 845 Mean area and down into/towards 830 - 20s. If we do hold this current range we are in then it is still possible that it will bring more buying as buyers like to start getting in once price holds which could still push us up towards/over the Edge and maybe even back towards above VAL, how far over Edge we get would be determined by order flow IF it happens but this will be the spots to be careful on the long side instead of getting excited for new ATH or continuation over previous one even if we take it out. Our bigger sellers will still be lurking over the Edge and closer to above VAL which means if we see a push out we could either see a quick or after consolidation return back under the Edge.
For price to change things back into stability or strength from here we would need a strong push over VAL with Medium/Larger MAs following behind us for support to be able to hold the price in/around new Value to show acceptance in New Hourly Range, unless this happens we have to keep thinking that top is in for now and look for return trips away from it which would make price want to return to previous Value.
If we do get strong selling continuation today/tomorrow through 70 - 65 and keep it under then of course we will go with that and keep targeting the Mean/Gap fill and push under the Mean but unless you see clear selling under 70 - 65 careful looking for too much continuation from here early on, it might take few days to decide what we will do and get ready for a good move into lower Value which maybe happen either from above the Edge or once we hold under it long enough and change trend on 2hr and 4hr Frames.

I Future on Sale — Buying Nvidia Amid Trade War FearsI just bought NVDA Jan 2026 185 Call @ $16
I trust top macro analysts calling for strong Q4 ’25 and Q1 ’26.
Chips will likely get tariff exceptions.

Sell CHF 0.8070 HSC+SHCHF did a HSC at LDN with a SH it moved 21pips in LDN session so I put TP at 10.5 and SL at 10

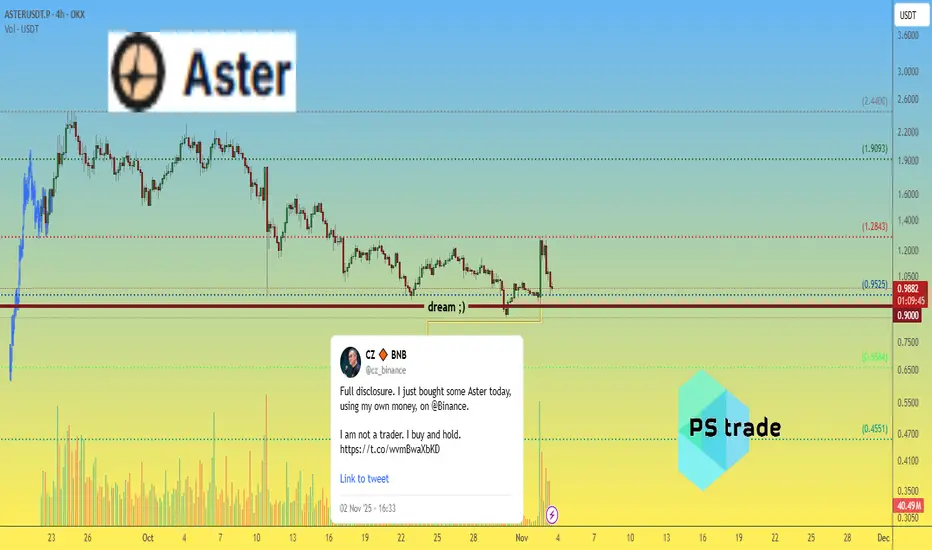
Aster price analysisIt’s been a month and a half since the previous idea
and the dream came true: #Aster finally dropped to $0.90 💥
Did anyone here add this gem to their long-term portfolio? 😉
By the way, #CZ said yesterday he’s “not a trader, but a holder” — and right after that, the market pulled off a solid pump 😏
Now the main question, if we look at the OKX:ASTERUSDT.P chart:
📉 Is $0.90 already the bottom?
Or are we in for another “gift” — a second bottom around $0.65,
maybe even a third one near $0.45? 😬
What do you think — which “bottom” will turn out to be the real one? Share your thoughts below 👇
______________
◆ Follow us ❤️ for daily crypto insights & updates!
🚀 Don’t miss out on important market moves
🧠 DYOR | This is not financial advice, just thinking out loud
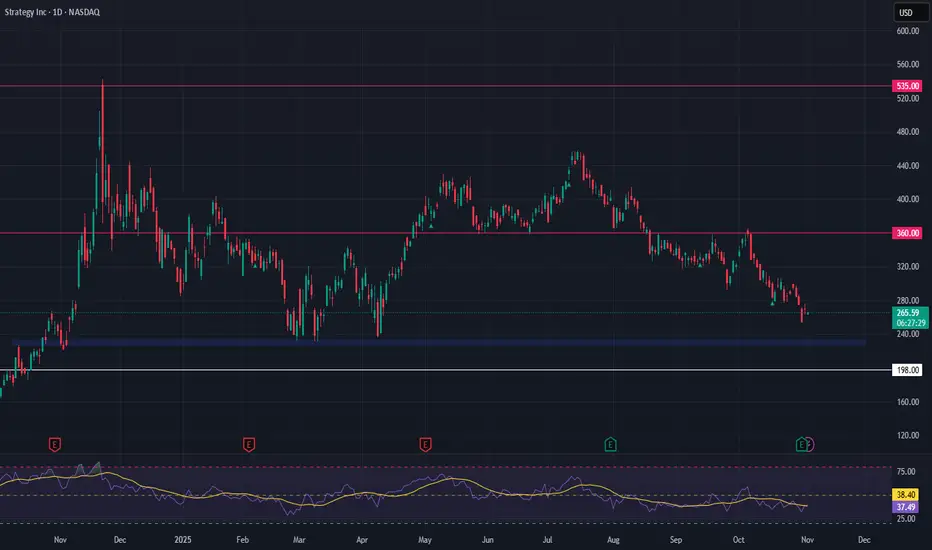
Strategy Inc (MSTR) – High-Beta Bitcoin Proxy at Key SupportStrategy Inc NASDAQ:MSTR has delivered another strong quarterly report, underscoring its continued commitment to aggressive Bitcoin accumulation. With over 158,000 BTC on the books, MSTR has firmly positioned itself as a leveraged proxy for Bitcoin, offering equity traders indirect crypto exposure. This bold balance sheet strategy has also pushed MSTR into alignment with S&P 500 inclusion criteria — a potential catalyst if index inclusion materializes.
Technically, the stock is now retesting a key support zone between $228 and $233. This level has historically held well and may offer a high-conviction entry for those anticipating a BTC rebound. Should Bitcoin aim for new highs, MSTR could respond with outsized upside, though traders must account for the volatility and downside risks that come with crypto-correlated equities.
🎯 Trade Setup:
Entry Zone: $228 – $233
Take Profit Targets: $360 and $535
Stop Loss: $198
This setup offers a high-risk, high-reward opportunity. As always, manage position size carefully and watch BTC price action for confirmation.
Nike Isn’t Flying AnymoreNike was once an unstoppable consumer giant. However, with its last all-time high four years in the rearview mirror, some traders may see downside risk.
The first pattern on today’s chart is the June 11 high of $64.85. NKE bounced above that level on October 10 but ended the month slightly below it. That may indicate support isn’t holding.
Second, the falling 200-day simple moving average (SMA) is falling. Prices are also slipping back below it, which may suggest its long-term trend is bearish.
Third, the 8-day exponential moving average (EMA) is below the 21-day EMA. That could mean its short-term trend is also bearish.
Fourth, the stock tried to rally after its last earnings report but buyers soon evaporated. Does that reflect a lack of enthusiasm about its fundamentals?
Finally, chart watchers may see risk of NKE revisiting its 52-week low at $52.28.
TradeStation has, for decades, advanced the trading industry, providing access to stocks, options and futures. If you're born to trade, we could be for you. See our Overview for more.
Past performance, whether actual or indicated by historical tests of strategies, is no guarantee of future performance or success. There is a possibility that you may sustain a loss equal to or greater than your entire investment regardless of which asset class you trade (equities, options or futures); therefore, you should not invest or risk money that you cannot afford to lose. Online trading is not suitable for all investors. View the document titled Characteristics and Risks of Standardized Options at www.TradeStation.com . Before trading any asset class, customers must read the relevant risk disclosure statements on www.TradeStation.com . System access and trade placement and execution may be delayed or fail due to market volatility and volume, quote delays, system and software errors, Internet traffic, outages and other factors.
Securities and futures trading is offered to self-directed customers by TradeStation Securities, Inc., a broker-dealer registered with the Securities and Exchange Commission and a futures commission merchant licensed with the Commodity Futures Trading Commission). TradeStation Securities is a member of the Financial Industry Regulatory Authority, the National Futures Association, and a number of exchanges.
TradeStation Securities, Inc. and TradeStation Technologies, Inc. are each wholly owned subsidiaries of TradeStation Group, Inc., both operating, and providing products and services, under the TradeStation brand and trademark. When applying for, or purchasing, accounts, subscriptions, products and services, it is important that you know which company you will be dealing with. Visit www.TradeStation.com for further important information explaining what this means.
