2H | BTC/USD Bullish Setup & Key LevelsBitcoin is currently trading near $89,854, showing signs of recovery after retesting trendline support. Price action suggests a potential bullish continuation if the market holds above the $89,000 zone.
Key Levels:
Entry Zone: $89,000 – $90,001
Target 1: $92,002
Target 2: $95,004
Invalidation: $86,026 (break below this level negates bullish bias)
Scenario:
If price sustains above the bullish zone and breaks $90,001, buyers may push toward $92,002 and possibly $95,004.
Failure to hold above $89,000 could lead to invalidation at $86,026.
Disclaimer:
This analysis is for educational purposes only and does not constitute financial advice. Always confirm signals and manage risk.
Fundamental Analysis

Gold Spot / U.S.Dollar . 1 HBonjour and greetings to my dear followers,
This is a brief analysis to catch the momentum on a 1-hour time frame, so please don’t overlook the shorter-term view. The 1-hour chart is the Gold Spot chart (XAUUSD), which clearly shows buying opportunities. Based on the DXY, this analysis is updated.
Chart review:
Monthly target based on the DXY’s downward step: the gold target is 4756.51 dollars, and the 1-hour buying area is 4223.26. A buy is appropriate with confirmations. The 4-hour liquidity is 4163.46, and the decision zone is 4061.18. At the moment I have received very strong sell confirmations, so this week should present excellent selling opportunities up to these levels, with confidence.
The weekly buying zone is 3378.77 dollars, where the likelihood of price reaching these levels is very high. These price points have been observed for gold in the past several times; we will reassess the chart. After price reaches the 1-hour, 4-hour, and daily zones and receives a sign of renewed upward confirmation, we will proceed.
When the price reaches these levels, we will enter buying positions upon receiving appropriate confirmations.
Position updates:
I regularly update both buy and sell positions on the 4-hour and daily time frames and will republish this analysis.
Risk disclosure:
This analysis is for informational purposes only and should not be considered financial or investment advice. Trading in financial markets carries risks and may result in the loss of your capital. Therefore, please conduct the necessary research and enter trades with full awareness before taking action.
Thank you!
Wishing everyone success!
Fereydoon Bahrami
“A retail trader in the Wall Street trading center (Forex).”

It’s Not Your Strategy. It’s Your Mindset.Most people lose money in markets not because they don’t know how to trade,
but because their mindset can’t hold up.
--
Before we start investing, most of us walk into the market with a huge sense of excitement.
The dream that a small amount of money could turn into something life-changing.
A few early wins that make you think, “I can do this.”
And that quiet fantasy that maybe… this is the thing that finally flips your life around.
But reality is colder than most people expect.
At first, everyone looks for the “answer.”
They study charts, hunt for indicators, learn strategies—anything that feels like a shortcut to certainty.
Yet after some time, when you look at the account… the reason people collapse usually becomes one thing:
It’s not that the strategy failed.
It’s that the mindset broke first.
--
Now, the market looks simple on the surface: it goes up or it goes down.
And because of that, early on, it’s totally possible to have a streak where you “get the direction right” a few times just by luck.
When those experiences stack up, people start thinking:
“Trading is easy.”
“I just need this one indicator.”
Of course, there are phases where certain indicators work beautifully.
But the moment you believe the chart has a single “correct answer,” the real problem begins.
The reason a few lucky wins can feel like “proof” is tied to psychology.
Psychology calls this Reward Reinforcement .
In simple terms: when you get rewarded by coincidence, your brain stores it as “the right answer.”
For example, imagine you use an indicator and—by chance—you win three trades in a row.
Your brain immediately starts telling you:
“This indicator works. I’ve found the edge.”
But the market doesn’t hand out answer sheets.
Markets move in probabilities, and even the same setup can produce a different outcome each time.
Yet for beginners, a few early wins can make a probability game feel like a “skill” game.
And that illusion becomes the starting point for almost every mistake that follows.
--
Before you begin trading seriously, take a moment to look at the table above.
Do you see those loss rates for retail traders and day traders?
There are markets and products where, out of 100 people who trade, 80+ end up losing money.
I’m not showing this to scare you.
I’m showing it because it’s reality you need to know before you start.
※ The samples/periods/products differ, but the conclusion is the same:
short-term retail trading—especially with leverage—ends in losses for the majority.
--
Let me ask you one simple question.
When you take a loss, what’s the very first thought that shows up in your head?
“It's fine—I’ll just make it back quickly. Let me trade off my feel.”
“Why did I lose? Did I follow my rules? Let me review this calmly.”
Which one should you choose?
People who choose #2 tend to survive.
People who choose #1 slowly get pushed out of the market.
--
Now let’s say Bitcoin hits RSI oversold, and it looks like “it can’t go much lower.”
Yes—Bitcoin often shows a short bounce when RSI reaches oversold.
But what happened overall?
We went through a move that dropped roughly -35% from the high.
So can we honestly say: “RSI oversold = guaranteed rebound” is a good strategy?
Probably not.
Even after oversold readings, price still broke lower five different times .
And no matter how well you try to manage risk, there’s a high chance your mindset breaks first in that process.
--
Because beginners usually follow a pattern like this:
“Oversold = it should bounce” → first entry
A small bounce → “I was right” → confidence goes up
Breaks the low again → panic between stopping out or averaging down
Re-enter → breaks the low again
What remains isn’t just “loss.”
What remains is shaken judgment.
In markets, loss is dangerous—
but shaken judgment is even worse.
Once your judgment is shaken, the next trade stops being a probability game and becomes an emotion game.
--
Here’s the one conclusion you should take from this:
The problem isn’t RSI.
The problem is the beginner mindset that tries to find “the answer” with one indicator.
RSI is a tool—nothing more.
But most people use it like an answer key.
“Oversold means it must bounce.”
“It shouldn’t drop from here.”
“This time is different.”
The moment those thoughts enter your head, you stop trading analysis and start trading certainty .
And trading certainty is exactly what breaks your mindset the moment a stop loss hits.
--
Once your mindset cracks, the chart stops being a place to find truth—
and becomes a place to find excuses.
Beginners keep changing indicators for a simple reason:
not because the indicator is bad, but because they don’t want to face the loss.
Changing indicators creates the feeling of “I found the cause.”
And that feeling creates: “Next time will be fine.”
That feeling pushes you back into another entry.
But one thing never changes:
There are no rules.
So the same mistakes repeat.
1) Do you want to be right once?
2) Or do you want your account to stay alive?
Even if you’re right sometimes, you still need to survive long enough to catch the next opportunity.
Please don’t forget that.
--
What beginners must think about first
Even with a 60% win rate, a max losing streak of 5 trades can happen.
Even with a 70% win rate, a max losing streak of 4 trades can happen.
So what happens if every time you stop out, your account drops -20% or -30%?
The answer is simple:
A few consecutive stop-outs can make your account unable to survive.
For example, even a trader with a 70% win rate can still experience around a 4-loss streak over 100 trades.
If your stop loss is -20%, then 4 consecutive losses isn’t “just -80%.”
four times means: 0.8×0.8×0.8×0.8 ≈ 0.41
So you’re left with roughly 41% of your original capital.
That’s not a “dip.” That’s losing more than half.
If your stop loss is -30%, it’s even worse.
You’re left with roughly 24% of your original capital.
Here’s the scary point:
This doesn’t happen because your win rate is low.
It happens because losing streaks are natural in a probability game—even with a high win rate.
That’s why you shouldn’t bet big based on “this one is definitely right.”
You should assume losing streaks will happen and minimize the damage of a single stop-out.
A simple, realistic approach is to keep your risk per trade around 3% of your total capital.
If you risk -3% per loss, then even a 5-loss streak is around a -14% drawdown.
That may still shake you—but it usually doesn’t create enough pressure to blow up the account with revenge trades.
On the other hand, if you risk 10% per trade, then after 5 consecutive losses you’re left with only about 59% of your capital.
At that point, people don’t “analyze the chart.”
They start forcing the market to make sense because they’re desperate to recover.
In the end, most beginners fail for a simple reason:
Not because the signal was wrong,
but because they started with sizing that can’t survive consecutive losses.
--
So here are the three points beginners must lock in first:
A. Set stop-loss rules statistically—not emotionally
Stop losses shouldn’t be based on “I feel like it.”
They must be set so you can survive even when losing streaks hit.
B. Before you enter, think “invalidation,” not “certainty”
Not “This must bounce because the indicator says so,”
but “If this level breaks, my idea is wrong.”
C. Build a structure that can handle consecutive losses
Markets rarely move in a clean straight line.
They shake, trap, shake again… and then move.
So you must design for streaks , not a single loss.
--
One last piece of advice:
The goal of trading isn’t to make one huge win.
It’s to build a structure that doesn’t blow up.
I understand the desire for life-changing money.
But the numbers are already there: even with a high win rate, losing streaks are inevitable.
Again— even someone with a 70% win rate can very realistically see a 4-loss streak in 100 trades.
If your stop is -20% or -30% each time… recovery becomes extremely difficult.
--
Trading should be treated like a business.
If you’re a business owner, you don’t “go all-in” in a way that one mistake can kill the entire company.
A business owner thinks like this:
“Can we survive if revenue dips this month?”
“Can we handle fixed costs if customers drop?”
“Can we recover even in the worst case?”
Trading is the same.
What matters isn’t being right on one trade—
it’s building an account that stays alive even when you’re wrong multiple times in a row.
But beginners do the exact opposite:
When they win, they size up.
When they lose, they size up even more.
Why?
Because they want to make money fast.
And when they lose, they want to get it back fast.
Remember: from that moment, trading stops being analysis and becomes emotion.
And emotional traders are the market’s favorite opponent.
Set your goal as survival first—not profits.
Keep your risk small but consistent.
Enter based on invalidation, not certainty.
Build a system that doesn’t break under losing streaks.
Even if you only do those three things, you can avoid the trap that destroys most beginners: revenge trading.
The people who win long-term aren’t the ones who predict charts best—
they’re the ones who build a structure that doesn’t die.
Starting today, stop chasing “the answer,”
and start trading your rules.
That’s the moment the chart stops being a tool that shakes you—
and becomes a probability business you can actually run.
Thank you for reading.
--
If this post helped you even a little, feel free to leave a Boost (🚀) and a short comment (💬).
It helps me understand what’s genuinely useful, and it gives me strong motivation to keep posting better education and analysis.
And if you’d like, hit Follow so you don’t miss the next post.

NQ at Crossroads: AI Optimism Meets Auction Reality1. Macro Context and Narrative
The Nasdaq continues to trade at the intersection of macro-optimism and valuation sensitivity. The underlying narrative remains dominated by growth expectations, policy signaling, and the ongoing AI investment cycle. While rate volatility and geopolitical headlines continue to inject short term noise, the broader sentiment surrounding NQ remains constructive, albeit increasingly selective.
AI remains the central driver of price discovery in the index. Capital expenditure commitments tied to data centers, semiconductors, and cloud infrastructure continue to reinforce the long term growth narrative. Market participants have been willing to pay a premium for earnings visibility tied to AI monetization, particularly among mega cap constituents that dominate NQ weightings. However, as expectations rise, the market has become less forgiving. Each earnings cycle and macro headline is now filtered through a valuation lens, which has resulted in more two way trade and sharper rotations rather than one directional expansion.
This shift has created an environment where upside progress requires acceptance and follow through, while failure to hold value areas invites responsive selling. In our opinion, sentiment is no longer euphoric but remains optimistic, with positioning sensitive to both macro headlines and technical acceptance.
2. What the Market Has Done?
• The market spent August in a well defined consolidation range, building value and compressing volatility.
• In September, the market imbalanced higher out of that consolidation range and trended upward, reaching the 25400 area and printing new all time highs.
• On October 10, the market sold off sharply down to 24250, which aligned with the high of the prior consolidation range, as Trump renewed China tariff threats.
• Buyers responded at that level and the market balanced, forming bid block 1.
• The market then resumed its uptrend and made new all time highs as US China tariff tensions eased, supported by headlines around Trump and Xi meeting and confirmation of a trade deal.
• From the end of October through the rest of November, the market stalled at 26400, where sellers re entered and auctioned price lower toward 24709, which aligned with the bid block midpoint.
• Buyers attempted to reassert control and bid prices higher, but sellers stepped down offers at 25850, the level where they had previously taken control and drove prices lower through the bid block to 24000 which aligns with the top range of the consolidation range.
• Buyers responded again at 24000 and successfully auctioned price back up toward 25850.
• Over the past week, the market balanced within the December 1 weekly range and value area, but sold off on Friday and closed below the December 1 weekly low.
3. What to Expect in the Coming Week
The key level to watch remains the previous week’s settlement at 25213.50.
Bullish Scenario
• If the market is able to hold above 25213.50, I expect a move back toward the 25850 area, which aligns with composite weekly VAH and the weekly one standard deviation high.
• There is a high probability of two way repair within the prior week’s low volume area between 25213.50 and 25475, which aligns with the two week composite VAL, before continuation higher through the previous week’s value area toward 25828.50.
• If sellers fail to respond in that zone, the market could extend higher toward 26250, which aligns with the October 27 weekly VAH, and potentially toward 26444, the weekly two standard deviation high, to make new all time highs.
Bearish Scenario
• If the market is unable to hold above 25213.50, expect a move lower toward the November 24 weekly VPOC, where buyers should respond.
• Failure of buyers to hold there opens the door for continuation lower toward 24600, which aligns with the November 24 weekly low volume area and the weekly one standard deviation low.
• Further weakness could target the 24400 area, which aligns with a key daily support level.
Neutral Scenario
• If the market lacks volume, and velocity while attempting to move above 25500, which aligns with the prior week’s value area low, or below 24600, which aligns with the November 24 weekly VPOC, expect two way rotation and balance to develop.
Conclusion
In our opinion, NQ remains structurally strong, but the market is no longer forgiving. Acceptance and follow through are required for upside continuation, while failure to hold key value references continues to invite responsive selling. With AI optimism still intact but valuations elevated, the index is increasingly dependent on auction quality rather than narrative alone. As always, context, acceptance, and participant response at key levels will define the next leg.
What is your take on NQ for the upcoming week? Please drop a comment and give a boost so that more from the community can join in the conversation.
Disclaimer: This is not financial advice. Analysis is for educational purposes only; trade your own plan and manage risk.

Market Insights with Gary Thomson: 15 - 19 DecemberMarket Insights with Gary Thomson: UK Jobs, US NFP & CPI, and BoJ Rate Call You Can’t Ignore
In this video, we’ll explore the key economic events and market trends, shaping the financial landscape. Get ready for insights into financial markets to help you navigate the week ahead. Let’s dive in!
In this episode of Market Insights, Gary Thomson unpacks the strategic implications of the week’s most critical events driving global markets.
👉 Key topics covered in this episode:
— UK Unemployment Rate
— US Nonfarm Payrolls and Unemployment Rate
— US Inflation Rate
— BoJ Interest Rate Decision
Gain insights to strengthen your trading knowledge.
Disclaimer: This video represents the opinion of the Companies operating under the FXOpen brand only. It is not to be construed as an offer, solicitation, or recommendation with respect to products and services provided by the Companies operating under the FXOpen brand, nor is it to be considered financial advice.

Bullish on EURUSDPrice has been consolidating like it wants to trade long, candles on the 4H - 1H closed out bullish giving me the confirmation that price will trade long

Coca-Cola Cools the Sale of Costa CoffeeHot Coffee, Cold Deal: Coca-Cola Cools the Sale of Costa Coffee
Ion Jauregui – Analyst at ActivTrades
The aroma of coffee does not always guarantee a good deal. Coca-Cola (NYSE: KO) could see the sale of Costa Coffee to private equity firm TDR Capital cool off as early as this weekend, according to Financial Times. The obstacle is as classic as it is delicate: price. While the buyer revises its valuation expectations, Coca-Cola is trying not to let go of the cup entirely and aims to retain a minority stake in the business.
This is no minor issue. In 2018, the Atlanta-based giant paid $5.1 billion to acquire Costa from Whitbread, with the objective of opening a new growth avenue beyond soft drinks and gaining direct exposure to the global coffee market—one of the few consumer segments that continues to grow even in colder economic environments.
An Uncomfortable Asset in a Highly Predictable Company
From a fundamental perspective, Coca-Cola remains a machine of stability. Recurring revenues, solid margins, strong cash generation, and a consistent dividend policy continue to position the stock as a safe haven within the consumer sector. Precisely for that reason, Costa Coffee has always been a complex asset to integrate.
The coffee business requires higher operational investment, greater exposure to labor costs, and a management model very different from Coca-Cola’s traditional bottling-focused structure. The potential sale is viewed by the market as an attempt to return to the core business, reduce complexity, and reinforce financial discipline. If the transaction is delayed or fails, the debate returns to the table: is Costa a strategic growth lever, or a drag on a business model defined by predictability?
Technical Analysis: Consolidation While Awaiting Catalysts
From a technical standpoint, Coca-Cola shares are clearly in a consolidation phase. Since March, the price has moved within a well-defined sideways range, consistent with levels observed in September 2024.
Main range: between $65 and $72.91, the latter marking the highs reached on December 1.
Mid-range zone: located around $69.00, with a slightly lower technical point of control near $68.15, where the market has repeatedly shown buying interest.
Technical indicators support this pause in momentum. The RSI remains in neutral territory, showing no signs of overbought or exhaustion, while the MACD reflects technical pullbacks toward the mid-range following the dividend adjustment. This has temporarily pushed the price below the 50- and 100-day moving averages, without damaging the stock’s long-term bullish structure.
In trend terms, Coca-Cola remains bullish over a broader horizon, although 2024 and 2025 have been characterized by sideways price action, typical of defensive stocks in environments of macroeconomic uncertainty and elevated interest rates.
The candle formed in the most recent weekly session suggests an attempt at a corrective bullish reversal from the middle of the range. Should the price manage to consolidate above this area, the bullish scenario would regain traction, with an initial objective at a breakout above recent highs and a technical projection toward the $75 level.
Conversely, a clear break below $68 would open the door to a corrective move toward annual lows, reinforcing a more cautious outlook.
Always Coca-Cola
Coca-Cola remains Coca-Cola: predictable, defensive, and resilient. But even the most stable giants face uncomfortable chapters. The coffee is still hot, but the market demands a clear deal. Until then, the stock is likely to continue oscillating within its range, waiting for strategic decisions to be reflected in the price.
*******************************************************************************************
The information provided does not constitute investment research. The material has not been prepared in accordance with the legal requirements designed to promote the independence of investment research and such should be considered a marketing communication.
All information has been prepared by ActivTrades ("AT"). The information does not contain a record of AT's prices, or an offer of or solicitation for a transaction in any financial instrument. No representation or warranty is given as to the accuracy or completeness of this information.
Any material provided does not have regard to the specific investment objective and financial situation of any person who may receive it. Past performance and forecasting are not a synonym of a reliable indicator of future performance. AT provides an execution-only service. Consequently, any person acting on the information provided does so at their own risk. Political risk is unpredictable. Central bank actions can vary. Platform tools do not guarantee success.

NZD/AUD Forecast: The Climb to 0.90 Amid Diverging Rates
Current Status: The New Zealand Dollar (NZD) has stabilized against the Australian Dollar (AUD), trading at 0.8728 . After bottoming near 0.86 in November, the cross is recovering, driven by a recalibration of interest rate expectations and shifting economic currents.
Macroeconomic Analysis: The Central Bank Divergence
A primary driver of the NZD/AUD recovery is the reassessment of monetary policy trajectories. The Reserve Bank of New Zealand (RBNZ) faces persistent domestic inflation, tempering expectations for aggressive rate cuts. Conversely, the Reserve Bank of Australia (RBA) maintained its cash rate at 3.60% in December, maintaining a hawkish stance due to upside inflation risks. This narrowing policy gap, where the RBNZ is no longer significantly "out-dovin" the RBA, provides crucial support for the Kiwi dollar.
Geostrategy & Geopolitics: The China Factor
Both currencies remain sensitive to Chinese economic stability, but their exposure differs significantly. The AUD serves as a liquid proxy for Chinese industrial demand, facing volatility as Beijing recalibrates stimulus measures for 2026. In contrast, the NZD ties closely to soft commodities like dairy and meat, which see resilient demand despite broader geopolitical friction. As trade routes stabilize, lower volatility in New Zealand's export markets contributes to the currency's "safe harbor" appeal relative to the risk-sensitive Aussie.
Industry Trends: AgTech vs. Mining Tech
New Zealand’s shift toward high-margin agricultural technology (AgTech) is altering its export profile. Innovation in sustainable farming and automated dairy processing boosts productivity, offsetting headwinds from traditional commodity price fluctuations. Meanwhile, Australia’s mining sector grapples with high capital costs for green energy transitions. This structural divergence suggests New Zealand’s export economy is entering a phase of higher efficiency, supporting long-term valuation.
Economics: The Housing Market Constraints
Economic resilience is visible in the housing sector. Australian data indicates a 7.2% rise in home values since early 2025, driven by supply shortages. This "wealth effect" keeps consumption high, forcing the RBA to stay restrictive. New Zealand’s housing market shows more balanced supply-demand dynamics. This stability allows the RBNZ more flexibility, potentially reducing the risk of a policy error that could devalue the currency.
Forecast: The Path to 0.90
Current projections estimate the NZD/AUD cross will climb toward 0.90 by early 2027 . This forecast assumes a gradual normalization of the interest rate differential. The recovery will likely be non-linear; periods of Australian dollar strength are inevitable if global risk sentiment spikes. However, as the easing cycle proves shallower than feared and the RBA eventually pivots, the fundamental floor for the NZD is expected to rise.
Conclusion: The NZD/AUD is no longer trapped in a one-way bearish trend. Investors should watch the spread between Australian and New Zealand 2-year swap rates as the key indicator for the next leg higher.

XAUUSD H1 Analysis Based on Volume ProfileXAUUSD H1 Analysis Based on Volume Profile
Gold is moving sideways and consolidating around the 4,300 USD/oz area. The short-term direction remains unconfirmed and requires clear reactions at key liquidity zones.
PRIORITY SCENARIO – MAIN SCENARIO
Medium-term trend-following buy strategy at price areas with Volume Profile advantage
Primary buy zone: around 4284 based on VAL
Technical context: this is the lower value area where buying interest is likely to appear as the market continues to consolidate
Price expectation: price holds above VAL, absorbs short-term selling pressure, and gradually rotates back toward the upper balance area
Position management:
If price reacts positively and H1 candles hold above the 4284 level, a medium-term bullish bias in line with the main trend can be maintained.
If price breaks clearly below VAL, caution is required and deeper reaction zones should be monitored.
ALTERNATIVE SCENARIO – SECONDARY SCENARIO
Deeper buy opportunity in the event of additional liquidity sweep
Alternative buy zone: around 4242, based on the VAH of the previous value area
Technical context: this area represents the upper value zone of the prior consolidation and may act as strong support during a deeper pullback
Price expectation: downside liquidity sweep followed by a recovery, restoring market balance
SELL SCENARIO – HIGH RISK
Sell positions should only be considered as short-term trades, not a primary strategy
Short-term sell zone: around 4378, based on the 2.618 Fibonacci extension
Note: sells should only be considered if clear price rejection signals appear. Avoid holding short positions for extended periods while the broader trend remains bullish.
KEY REASONS
On the H1 timeframe, price is consolidating, indicating the market needs additional liquidity before confirming the next directional move
Volume Profile clearly highlights high-probability trading zones, particularly VAL at 4284 and VAH at 4242
The 4378 level represents an extended resistance zone suitable for profit-taking or short-term countertrend sells
MACRO CONTEXT AND MARKET SENTIMENT
Gold continues to hold strong near the 4,300 USD/oz level, supported by expectations of continued monetary easing from the Federal Reserve and rising safe-haven demand.
Meanwhile, silver has faced short-term profit-taking pressure after reaching record highs, reflecting a more cautious market tone.
This week’s focus is on the US Nonfarm Payrolls report. Weak data may reinforce gold’s bullish trend, while strong data could trigger a short-term correction amid ongoing policy uncertainty within the Fed.
RISK MANAGEMENT AND MONITORING
Avoid trading while price remains in the middle of the consolidation range and away from key Volume Profile levels.
The medium-term buy strategy loses its edge if price breaks clearly below 4242 and fails to reclaim the level.
Closely monitor volatility around the Nonfarm release, as sharp spikes and liquidity sweeps are highly likely.

Bank of Japan rate decisions and how I trade Bitcoin around themLook at the marked dates on the chart. Different months, same behavior. Bitcoin doesn’t wait for confirmation. It reacts to positioning.
Look at the marked dates on the chart.
March 19 2024
July 31 2024
January 24 2025
December 19 (current decision window)
When BOJ tightens or even signals tightening:-
Yen carry trades unwind
Global liquidity tightens
Risk assets get sold first, explained later
Bitcoin sits right at the front of that risk bucket.
This isn’t a prediction model.
It’s a filter.
When BOJ is on the calendar, I trade smaller, take profits faster, and trust patterns less. The market isn’t technical in those moments. It’s macro.
Most traders ask, “What pattern is this?”
I ask, “What just changed in liquidity?”
That question has saved me more times than any indicator.

AUDUSD Sell Limit | Multi-TF Rejection at Quarterly/Yearly HighsAUD/USD Short | Sell Strength at Macro Resistance:
AUD/USD is trading into a high-probability macro supply zone aligned with the Previous Quarter High / Current Year High, creating asymmetric downside risk. Fundamentals favor AUD weakness as Australian November employment contracted sharply (full-time losses), business conditions softened, and RBA policy remains ambiguous, while USD retains defensive support amid U.S. macro repricing risk and softer China growth weighing on commodity FX. Technically, H1 shows failed continuation above resistance with rejection and compression below supply, offering favorable timing to sell strength. Sell limit 0.66609, SL 0.66718, TP1 0.66346, TP2 0.66091, ~4.99R, 1% risk, no discretionary management post-entry.
Fundamental vs Technical Scorecard (Journal-Ready)
Pair: AUD/USD
Date: 15 Dec 2025
Bias: Bearish
Fundamentals (Bearish: 4 / 5)
✔ Weak Australian employment (full-time losses)
✔ Softening business conditions
✔ Ambiguous RBA policy support
✔ USD supported on macro / risk-off dynamics
✖ Inflation persistence limits aggressive AUD downside
Technical Location (Strong: 5 / 5)
✔ Previous Quarter High / Current Year High
✔ HTF supply zone
✔ Extended from value
Timing (Strong: 4.5 / 5)
✔ Failed continuation above resistance
✔ Rejection + compression on H1
✔ Sell-strength environment
Execution Quality (High: 5 / 5)
✔ Defined entry, stop, targets
✔ ~5R asymmetry
✔ Clear invalidation
Risk Management
✔ 1% portfolio risk
✔ No discretionary interference
Overall Trade Quality: High-Conviction Asymmetric Short

Micron’s AI Pivot: A 2025 Strategic & Geopolitical AnalysisThe “AI Supercycle” has finally matured from a buzzword into a tangible balance sheet reality. As of mid-December 2025, Micron Technology (MU) stands at a critical inflection point. With the Federal Reserve lowering rates to 3.75% and the semiconductor industry grappling with an unprecedented divergence between enterprise boom and consumer stagnation, Micron has aggressively repositioned itself. The upcoming fiscal Q1 2026 earnings report on December 17 represents more than a financial update; it is a referendum on CEO Sanjay Mehrotra’s high-stakes gamble on High Bandwidth Memory (HBM).
Business Model Transformation: The Enterprise Pivot
Micron is executing one of the most radical structural pivots in its history. The decision to deprioritize, and in some regions effectively sunset, its consumer-facing Crucial brand by early 2026 signals a ruthless allocation of capital. Management has correctly identified that the consumer PC market is a low-margin drag. Instead, production capacity is being violently swung toward enterprise-grade DRAM and AI-centric storage. This moves Micron from a commodity volume player to a specialized, high-margin infrastructure partner for hyperscalers like Microsoft and AWS.
Technology & Innovation: The HBM Wars
Technological supremacy is now defined by the roadmap to HBM4. While SK Hynix initially led the HBM race, Micron’s aggressive rollout of HBM3E has closed the gap. The company’s 1-beta and upcoming 1-gamma nodes utilize extreme ultraviolet (EUV) lithography to deliver power efficiency metrics that rival Asian competitors. Patent analysis reveals a surge in filings related to 3D-stacking architecture and advanced packaging, confirming that Micron is building a defensive IP moat around its high-performance compute capabilities.
Geostrategy & Geopolitics: Navigating the Fracture
Micron operates on the fault line of the US-China chip war. The lingering effects of Beijing’s 2023 ban on Micron products have accelerated the company’s "China-Plus-One" strategy. In response, Micron has doubled down on domestic manufacturing, leveraging the US CHIPS Act to fund mega-fabs in New York and Idaho. This is not just expansion; it is geopolitical insurance. By embedding itself into the US national security apparatus, Micron mitigates the risk of losing Chinese market share while securing subsidized capital that lowers its long-term cost of production.
Macroeconomics: The Rate Cut Tailwind
The Federal Reserve’s cut to 3.75% this November provides a specific, quantifiable benefit to Micron. Semiconductor manufacturing is arguably the most capital-intensive industry on earth. Lower borrowing costs directly improve the Net Present Value (NPV) of Micron’s multi-billion dollar fab projects. Furthermore, a softer dollar environment boosts the competitiveness of US exports, providing a tailwind for Micron’s international revenue recognition in fiscal 2026.
Cybersecurity & Supply Chain Integrity
In an era of state-sponsored cyber espionage, hardware security is a premium feature. Micron has elevated its cybersecurity posture by securing ISO/SAE 21434 certification for automotive memory, a critical requirement for modern SDVs (Software-Defined Vehicles). This focus extends to the supply chain; rigorous "Zero Trust" protocols now govern raw material sourcing, addressing the vulnerabilities exposed by recent global logistics disruptions. This security-first branding allows Micron to charge a premium to defense and automotive clients who cannot afford compromised hardware.
Management & Leadership
Sanjay Mehrotra’s tenure has been defined by discipline. Unlike previous cycles where memory makers flooded the market, causing price crashes, current leadership has shown remarkable restraint in CapEx spending. The 2025 strategy focuses on "bit growth discipline"—matching supply strictly to demand. This oligopolistic behavior, shared tacitly by competitors, has successfully engineered a favorable pricing environment, driving gross margins back toward the 40%+ range.
Conclusion: The Verdict
Micron Technology in late 2025 is no longer just a cyclical memory stock; it is a derivative play on the AI infrastructure build-out. The risks—ranging from HBM yield issues to renewed geopolitical friction—are real. However, the company’s strategic withdrawal from low-margin consumer markets and successful capture of CHIPS Act incentives position it favorably. As investors look to December 17, the question is not if AI demand exists, but if Micron can manufacture fast enough to satisfy it.

EURUSD rallyThe final active trading week of the year is beginning.
There are still several important news releases ahead that could trigger stronger market moves.
We expect EURUSD to maintain its bullish momentum and move toward 1,1800.
Pullbacks and additional volatility are entirely possible, so proper risk management is essential.

ETH: Price Slice. Capital Sector. 3033.73🏷 ETH: Price Slice. Capital Sector. Dated: 12.12.2025
🏷 3033.73 — Price not yet reached at time of publication
🏷 BPC — The Bolzen Price Covenant 7
🏷 Screenshot
🏷 Interactive Reference Guide: BPC — The Bolzen Price Covenant
🏷 P.S. English is not my native language — I offer no apologies for stylistic imperfections. What you see here is not a post. It is a demonstration of another level of preparation: the symbiosis of human intuition and algorithmic precision. Mathematics and aggressive market analysis — against the machine of liquidations.
The Architect
BPC — The Bolzen Price Covenant

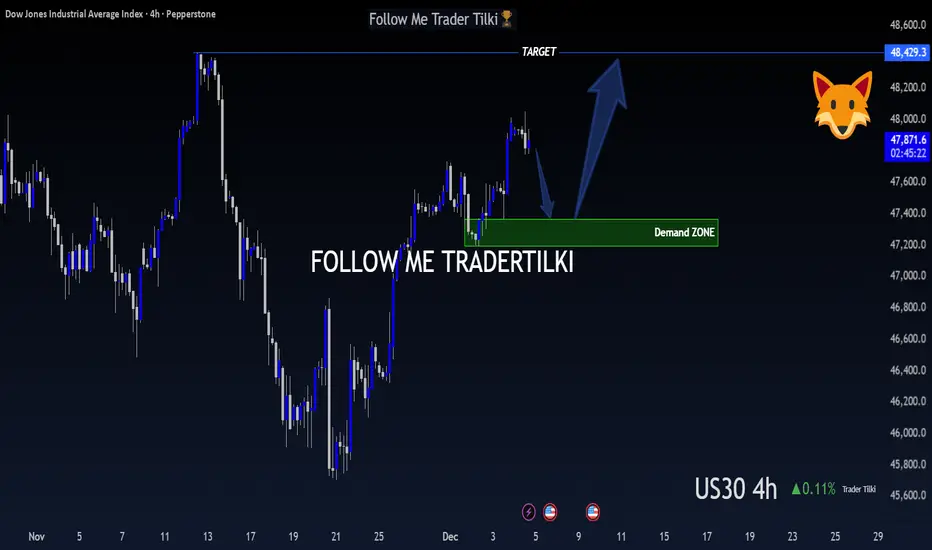
US30 (DOW JONES) – 4-Hour Timeframe Tradertilki AnalysisMy friends,
I have analyzed US30 on the 4-hour timeframe.
My friends, if US30 reaches the levels between 47,361 and 47,192, I will open a buy position.
My target will be the 48,429 level.
My friends, I share these analyses thanks to each like I receive from you.
Your likes increase my motivation and encourage me to support you in this way.🙏
Thank you to all my friends who support me with their likes.❤️
Bullish Analysis – XAU/USD (15M)📈 Two-target setup with active risk management
This setup is based on a clear institutional liquidity and market structure narrative.
1️⃣ Manipulation and fake out
Price creates a fake out at a key level, trapping late sellers. This manipulation provides the liquidity needed for the bullish move.
2️⃣ Strong impulse + FVG (15M)
After the fake out, price delivers a strong impulsive move, leaving a 15-minute Fair Value Gap, confirming institutional intent.
3️⃣ Entry at POI (4,329)
Price retraces into the Point of Interest, located at a discount and support zone.
The entry is planned and patient, not chased.
4️⃣ Risk management
• SL: 4,309
• Initial R:R: 1:2.5
Defined risk with a structured execution plan.
5️⃣ Targets
• 🎯 TP1: 4,350
→ Once reached, stop loss is moved to breakeven, securing the position.
• 🎯 TP2: 4,380
→ Target aligned with buy-side liquidity and an unmitigated higher high.
📌 Strategy focused on locking partial profits while allowing the trade to run toward its higher-timeframe objective. GOOD LUCK TRADERS…

BTCUSD Weekly Thoughts: Macro Factors in FocusBTCUSD Weekly Market Outlook
BTCUSD ended last week with a bearish close, reflecting short-term hesitation in price action. However, the 89,611 zone continues to act as an important point of control, suggesting ongoing market participation around this level.
From a broader perspective, recent geopolitical developments related to Ukraine have increased demand for alternative and safe-haven assets. At the same time, a weakening U.S. dollar has provided underlying support to BTCUSD, helping to stabilize price despite last week’s bearish close.
Looking ahead, several U.S. economic reports are scheduled for release this week. These data points may further influence USD strength and overall market sentiment. If dollar weakness persists, it could continue to shape a more constructive environment for BTCUSD.

Breakout Retest: FVG Target in Sight With Strong Bias Toward AThe current 4H structure on XAUUSD shows a decisive breakout from the ascending channel, followed by a clean impulsive leg that created a fresh FVG zone above 4300. Price is now pulling back into the exact region where the breakout originated, aligning both structural support and liquidity dynamics.
Several key elements reinforce a bullish continuation bias:
1. Breakout–Retest Mechanics
The ascending channel break was driven by strong momentum, clearing previous December highs and leaving behind an inefficiency (FVG 12/12/25). Price is now retracing to the origin of that breakout. This is a textbook area for continuation entries, especially when the pullback respects the channel ceiling now acting as support.
2. Liquidity Alignment
Price is sitting just above the December previous high around 4265, which now acts as a liquidity shelf. The current wick reaction shows buyers showing interest at this level. As long as candle bodies hold above this area, bullish intent remains dominant.
3. Higher-Timeframe Context
Globally, gold remains bid due to continued dollar softness, geopolitical uncertainty, and expectations of a more accommodative Fed into early 2026. This macro backdrop supports dips being bought rather than sustained downside extension.
4. FVG Targeting
The imbalance above aligns closely with the 4320 mid-level. Markets routinely revisit the midpoint of fresh inefficiencies after the first corrective leg. This supports Plan A’s idea of a bullish continuation into the FVG.
Plan A (Primary Bias)
Bullish continuation toward FVG 4320–4350
• Expect price to hold above the channel retest zone and December previous high (≈4279).
• A reactionary higher low in this region sets up the next leg upward.
• Target the FVG fill at 4320 first, then potential extension toward 4350 if momentum returns.
• Invalidation of Plan A sits below 4255; a clean breakdown there shifts probability to Plan B.
This plan is more consistent with the current market structure and the nature of the breakout. Momentum, liquidity engineering, and macro drivers all align with a continuation play rather than a deep retracement.
Plan B (Secondary Scenario)
Deeper retracement toward 4239 support
If price rejects strongly from the current zone and loses the December previous high (4279), a liquidity sweep toward 4239 becomes likely. This would complete a deeper mitigation of the previous range but is less probable as long as the current breakout retest holds.

Weekly BTCUSD Analysis: Bullish Momentum Builds Toward $96,000.Analysis:
Bitcoin (BTCUSD) closed last week with strong bullish momentum, confirming buyers’ control as price continues to respect higher-timeframe demand zones. The broader market environment remains supportive, with a declining US Dollar and rising geopolitical tensions increasing demand for alternative and safe-haven assets such as Bitcoin.
🔑 Key Weekly Levels
Primary Support: 87,595
Strong Support (Major Demand Zone): 83,780
Immediate Resistance: 90,660
Next Resistance: 94,662
Bullish Target: 96,000
📈 Technical Analysis
From a technical perspective, BTCUSD maintains a bullish market structure, printing higher lows on the weekly timeframe. Price continues to trade above key moving averages, indicating sustained upside momentum.
Support validation: The zone around 87,595 has acted as a reliable demand area, where buyers repeatedly step in.
Trend strength: Momentum indicators suggest bullish continuation, with pullbacks being shallow and corrective in nature.
Breakout potential: A confirmed weekly close above 90,660 would strengthen bullish conviction and expose price toward 94,662, followed by the psychological 96,000 level.
The 83,780 region remains a strong long-term support and represents a high-probability accumulation zone should deeper retracements occur.
🌍 Fundamental Context
The ongoing weakness in the US Dollar combined with elevated geopolitical risks continues to support Bitcoin’s narrative as a hedge and alternative store of value, reinforcing the bullish technical outlook.
🔮 Outlook
As long as BTCUSD holds above 87,595, the bullish bias remains intact. A breakout above resistance could trigger the next impulsive leg higher toward 96,000 in the coming weeks
Regards: Chart Analyst Pro.
#BTCUSD #Bitcoin #WeeklyAnalysis #CryptoMarket #BTCBullish #TechnicalAnalysis

Tokenization Push by US Government Will Unleash a Demand ShockCME: Micro Bitcoin Futures ( CME:MBT1! ) and Micro Ether Futures ( CME:MET1! )
On December 8th, U.S. Commodity Futures Trading Commission (CFTC) announced the launch of a digital assets pilot program for certain digital assets, including BTC, ETH, and USDC, to be used as collateral in derivatives markets.
This announcement marks a significant milestone in expanding the adoption of digital assets in regulated markets with appropriate guardrails. In my opinion, the flood gate has just opened. It will let in organic growth of crypto demand in hundreds of billions of dollars.
Collateral Assets in Derivatives Markets
Unlike the fully-funded cash market trades, futures and options contracts are transacted using performance margins. This important feature allows investors to get large exposure (in contract notional value terms) with a smaller upfront deposit (initial margin). The built-in leverage improves capital efficiency and could help enhance returns.
Futures and options positions are marked-to-market on a daily basis. If a contract is not settled by the end of the day, the traders on both the long side and the short side of a trade are required to keep their margin account balance above the threshold set by the clearinghouse (maintenance margin). The Exchange’s clearinghouse manages client collateral assets. If the open interest is huge, this could amount to billions of dollars.
Take CME Group, the largest Derivatives Exchange holding company, as an example:
• Total combined Open Interest is 234,389,524 contracts on December 12, 2025, according the CME Group website.
• CME Group had performance bond assets at $149.0 billion on September 30, 2025, according to data released by CME Group in its 10Q report, October 24, 2025.
CME Clearing takes the following types of assets as acceptable collateral:
• US dollar
• Foreign currencies: subject to haircuts and caps
• US treasuries: bills, notes, and bonds, as well as TIPS
• Gold: COMEX gold warrants and London gold bullion
• Agency: selected U.S. government agencies and mortgage-backed securities
• Stocks and ETFs: blue-chip stocks, subject to a 25-30% haircut
• Corporate bonds: high rated bonds, subject to haircuts and caps
CME Clearing does not currently accept cryptocurrencies as collateral. With the CFTC-backed pilot program, BTC, ETH and USDC could likely be added to the menu.
In my November 3rd market commentary, “Bitcoin: from Pet Rock to Loan Collateral”, I discussed the significance of JPMorgan accepting crypto ETFs as stock lending collateral.
JPMorgan, being the largest US bank, could influence other banks with its action. The CFTC pilot program takes the matter to the next level. US regulators are issuing policies pushing for crypto adoption.
Trump Administration Pro-Crypto Policies
Since returning to the White House in January, the Trump Administration have brought about a series of pro-Crypto policies. These include President’s executive orders, laws passed by Congress, as well as new rules enacted by various federal agencies.
• Executive Orders: Trump signed executive orders to establish a presidential working group to propose a new federal regulatory framework and created the Strategic Bitcoin Reserve and a U.S. Digital Asset Stockpile.
• The GENIUS Act: This act, signed into law in July 2025, provides a regulatory framework for payment stablecoins, requiring 1:1 reserves and compliance with AML rules, and clarifies they are not securities or commodities.
• Securities and Exchange Commission (SEC): The SEC issued SAB 122 to facilitate crypto custody services by banks. It established a "Crypto Task Force" and issued statements clarifying that certain stablecoins are not securities.
• Department of Justice (DOJ): The DOJ now prioritizes cases involving clear financial harm and disbanded the National Cryptocurrency Enforcement Unit.
• Banking Regulators: FDIC and Federal Reserve rolled back previous guidance, allowing banks to engage in crypto-asset services without prior non-objection letters.
• IRS: The IRS is focusing on accurate record-keeping and disclosure for the 2025 tax year, while eliminating certain DeFi reporting rules.
• Department of Labor (DOL): In August 2025, DOL issued guidance to clear the way for 401K plan sponsors to offer digital assets as an investment option.
• Future Legislation: Bills under consideration include the CLARITY Act to define most digital assets as commodities and the Anti-CBDC Surveillance State Act to codify the ban on a U.S. CBDC.
Industry adoption may start slowly, but once core financial assets are tokenized, we will see huge crypto demand, specifically for Bitcoin and Ethereum.
• Strategic Bitcoin Reserve could grow to a trillion-dollar sovereignty fund.
• The $9 trillion U.S. 401K market: Even if only 5% of the retirement asset is held in cryptos, the new demand will be half a trillion dollars.
• If 10% of CME collateral assets gets tokenized, it will be $15 billion in BTC, ETH and USDC. Once other Exchanges and the OTC derivatives market follow suit, new crypto demand could grow to $100 billion.
Riding the ride with Micro Bitcoin and ETH Futures
Bitcoin has declined 30% in the last two months, while ETH suffered a 40% loss. Such pullbacks are common throughout the history of cryptocurrencies. If we take the long view, the crypto “gold” and “silver” could rise again on the back of new organic demand.
Traders who share the bullish view on Bitcoins and Ethereum could explore CME Micro Bitcoin Futures ( PSE:MBT ) and Micro ETH Futures ( NYSE:MET ).
The MBT contract has a notional value of 0.10 bitcoin, as defined by the CME CF Bitcoin Reference Rate (BRR). On December 12th, the January 2026 contract (MBTF6) is settled at $90,960. Each contract has a notional value of $9,096. To buy or sell one contract, CME Group requires an initial margin of $2,184. By design, this futures contract has a built-in leverage of 4.2-to-1. When bitcoin goes up, futures positions could enhance the return by four times compared to spot bitcoin positions.
MET has a notional value of 0.10 ETH. On December 12th, the January contract (METF6) is settled at $3,104, putting the contract value at $310.4. The initial margin is $100, implying a built-in leverage of 3.1-to-1. When Ethereum goes up, futures positions could enhance the return by three times compared to spot ETH positions.
What happens if Bitcoin or Ethereum drops? For price protection, traders could enter a buy order with a stoploss. For example:
• A long MBTF6 order at 91,000 with a stoploss of 85,000 limits the maximum loss to $600 (= (91000-85000) x 0.1).
• A long METF6 order at 3,100 with a stoploss of 2,800 limits the maximum loss to $30 (= (3100-2800) x 0.1).
In addition to margin (leverage) and stoploss (loss protection), both Micro Bitcoin and Micro ETH have a daily price limit at 10%. This feature is particularly helpful when the market is panicky. Price Limit or Circuit slows down the irrational price movements until cooler heads prevail.
Happy Trading.
Disclaimers
*Trade ideas cited above are for illustration only, as an integral part of a case study to demonstrate the fundamental concepts in risk management under the market scenarios being discussed. They shall not be construed as investment recommendations or advice. Nor are they used to promote any specific products, or services.
CME Real-time Market Data help identify trading set-ups and express my market views. If you have futures in your trading portfolio, you can check out on CME Group data plans available that suit your trading needs www.tradingview.com

Callback complete. A long position can be considered at 4300.Gold is currently facing upward pressure at 4355 on the 4-hour chart, and has started to fall back after touching the previous resistance level. It has now fallen back to the support zone around 4310.
On the 1-hour chart, the price has broken below the short-term high-level narrow trading range. Short-term moving averages remain somewhat weak, suggesting a potential short-term correction. A technical correction under the pressure above is inevitable.
This week's strategy is to follow the upward trend and go long. If a sharp drop occurs, Quaid suggests waiting for the release of relevant data before implementing specific strategies.
The current strategy is to capitalize on the bullish rebound, waiting for the correction to complete before engaging in short-term long positions.
Trading strategy: Buy gold at 4300-4310, add to position at 4290, stop loss at 4285, take profit at the first resistance level of 4355, and after breaking through, watch the historical high around 4380. More trading information will be updated in the channel.

Gold (XAU/USD) Price Outlook 📊 Technical Structure
OANDA:XAUUSD Gold surged toward $4,350, reaching a fresh seven-week high before encountering strong rejection within the $4,342–$4,351 resistance zone. Multiple wicks at the top suggest fading bullish momentum, with price now showing signs of forming a lower high beneath the resistance band.
As long as XAU/USD remains capped below $4,356, the short-term structure favours a pullback. A corrective leg toward the $4,271–$4,263 support zone is likely if sellers defend the resistance on repeated retests. Only a clean break above $4,356 would invalidate the bearish setup and open the door for a continuation higher.
🎯 Trade Setup (Bearish Bias)
Entry Zone: 4,342 – 4,351
Stop Loss: 4,356
Take Profit 1: 4,271
Take Profit 2: 4,263
Estimated R:R: ~1 : 4.81
Bearish scenario remains valid as long as price stays below 4,356 on the 1-hour close.
🌐 Macro Background (Simplified)
Gold continues to benefit from expectations that the Federal Reserve will begin cutting rates in 2026, lowering the opportunity cost of holding non-yielding assets like gold. Recent geopolitical tensions and risk-off flows have added to the upside.
However, hawkish comments by multiple Fed officials last week temporarily supported the USD, creating short-term headwinds for gold at higher levels. Markets now await crucial US labour data (covering Oct–Nov NFP, wages, unemployment) on Tuesday, which may shift expectations for the Fed’s January meeting and likely trigger volatility.
Overall, fundamentals remain medium-term bullish, but price is technically extended near resistance—supporting the idea of a short-term correction.
🔑 Key Technical Levels
Resistance Zone: 4,341 – 4,351
Support Zone: 4,271 – 4,263
Invalidation (Bearish): Break above 4,356
📌 Trade Summary
Gold reached a multi-week high before encountering strong selling pressure at major resistance. As long as price remains below 4,356, a retracement toward 4,271 → 4,263 is favoured. A sustained breakout above resistance would reverse the bearish bias and signal continuation toward new highs.
⚠️ Disclaimer
This analysis is for reference only and does not constitute trading advice. Trading involves significant risk, and proper risk management is essential.

XAUUSD H1 – POC 4295 & Fibonacci Sell 4373XAUUSD H1 – POC 4295 & Fibonacci Sell 4373
Strategy Summary
Today, I am not chasing price. The XAUUSD trading plan revolves around two of the cleanest zones on the chart:
POC (Volume Profile) around 4295 to look for BUYs in line with the main money flow.
Fibonacci level at 4373 to look for SELLs when price reaches the premium zone.
Key Levels
BUY zone (POC – Volume Profile): 4295 (major liquidity area)
SELL zone (Fibonacci reaction): 4373
Deeper buffer if POC breaks: 4238 – 4241
Invalidation level: 4191
Scenario 1 – Primary Plan: BUY at the Liquidity Zone (POC)
✅ Buy limit around 4295 (preferably wait for H1 candle confirmation)
SL: 4287 (below the POC zone to avoid noise)
TP1: 4330 – 4338
TP2: 4370 – 4373 (approaching the Fibonacci sell zone)
Logic:
The POC represents the “fair value” or balance point of the Volume Profile. Price is often drawn back to this level to collect liquidity before committing to the next directional move.
Scenario 2 – SELL on Reaction at Fibonacci (Premium Zone)
✅ Sell around 4373 (wait for a reaction or loss of momentum; do not chase the trade)
SL: 4382
TP1: 4338 – 4330
TP2: 4295 (return to the POC)
Logic:
The Fibonacci premium zone is commonly where profit-taking pressure emerges. If price spikes into 4373 but fails to hold, it often provides a textbook reaction sell setup.
Alternative Scenario – If the POC Is Broken
If price breaks below 4295 and clearly closes an H1 candle beneath this level, I will not force buy positions. Priority then shifts to waiting for price to react at:
4238 – 4241, or
deeper towards the lower balance / POC zone.
Always keep in mind that 4191 is the invalidation level.
News Context (to Avoid Being Stopped Out)
Trump has expressed concerns that economic impacts have “not fully filtered through yet”, increasing political risk and market sensitivity.
Comments from Williams (FOMC, New York Fed) on the economic outlook may trigger short-term volatility in USD and yields, leading to sharp moves in gold.
Tip: Avoid late entries during news-driven spikes. Only execute trades when price reaches the predefined zones.
Risk Management
Maximum risk per trade: 1–2%
Do not trade in the middle of the range. Trade only at key levels.
If you are also monitoring 4295 and 4373, share your view:
👉 Are you leaning towards a BUY on pullback or a SELL on reaction today?
