BTC Capital Sector. Price Slice 15.11.2025 TF 3M90446.9 — At the time of publication, the price had not yet been reached. ( на момент публикации цена не достигнута )
80868.9 — At the time of publication, the price had not yet been reached. ( на момент публикации цена не достигнута )
71689.5 — At the time of publication, the price had not yet been reached. ( на момент публикации цена не достигнута )
43709.6 — At the time of publication, the price had not yet been reached. ( на момент публикации цена не достигнута )
🏷 At the request of close colleagues, friends, and supporters of my work, I am publishing this analytical material in English—for the international institutional community and conscious retail market participants.
🏷 This slice reflects the logic of institutional capital movement. It is critical to understand: price is formed only when sufficient liquidity from the retail sector and sustained crowd interest are present. Without this condition, institutional interest remains potential, but unrealized.
🏷 Meanwhile, institutional capital operates on entirely different temporal and structural charts than those visible on the screens of most traders.
🏷 Therefore, a superficial view of price is doomed to distortion.
🏷 Methodology: Pre-Factum
🏷 My analytical markings are built on the principle of Pre-Factum—anticipating the fact before it manifests. This is not forecasting in the traditional sense, but identifying capital intent prior to its physical manifestation on the chart.
🏷 The central element of this method is identifying a price sector as an intention—where the instrument is striving to go—regardless of its current price action: no emotions, only cold calculation. Every price has its own timeframe.
🏷 There are three ways to interact with unfulfilled price levels:
🏷 1. Trade from the level—enter upon confirmed structural validation.
🏷 2. Wait for fulfillment—observe price movement toward the level without entering, focusing on instrument behavior.
🏷 3. Trade in the direction of the level—utilizing support/resistance levels with strict risk control.
🏷 If you choose the third path, deep understanding of market mechanics becomes mandatory. Without experience, conscious perception of liquidity behavior, and prior study of relevant materials, entering such positions is premature.
🏷 This applies equally to retail newcomers and professionals whose attention remains scattered by short-term timeframe noise.
🏷 Relevance of Markings
🏷 The levels presented here are current, fresh institutional capital markings. They do not invalidate previously identified unfulfilled prices but complement them within the context of evolving liquidity and shifting market logic.
🏷 A flag placed prior to price touch—with the publication date (level, sector—whichever you prefer)—indicates that the instrument, with high probability and regardless of current price movement, intends to execute a move toward that price.
🏷 Two examples:
🏷 Example #1 — BTC:
On the screenshot from September 26, 2025, I marked the price of 106,110 with a blue flag (color is my personal labeling). Screenshot:
The instrument subsequently deviated from this level by 15%, creating pressure: on October 10, 2025, price declined sharply, collecting all long positions.
Instrument slide:
🏷 Example #2 — ETH:
On October 12, I marked the price of 3,291.60 with a yellow flag:
On November 4, the instrument reached the marked price:
🏷 I have directed your attention to specific prices—and there are many such examples in my feed. If you study my materials, you will see: this is a new methodology, currently not demonstrated by anyone else in the world. The precise slice and price sector I have developed reveal the true mechanics of the market.
🏷 Once price reaches a flagged zone, the marking loses its original function. It must be updated to reflect the new logic of capital movement—otherwise, it becomes a misleading reference or a conventional technical analysis level.
🏷 These markings are not static. They are dynamic markers of intent, requiring constant reassessment. It is precisely these that we uncover through the method of capital anticipation.
🏷 Temporal Context
🏷 I emphasize separately: the flag carries not only a price function, but also a temporal one. The publication date is the fixed point of my observation and identification. It serves as my anchor: where and when I captured institutional intent.
🏷 My entire architecture of price sectors is systematically organized into chronological folders. I have already demonstrated this structure in one of my videos—for those who seek to think structurally, not reactively. Use translators as needed to study my demonstration.
🏷 This is not a forecast. It is a map of intent.
🏷 Read it with respect for liquidity, time, and capital intelligence.
🏷 English is not my native language. With international exposure, time will come—I will provide new reference points as needed, without compromising institutional interests or the balance of many market participants. I do not disclose the entire price sector or the skill of seeing any instrument within its price sector for security reasons. You must determine for yourself how to engage with institutional analysis.
🏷 There are traders, and there are analysts—two distinct classes. The mindset between institutional analysis and trading is fundamentally different.
🏷 As you see, I do not use indicators. This is mathematics, logic, and an intellectual system I created—my proprietary property. I have come only to help you see a different structure.
🏷 The battle of titans is a clash of attention and timing.
🏷 The question is not who is right—but who has the resources and patience to unload positions.
🏷 Who leads whom? The one who sees further and holds institutional leverage.
🏷 You have received a map. Most see an image; few read the message. The difference is not IQ, but the habit of looking toward the future—not at indicator noise.
🏷 Institutional capital meticulously crafts candles, as if scripting the narrative to suit its preferred triggers. I, operating from the shadows, read the plan: where entry points will be set, where liquidations will be scheduled, who will hold positions until the bell.
🏷 I offer possibilities, not commands. But let us acknowledge: a hint is an art—and it transforms curiosity into dependency. Do you remember the echo of these words?
🏷 I have shown you another side of analysis—I have designed what you have been waiting for, and what you have grown weary of. This is new technical analysis: to understand how to control the capital sector—study the materials. The secrets are mine. I give you part of this understanding to help you.
🏷 Not tricks, not guesses—but architecture.
🏷 Let it sound mystical—it must. A map in the hands of one who can read between the candles always appears as prophecy to those accustomed to indicator noise.
— The Architect
Fundamental Analysis

This is my personal analysis of 3 variationsHello everyone, this is my first time publishing.
I’ve been a trader for a decade and my purpose here is to help new traders to see the market differently.
Here are three routes for a price to act at certain levels of demand and supply,
On the graph lines guiding you to see where price gonna be if certain changes may apply
as explained in the notes.
It’s a not an advise! Only perspective for new traders.
God bless you all

Lucky FOREX Analysis (November 17th-21st 2025)In this week i talked bout EUR/USD AUD/NZD BTC AUD/USD S&P500 AMZN MSFT
Welcome to our weekly market breakdown — get ready for actionable forex insights to guide you through the week ahead. In this episode we cover:
🔍 Major currency pairs and key support/resistance levels
🧲 Trend analysis: where the momentum is shifting and what may be driving it
📆 Economic events to watch (interest rate decisions, inflation releases, central-bank commentary)
🛠️ Trade setups: potential entries, stop-loss zones & profit targets
🎯 Risk management tips: how to approach the week with discipline
Whether you’re a day trader, swing trader or simply keen to stay ahead of the curve, you’ll find value in this edition.
🔔 Remember:
Markets move fast. Use this analysis as one part of your trading decision process—not the whole. Always perform your own due diligence and manage your risk carefully.


Bearish at HTF!This is my bearish idea for BTC at the moment! If money gets distributed again by stimulus checks in the US economy; this is null & void.

XRPUSDT → False breakout of resistance in a weak marketBINANCE:XRPUSDT faces strong resistance and forms a false breakout amid a weak market. Bearish pressure remains high...
Bitcoin failed to break through the 106K resistance and returned to the short zone, with the cryptocurrency market, including XRP, reacting with a decline... Overall, the market is in a weak phase and is not yet ready to move into strong growth. Consolidation may continue...
False breakout of resistance at 2.5530 amid a weak market. The market has no potential for continued growth, and a reversal pattern is forming, provoking a sell-off...
Resistance levels: 2.496 - 2.553
Support levels: 2.376, 2.24
A retest of the local base at 2.5 is possible before the decline continues. As part of the current movement, the market may test 2.37, but if the bulls fail to hold this zone, the coin may drop to 2.24.
Best regards, R. Linda!

Emotional Control 101 **Emotional Control 101:
Hello Traders 🐺
How to Stop Fear, Greed, and Impulse from Destroying Your Trades**
Welcome back to another post.
In this article, we will dive deep into one of the most overlooked yet defining skills in trading: Emotional Control.
This is not just a topic — it is the psychological foundation that decides whether you rise as a trader or fall like the rest.
Let’s break it down step-by-step.
1) What is Emotional Control in Trading?
Emotional Control is the ability to stay balanced, objective, and disciplined regardless of what the market is doing.
It is the skill of thinking clearly when everything inside you wants to react impulsively.
Every trader brings emotions into the chart:
fear, greed, impatience, overconfidence, revenge, hope.
These emotions influence your decision-making process more than any indicator or strategy ever could.
Your emotional state determines:
when you enter,
when you exit,
how you manage losses,
how you react to wins,
and how consistent you can remain during uncertainty.
A controlled mind protects you.
An uncontrolled mind destroys you.
Both are fully in your hands.
2) The Hidden Enemies: Fear, Greed, Impulse
Let’s break down the 3 psychological forces that ruin most traders:
Fear
Fear makes you exit early, skip valid setups, hesitate, doubt your edge, and anticipate danger even when your analysis is correct.
Greed
Greed makes you chase price, hold too long, ignore your plan, and believe that every pump will continue forever.
Impulse
Impulse is the silent killer.
It pushes you into trades without confirmation, without analysis, without structure — simply because your brain demands a dopamine hit.
These emotional forces show up fast, and if you do not control them, they will take over.
3) Why Emotional Control Matters More Than Strategy
You can have the best strategy in the world, but if you cannot control your reactions?
You will fail.
Without emotional structure, trading becomes gambling.
You become reactive, not strategic.
You chase, you force, you hope — instead of plan, execute, and review.
A trader with average strategy but strong emotional control will always outperform a trader with a perfect system but no discipline.
Emotional mastery is the filter that protects your capital and aligns you with high-quality setups ONLY.
4) How to Build Emotional Control (Step by Step)
Just because it is difficult does not mean it is impossible.
Here is the practical framework:
Step 1 — Build Discipline Through Consistency
Create a clear trading plan.
Define your edge.
Commit to following it whether the market is pumping, dumping, or consolidating.
Consistency creates internal strength.
Strength creates emotional stability.
Step 2 — Develop Emotional Awareness
Become conscious of how you react during trades.
Ask yourself:
When do I feel fear?
When do I feel FOMO?
When do I feel reckless confidence?
Which emotions pull me away from my edge?
Awareness is the first step to control.
Step 3 — Journal Everything
You cannot control what you cannot see.
Log:
every loss,
every win,
every emotional trigger,
every setup you forced,
and every setup you skipped.
Be brutally honest.
Your journal is your mirror, not your trophy case.
Patterns will appear.
Identify them.
Correct them.
Step 4 — Build Trust in Your System
You must trust two things:
your strategy,
yourself.
Backtest.
Forward test.
Refine your criteria.
The more proof you collect, the less emotions will dominate your decisions.
Confidence must come from data, not hope.
Step 5 — Master Patience
The most important psychological skill.
Only take A++ setups.
The ones with multiple confluences lining up — not the setups that “feel right,” but the ones that are right.
Patience protects you from impulsive trades.
Patience separates traders from gamblers.
5) How Your Daily Life Affects Your Emotional Control in Trading
Your psychology outside the chart becomes your psychology inside the chart.
If your life is chaotic, emotional, stressed, or unstable —
your trading will mirror it.
A breakup, an argument, a bad day at work, fatigue, stress…
All of these push the mind to seek dopamine.
And where does it run for that dopamine?
The charts.
But emotional trading is destructive.
It leads to revenge trades, overleveraging, forcing setups, and chasing losses.
If you cannot regulate your emotions in daily life,
you cannot expect to regulate them in a high-stress environment like the market.
Control your life → control your trades.
KEY POINTS
1) What is Emotional Control:
Your ability to remain balanced under pressure. Master the mind → master the trade.
2) Hidden Enemies:
Fear, greed, and impulse destroy discipline and clarity.
3) Why It Matters:
Without emotional control, trading becomes gambling. With it, you gain structure, patience, and objectivity.
4) How to Build It:
Consistency, emotional awareness, journaling, trust in your system, and patience.
5) Daily Life Impact:
Your external emotions directly influence your performance in the market.
Strengthen your mind outside → strengthen your mindset inside.
Thank you all for reading —
I hope this post brings clarity and value to your trading journey.
Emotional control is only one of the 3 psychological pillars that lead to trading success.
If you would like a deep dive into the remaining two keys, let me know —
I’d be glad to share more with the community.

Walt Disney Signs Multi-Year Deal With YouTube - Where Next?The Walt Disney Company has announced a major multi-year distribution agreement with YouTube TV, expanding access to Disney’s broad entertainment, sports, and news portfolio. The deal restores all Disney-owned networks—including ESPN, ABC, FX, Freeform, Disney Channel, and National Geographic—to YouTube TV subscribers, resolving a blackout that briefly affected viewers earlier in the week.
A central highlight of the agreement is the inclusion of ESPN’s new direct-to-consumer service, ESPN Unlimited, at no extra cost for YouTube TV customers. Subscribers will also gain access to a selection of its live and on-demand content directly within the YouTube TV interface. The two companies also plan to integrate Disney+, Hulu, and genre-specific network bundles into select YouTube offerings, giving users more flexibility in how they access Disney content.
Disney’s leadership emphasized that this deal reflects the company’s strategy to evolve alongside shifting viewing habits as streaming and hybrid distribution become the core of modern media consumption. The restored networks arrive just in time for major live sports programming, particularly college football, which historically drives high viewership and subscription engagement.
Technical Outlook
From a technical perspective, Disney’s stock has been in a prolonged range since August 2022, trading between a low of $78 and resistance at $120 following its steep decline from the $203 peak in March 2021. In June 2025, price was rejected at the $120 zone once again, reinforcing it as a strong resistance level. The stock is now sliding back toward the $78 support region.
For traders, the key setup remains a breakout. A move above $120 could open the door for momentum-driven buying and a potential recovery back toward historical highs. Conversely, a breakdown below $78 would signal renewed weakness. This new YouTube partnership, however, could provide the fundamental catalyst needed to push price out of its multi-year consolidation.

Google ( $GOOG) Faces €573M Fine but Trend Remains BullishGoogle (GOOG) has been hit with a major legal setback after a Berlin court ordered the company to pay €573 million ($666 million) in damages to two German price-comparison platforms. The case stems from long-running antitrust disputes tied to Google’s alleged practice of favoring its own shopping service over competitors—an issue the European Commission initially penalized in 2017 with a €2.4 billion fine.
The court awarded Idealo €374 million plus €91 million in interest, while Producto GmbH will receive €89.7 million plus €17.7 million in interest. Both companies argued that Google’s search dominance limited their visibility, costing them years of lost revenue. Although pleased that much of the €3.3 billion originally sought by Idealo was dismissed, Google maintains that it disagrees with the ruling and will appeal. The company insists the 2017 remedy addressed the concerns and that the EU’s monitoring supported that view.
However, the Berlin judges concluded that Google’s changes were not sufficient to eliminate the competitive harm—even after 2017. This marks the first time a national European court has explicitly stated that Google’s remedy failed to end the abuse, potentially opening the door for billions more in follow-on claims across Europe. Plaintiffs may push for larger settlements, making this an evolving legal headwind for Alphabet.
Technical Outlook
Despite the legal news, GOOG’s chart remains structurally bullish. The stock has been in a steady uptrend, supported by consistent higher lows and strong demand across tech. Recently, price broke above a key trendline, signaling renewed upside momentum.
GOOG did experience a pullback on Friday as headlines hit, but the broader direction remains intact. As long as the stock holds above its breakout zone and the trendline, bullish continuation remains the dominant bias with buyers stepping in on dips.

What a candle!### 1. Macro & sentiment headwinds
* Bitcoin’s long-dated options skew (180-day) has flipped negative, meaning more demand for puts (protection) than calls — a sign traders are bracing for downside. ( )
* Institutional flows are stalling, and macro risks (hawkish central banks, inflation, stagflation) are looming. ( )
* On-chain and market sentiment metrics show weakening; for example, a “Bull Score” index dropped to zero, a level last seen just before a previous major correction. ( )
**Interpretation:** The broader risk-appetite environment is looking less friendly for an asset like Bitcoin which is exposed to speculative capital, macro liquidity, and sentiment shifts.
---
### 2. Technical structure suggests caution
* Many moving averages (short-, medium-, long-term) are giving “sell” signals: for example, in a recent analysis most EMAs and SMAs on different timeframes were marked as “Sell.” ( )
* A “death cross” (50-day MA crossing below 200-day MA) has been flagged as imminent or occurring, which historically has preceded deeper corrections. ( )
* Breakdown of key chart patterns: e.g., failure of ascending triangle, possible head & shoulders formation with neckline near ~$112,000 — breach could signal further weakness. ( )
* Key support zones are being tested: if Bitcoin falls below major support (e.g., ~$100,000 or ~$91,000) technical targets suggest risk of a drop toward ~$70K-$80K. ( )
**Interpretation:** The technical picture is showing multiple warning signs for potential downside. Support levels are vulnerable; momentum is fading.
---
### 3. Possible downside scenarios & risk levels
* If Bitcoin fails to reclaim near-term resistance (e.g., ~$110K-$115K or the 50-day EMA) it could drift lower. ( )
* A break below key support around ~$100K could open the way to ~$90K or even ~$70K in a more severe move. ( )
* Given macro risk and structural technical weakness, a deeper correction (20 %+ from highs) is a credible scenario.
---
### 4. Why this matters
* For traders: Being aware of elevated risk means adjusting stop-loss levels, perhaps reducing exposure, or waiting for clearer bullish signals before entering new long positions.
* For longer-term holders: While the long-term thesis for Bitcoin may remain intact (network growth, institutional adoption), interim volatility and drawdowns may be sharper and longer than anticipated.
* For risk managers: The confluence of weak sentiment, technical breakdowns, and macro headwinds suggests caution — the odds of a bullish upside surprise are lower in the near term compared to risk of downside.
---
### 5. Summary
In short: Bitcoin currently shows *multiple* bearish signals — macro stress, sentiment turning cautious, technical momentum fading, and support zones at risk. While a rebound remains possible, the path of least resistance in the near-to-medium term appears tilted toward downside rather than rapid upside.
If the price cannot hold critical support levels, the next meaningful drop could be significant.

BTC 1D Update: Stop shorting! The bear market not started yet.Bitcoin has retraced from its recent highs, but this is a healthy correction, not the start of a bear market yet. The price is currently testing a critical area of support.
We are now sitting right on the 61.8% Fibonacci retracement level of the previous major bullish wave. At the same time we are printing a HL on the daily timeframe. Hence, our daily bullish structure is still not broken yet.
A strong bounce off this $90,000 - 61.8% confirms that the recent downturn was simply a correction.
A sustained break and close below $90,000 would invalidate this bullish bias, potentially confirming the start of a true bear market phase.
Shorting Is Dangerous Here
The current price action is highly volatile, but the technical probability favors a bounce from this key level. Its like catching falling knives at this point.
My Bias: BULLISH above $90,000. Wait for confirmation of a strong close above current resistance before entering Long, or look for Long entries near the $90K mark with a tight stop.
Good Luck!

Berkshire Hathaway Finds Support at Key Ascending TrendlineWarren Buffett’s Berkshire Hathaway has made a notable shift in its investment portfolio by initiating a $4.9 billion position in Alphabet during Q3. The firm bought 17.9 million shares, giving Berkshire a 0.31% stake in the tech giant. This move stands out because Berkshire has historically avoided high-growth tech names outside of Apple, signaling a strong vote of confidence in Alphabet’s long-term fundamentals.
Alphabet remains one of the most financially resilient companies in the world. Its core advertising engine is stabilizing, driven by stronger YouTube demand, improving brand ad spend and rising retail ad budgets. Google Cloud continues to expand margins, turning into a major profit contributor after years of investment. Meanwhile, Alphabet’s AI positioning, through Gemini, Google DeepMind and AI-integrated search, keeps the company at the center of the next major tech cycle. With over $100B in cash and minimal debt relative to its size, the balance sheet remains a fortress, aligning with Buffett's preference for durable, cash-rich businesses.
Berkshire’s decision to simultaneously reduce positions in Apple and Bank of America suggests a strategic rebalance toward high-quality growth, especially sectors benefiting from AI and cloud expansion. Alphabet fits this thesis perfectly.
Technical Outlook — BRK.B
The BRK.B chart shows an exceptionally strong long-term uptrend supported by a clean ascending trendline stretching back to 2022. Each pullback to this trendline has produced a new high, showing persistent institutional accumulation. Price recently bounced strongly off the trendline again and is now pushing toward the $542 resistance zone, a key level last tested during previous peaks.
Momentum remains constructive with rising volume confirming renewed demand. As long as BRK.B holds above the trendline, the bullish structure stays intact with upside targets at $542 recent high and potentially $570.

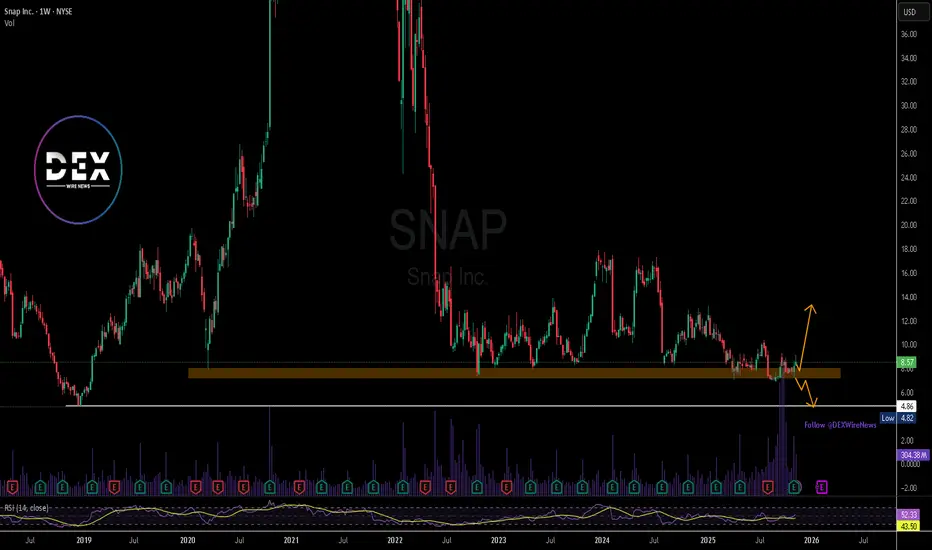
SNAP is sitting on its biggest support in years— a make-or-breakSnap Inc. (SNAP) has spent the last two years in a slow, grinding consolidation after one of the largest boom-and-bust cycles in recent tech-stock history. Following its explosive rally to the $80 region during the 2021 tech mania, the stock collapsed sharply as advertising revenue weakened, interest rates surged, and competition from Meta and TikTok intensified. That sell-off pushed SNAP back to long-term support between $8 and $17 — the same zone that acted as a base in 2020. Today, price is still hovering around that level, suggesting the market is waiting for a major catalyst.
Technically, this support zone remains the most important area on the chart. Every dip into the $8 range has attracted buyers, but momentum remains weak. The weekly RSI sits at 52, showing neutral momentum with no clear trend direction. Volume spikes throughout 2024–2025 signal heavy accumulation and distribution, showing that institutions are active but undecided. The longer price stays here, the bigger the next move will likely be.
The bullish case is simple: if SNAP holds above long-term support and breaks above $10, the stock could attempt a recovery toward $15. That would require improvement in ad revenue, stabilization of user growth, and broader recovery in risk assets. On the other hand, a weekly close below $8 exposes new lows, at around $4, signalling that long-term holders are finally giving up. For now, the chart says one thing: equilibrium.
Investors should continue watching the support zone, volume behavior, and any fundamental developments in digital advertising. Until SNAP breaks away from this range, the stock remains in a waiting game, but the compression suggests the next trend could be strong.
Gold: buyers defend the key demand zoneGold has reached the major demand zone at 4026–3993 — the same area where strong bullish reactions appeared multiple times in the past. The chart shows several reversal structures forming right inside this zone, while the price retests previous liquidity sweeps and a fair-value imbalance created before the last upward impulse.
Technically, gold remains inside a local descending channel, but the main focus is on the reaction from the demand zone. This level is supported by previous BOS signals, high-volume reactions and a clear accumulation base. EMA lines remain above the price, confirming the short-term bearish impulse, but zones like this often become the starting point for medium-term reversals.
Fundamentally, gold stays under pressure due to a strong USD and Fed expectations; however, macro-risks and safe-haven demand continue to prevent a deeper decline. If buyers hold 4026–3990, a recovery toward the major supply zone at 4210–4268 becomes highly probable.
Tactically: the main scenario is to look for confirmations to go long inside the demand zone. First target: 4170–4180. Main target: 4210–4268. If the zone breaks down, gold may head toward 3950.
If demand holds, the next impulse may come much faster than the market expects — gold often moves sharply once liquidity is collected.


LiamTrading – XAUUSD H1 | Two scenarios for the new weekLiamTrading – XAUUSD H1 | Two scenarios for the new week: waiting for reactions at 4100 & Fibonacci zone – prioritizing bullish trades when the market recovers
Gold is completing a technical rebound after a sharp drop, and H1 is showing two clear scenarios for the new week. The medium-term trend remains a downward correction, but on H1, the price is in a recovery phase, so bullish trades will be prioritized – as long as the lower liquidity zones are maintained.
The key this week lies at 4100, the confluence of FVG, Fibonacci, and liquidity – this is the decisive point to see if gold will bounce up or continue to fall deeply.
🔍 Technical Analysis (Fibonacci • Trendline • Liquidity • Volume Zone)
Fibonacci H1: The price may recover to Fib 0.5 (~4140–4150) – a zone with high liquidity & likely to trigger a bearish reaction.
Fib 0.382 (~4120–4130) is currently the first short-term resistance.
Price Structure: The medium-term downtrend still exists, but H1 is creating a recovery wave → prioritize buying when the price pulls back at the support zone.
The descending trendline is still controlling the market. If it breaks the trendline + holds above 4130–4150 → the uptrend is more strongly confirmed.
Important liquidity zones:
4100: liquidity confluence + previous bullish resistance → strong reaction zone.
4085 and 4060: liquidity bottoms – if breached, will trigger a deep decline scenario.
4032: FVG + Fibonacci bottom – the "break or hold" zone for buyers.
Key resistance this week: 4161 – 4187 – 4138 – 4111
📈 TRADING SCENARIOS FOR THE NEW WEEK
Scenario 1 – Bullish trade (priority)
Logic: Gold is recovering; if it holds 4100 and pulls back strongly → target is the upper Fibonacci zone.
Entry: 4100–4111
SL: 4090
TP: 4138 → 4161 → 4187
Suggestion: Wait for strong signals like a pin bar or H1 engulfing to confirm the recovery bottom.
Scenario 2 – Bearish trade (when the market fails to hold the bottom)
Logic: If gold breaks the H1 bottom and retests 4100 without holding → the medium-term downtrend continues to activate.
Entry: 4100–4108 (retest after break)
SL: 4120
TP: 4085 → 4060 → 4032
Suggestion: Only enter when H1 closes below 4100.
🌍 Macro Analysis – Fed disrupts the market
According to the latest data from CME Watch:
54.1% chance Fed holds rates steady at 375–400 bps
45.9% chance Fed cuts rates
The ratio is almost balanced → the market is very uncertain, creating unpredictable volatility ahead of the 10/12 meeting.
In this environment, gold often reacts strongly to unexpected news, so prioritize trading at liquidity zones – wait for clear confirmations.
⚠️ Invalidation Conditions
Price closes below 4060 → fully prioritize bearish trades.
Price closes above 4161 → strong bullish trade activated, discard all sell setups.
What scenario are you preparing for the new week?
Comment & hit Follow on the LiamTrading channel to receive the earliest analysis every day!

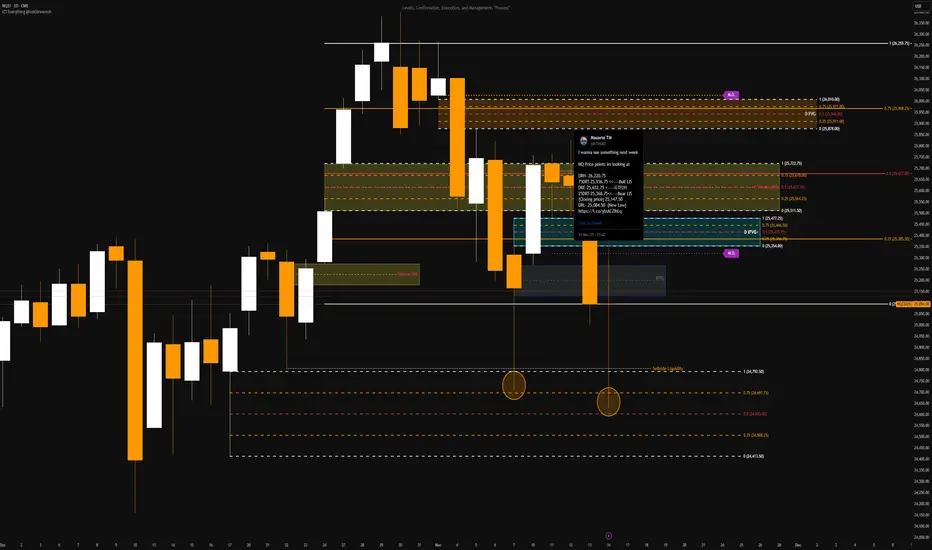
NQ Price points im looking at for reversals or continuationsReversal: Sweep HTF LiQ + Breakaway gap + BRKR + Revisit = Entry
Continuation: Closure above 25,936 + MTF CISD + IMRB/IOFED + LTF OB respected = Entry
DRH- 26220.75
75DRT-25936.75
DRE- 25652.75
25DRT- 25368.75
(close of 25147.50)
DRL- 25084.50
XAUUSD – H4 SCENARIO FOR THE WEEK 17–21/11💛 XAUUSD – H4 SCENARIO FOR THE WEEK 17–21/11 🎯
🌤 1. Overview
Hello everyone, it's Lana here again 💬
The new week begins with a narrowing trading range on the H4 chart, signaling that gold is gearing up for a stronger move. The current medium-term trend needs to break the descending trendline above to confirm the buyers' return.
💹 Technical Analysis
📉 The end-of-week downtrend is entering a technical rebound phase, and there's a high possibility it still has room to continue declining around the 4000 trendline – where it converges with a strong liquidity zone.
🟣 Key price levels to watch include: 4138 – 4200 – 4212 – 4037. These are liquidity concentration points, expected to have clear reactions based on market sentiment.
🔹 Traders can use Fibonacci retracement to time their sell entries, combined with confirmation signals on smaller time frames (M15–M30).
🌐 Macro Context
The financial market is facing difficulties as U.S. tax policies change continuously, putting pressure on both Gold and Bitcoin.
The end of the year is also a characteristic phase of the economic slowdown cycle, where the market tends to adjust more strongly.
🎯 Reference Trading Scenario (Reference Trading View)
Prioritize selling according to the technical rebound, especially when the price enters confluence zones of Fibo + liquidity.
Consider buying only when the price reacts strongly at the 4000 trendline or the 4037 area.
🌷 6. Conclusion with LanaM2
Gold is in a zone preparing for a big move 💛
Be patient and wait for reactions at key liquidity zones to have a better and safer entry point.
If you find this useful, please 💛 Like – 💬 Comment – 🔔 Follow LanaM2 to receive daily gold analysis! ✨

XAU/USD Key Support Test & Probable Trend ReversalTrend Duration Analysis
From the Trend Duration markings:
Recent Trend Durations Noted
Previous uptrend: 21 candles
Prior downtrend: 10 candles
Earlier uptrend: 37 candles
Your indicator suggests the probable length of the current downtrend may also approximate 21 candles, similar to the previous major cycle.
Right now, the downtrend is in early stages and may continue slightly lower into your SUPPORT LEVEL before reversing.
3. Key Levels (from chart)
Support Zone
4,035 – 4,000 (largest highlighted accumulation zone)
This is the critical support on the chart. Price has touched the upper area already.
Secondary Demand Zones
3,980
3,950
3,900
These represent deeper liquidity pockets if the support breaks.
Upside Targets After Reversal
Based on your projection lines:
4,150
4,200
4,300
4,350+ (max extension on dotted projections)
These levels match the Fibonacci-style structure visible on the right side.
4. Price Structure Analysis
✔ Bullish structure before drop
Price formed a strong 37-candle trend up, creating a higher high.
✔ Sharp correction now
The drop into support appears to be a classic liquidity sweep before a trend continuation.
✔ Support Reaction Expected
Your chart clearly shows the expected bounce path marked with a blue dotted diagonal.
If the support holds, we are likely to see:
A higher low formation
Trend reversal back into the projected targets
5. Probable Scenarios
🟢 Bullish Scenario (High probability)
If price holds above 4,035 – 4,000, expect:
Trend reversal up
Recovery into 4,150 → 4,200 → 4,300
A full potential extension toward 4,350 – 4,400
This matches the indicator’s “Probable Length” of the next uptrend.
🔴 Bearish Scenario (Low probability but possible)
If price breaks below 3,980, then:
Market will target 3,950 and 3,900 demand
Trend duration may extend beyond the predicted cycle
But the chart suggests this is a less likely path.
6. Final Summary
Gold is now in a bullish accumulation zone.
Current downtrend is likely near completion (based on the 21-candle forecast).
Support at 4,035 – 4,000 is the critical pivot zone.
A bullish reversal toward 4,200–4,350 is the most probable move if support holds.
Your chart essentially forecasts a buy-the-dip setup with upward continuation. CME_MINI:NQ1! CME_MINI:ES1! CME_MINI:MNQ1! CME_MINI:MES1! COMEX:GC1! COMEX_MINI:MGC1! CBOT_MINI:YM1! NYMEX:CL1! CME:BTC1! COMEX:SI1! CME_MINI:RTY1! NSEIX:NIFTY1! CBOT_MINI:MYM1!

Gold Is Back Online 11.10.2025~+ Data: recent Michigan Consumer & Inflation Miss
~+ CB: rates are on a downward trend long-term

Quantitative and Algorithmic Trading1. What Is Quantitative Trading?
Quantitative trading, often called quant trading, is a method of making trading decisions using mathematical models, statistical techniques, and historical data analysis. Instead of relying on gut feeling, quant traders rely on:
Patterns in price movements
Probability models
Market microstructure data
Statistical relationships between assets
Economic indicators
Machine learning models
The core idea is simple:
Identify predictable, repeatable patterns in financial data and build trading rules around them.
Quantitative trading strategies can range from extremely short-term (like high-frequency mean reversion lasting seconds) to long-term (such as factor investing over months).
Some popular quantitative strategies include:
Statistical Arbitrage
Exploits pricing inefficiencies between correlated assets.
Mean Reversion
Assumes that prices move back toward an average.
Momentum Trading
Buys strong markets and sells weak markets based on trend continuation.
Factor Investing
Uses long-term factors like value, size, momentum, or quality.
Pairs Trading
Trades price divergence between two historically related instruments.
In quant trading, the key inputs are data and models. Traders continuously test hypotheses using historical price data to see whether a pattern exists. If the pattern seems consistent, statistically significant, and robust, it becomes a trading strategy.
2. What Is Algorithmic Trading?
Algorithmic trading—often shortened to algo trading—is the automated execution of trading decisions using computer programs. Once a strategy is designed, an algorithm handles the operational part:
When to enter a trade
When to exit
How much quantity to buy or sell
How to minimize the impact on market prices
How to handle slippage and transaction costs
How to manage order speed and execution
Algo trading makes markets more efficient because computers can react quicker than humans and execute complex rules without emotional bias.
Some algorithmic trading systems operate on microsecond-level decision making, especially in markets like equities, currencies, and futures.
3. How Quantitative Trading and Algorithmic Trading Work Together
A powerful trading system combines both:
Quantitative = Strategy Design
Finding patterns → building models → testing → optimizing.
Algorithmic = Automated Execution
Turning strategy rules into code → placing trades → real-time monitoring.
Modern prop firms, hedge funds, and HFT firms rely on this combination. A quant may design a statistical arbitrage model, while an algorithm engineer builds a low-latency system to execute the model automatically.
4. Components of a Quantitative Trading System
A. Data Collection
Quant traders use massive datasets, such as:
Price data (tick, minute, hour, daily)
Order-book data (depth, bids, offers)
Fundamental data (balance sheets, cash flows)
Alternative data (satellite imagery, web traffic, sentiment)
Macroeconomic data
The quality of data often determines the quality of the strategy.
B. Data Cleaning
Data errors—like missing values, wrong timestamps, corporate actions—must be cleaned. A small error can destroy a strategy.
C. Feature Engineering
Quant traders transform raw data into useful indicators:
Moving averages
Volatility bands
RSI, MACD
Custom statistical signals
Machine learning features
D. Model Development
Models can range from:
Simple regressions
Probability models
Bayesian models
Machine learning models (Random Forests, XGBoost, Neural Networks)
Reinforcement learning
E. Backtesting
This is the backbone of quant trading:
Testing the strategy on historical data to see how it might have performed.
Good backtesting requires:
Realistic assumptions
Handling slippage
Considering trade costs
Avoiding overfitting
Out-of-sample testing
F. Risk Management
Every model must account for risks:
Maximum drawdown
Position sizing
Portfolio diversification
Stop-loss and target rules
Correlation of strategies
G. Live Deployment
Once ready, the strategy is coded into an algorithm and executed live in the market. Continuous monitoring ensures the strategy behaves correctly.
5. Types of Algorithmic Trading Strategies
1. High-Frequency Trading (HFT)
Trades executed in microseconds to capture tiny inefficiencies.
2. Arbitrage Algorithms
Exploiting price differences between exchanges or instruments.
3. Trend-Following Algorithms
Based on moving averages, breakouts, or momentum.
4. Market-Making Algorithms
Providing continuous bid-ask quotes, profiting from spreads.
5. Execution Algorithms
Designed to reduce market impact:
VWAP, TWAP, POV (percent of volume).
6. Machine Learning Algorithms
Use AI models to detect patterns humans cannot see.
6. Advantages of Quant & Algo Trading
1. Higher Speed
Computers analyze thousands of data points in real time.
2. Zero Emotion
Algorithms never feel fear, greed, stress, or hesitation.
3. Better Accuracy
Rules execute exactly as programmed—no human errors.
4. Backtested Confidence
You know how a strategy performed historically.
5. Scalability
A single system can run hundreds of strategies simultaneously.
6. Lower Costs
Automated systems reduce manpower and execution cost.
7. Risks and Challenges
Despite the advantages, quant and algorithmic trading have risks:
A. Overfitting
When a model fits the past too perfectly but fails in the future.
B. Market Regime Changes
Strategies stop working when market behavior shifts.
C. Technical Failures
Bugs, hardware failures, internet outages can cause huge losses.
D. Liquidity Risk
Algorithms may fail in low-volume markets.
E. Flash Crashes
Excessive automation can cause sudden, extreme price moves.
Risk control and continuous monitoring are essential for survival.
8. Real-Life Examples
1. Renaissance Technologies
A legendary quant fund using statistical patterns to deliver unmatched returns.
2. Two Sigma & Citadel
Use machine learning, massive compute power, and big data to build sophisticated trading models.
3. HFT Firms like Jump Trading & Virtu
Specialize in high-speed arbitrage and market making.
These firms prove that data + math + automation = powerful trading edge.
9. The Future of Quant and Algorithmic Trading
The future will see:
More use of AI and deep learning
Alternative datasets (credit card data, GPS data, social sentiment)
Faster execution speeds with improved technology
More retail access to algo tools
Blockchain-based decentralized trading algorithms
Better risk models to manage market volatility
Quant trading is becoming more democratized, with platforms allowing even retail traders to run automated strategies.
Conclusion
Quantitative and algorithmic trading represent the modern foundation of global markets. Quantitative trading focuses on discovering patterns using mathematics, statistics, and data, while algorithmic trading focuses on executing those strategies automatically with speed and precision. Together, they remove emotional biases, increase efficiency, and allow traders to compete in markets that operate at lightning speed. As technology advances—through AI, big data, and automation—the future of trading will continue to shift toward more sophisticated, data-driven, and algorithmic systems.
Crude Oil bull run is comingI can't help but think Crude Oil is about to go on a massive run.
USDJPY chop from 5-6 years ago feels like the crude oil price action.
Economy is weak, would be a shame if price of gas doubled.
NYMEX:CL1!

Yearn Finance ETH DeFi Yield Monster Scarce Supply YFI Rallythis one like many 2020 ETH DeFi blue chips can stage a huge rally off of these lows.
