GBP/USD – BoE Rate Decision Ahead |(06.11.2025)🧠 Setup Overview:
GBP/USD is trading inside a descending channel, with price recently rebounding from a strong support zone near 1.3000.
Ahead of the Bank of England (BoE) interest rate decision, the pair is positioned for a possible bullish breakout if the BoE maintains rates and highlights inflation risks.
📊 Trading Plan:
Bullish Scenario:
If the BoE holds rates and remains cautious on inflation → expect GBP/USD to rebound toward 1.3120 – 1.3180.
Breakout confirmation above channel resistance will strengthen the bullish view.
Bearish Scenario:
If the BoE signals dovish tone or hints at future rate cuts, GBP/USD could drop below 1.3000, targeting 1.2850 – 1.2710.
⚙️ Technical Levels:
🟢 1st Resistance: 1.3133
🟢 2nd Resistance: 1.3171
🔴 Support Zone: 1.3000 – 1.3020
Pattern: Falling Channel → Potential Breakout
🧩 Fundamental Insight (Today – 6 Nov 2025)
1.Markets price a 1-in-3 chance of a BoE rate cut to 3.75%, but consensus expects a hold at 4.00%.
2.UK inflation at 3.8% YoY remains above the BoE’s target, supporting a hawkish stance.
3.A surprise dovish tone, however, could hit the pound hard against the USD, especially as US data remains resilient and the dollar stays firm.
#GBPUSD #BoE #Forex #TechnicalAnalysis #PriceAction #ChartPatterns #KABHI_TA_TRADING #FundamentalAnalysis #BankOfEngland #InterestRates #FXMarket #TradingPlan #ForexSetup #ChartsDontLieTradersDontQuit #GBP #USD #TradingView
⚠️ Disclaimer:
This analysis is for educational purposes only and not financial advice. Always do your own analysis and manage risk carefully before trading news events.
💬 Support My Work ❤️
If you find this chart helpful — LIKE 👍, COMMENT 💭, and FOLLOW 🔔 to stay updated with more daily Forex setups and price action insights!
Fundamental Analysis

Swing Trade on AUDNZD, Long @ 1.1517 EntryIBKR:AUDNZD Price has recently broken through the SR level @ 1.1433 and this level has been retested & held; we're now waiting for the continuation.
Look for an entry at 1.1517 , stop below the zone at 1.1426 , target 1.1750 (2:1). There'll be slight upside resistance, which might cause a bit of choppiness/consolidation at the psych level @ 1.1600, but the overall trend is up, and we're trading well above the Daily MA200 & Weekly MA200.
Fundamentally, we're looking good and expecting further upside on the pair both short and medium-term:
RBA has paused whilst RBNZ is easing, widening Australia's yield edge in the near term; over hte next 3-6 months Australia's rates will likely remain above New Zealand's as RBNZ cuts further.
AU inflation surprised higher while NZ inflation eased amid weak growth. Stronger AU inflation/growth momentum vs sluggish NZ suggests medium-term AUD outperformance.
Strong Chinese iron-ore and wider critical minerals demand supports AUD while NZ's dairy prices and exports have softened.
Key Catalysts (forward-dated):
2025-11-05 — RBA policy decision — Expected: Bullish
2025-11-26 — RBNZ monetary policy meeting — Expected: Bullish
2026-02-03 — RBA monetary policy meeting — Expected: Bullish
2026-02-18 — RBNZ monetary policy meeting — Expected: Bullish

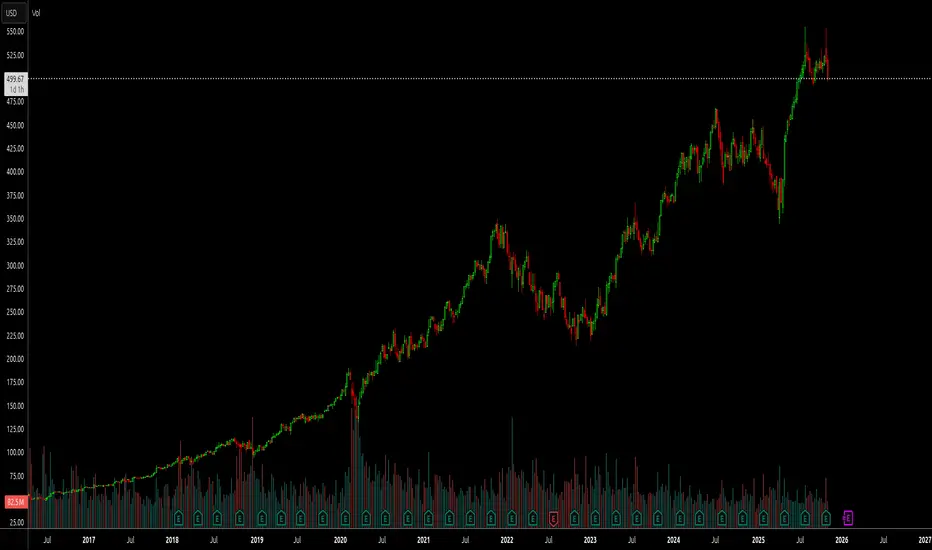
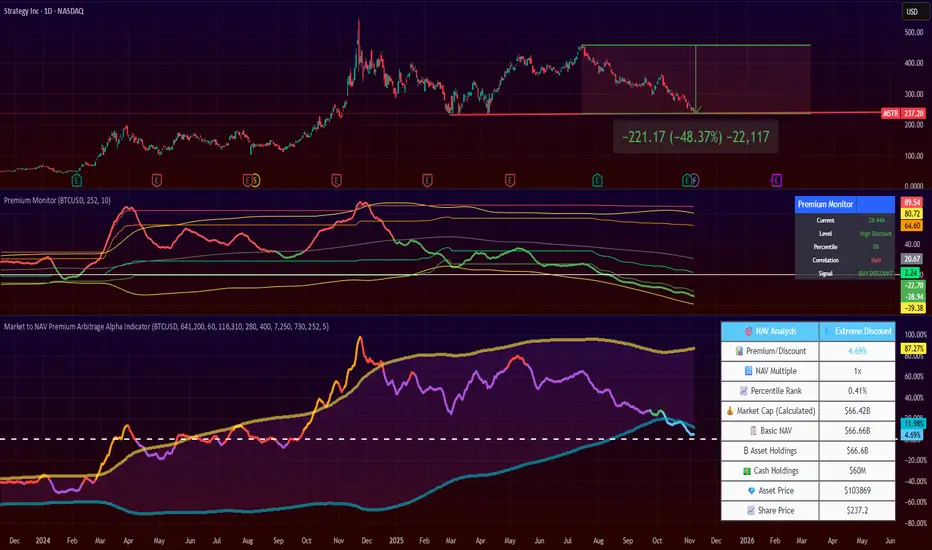
Strategy's Premium is Gone. Time to Load? 4 months ago, I posted that NASDAQ:MSTR premium was unsustainable and the stock price would drop.
Since then, the price dropped by 50%!!
Now, Strategy's is close to zero, and I flip my views on it.
If you like this kind of trade, it might be a good time to start DCA'ing it.
Note that Strategy continues to be a highly volatile stock, more volatile than Bitcoin itself.
Finally, the stock is now at a technical resistance level.
You can keep an eye on the premium/discount of this stock by looking at my 2 indicators:
Market to NAV Premium Arbitrage Alpha Indicator , and
Asset Premium/Discount Monitor
The Gold Rush and Washington's Strategic MoveThe US OANDA:XAUUSD and OANDA:XAGUSD markets are experiencing an unprecedented boom, with demand up 58% in the last three months alone, precious metal ETFs attracting over $16 billion. But behind this wave of investment is not just a defensive sentiment against inflation or geopolitical risks, but also a deeper shift in the global resource power structure.
On November 6, the US Department of the Interior unexpectedly added copper, silver and metallurgical coal to its list of “critical minerals,” expanding the strategic scope of supply security. The list, updated every three years by the US Geological Survey (USGS), will serve as the basis for a new round of tariff reviews under Section 232, a legal tool that allows tariffs on national security grounds.
The move was seen by analysts as a clear political signal: Washington is increasingly viewing industrial and precious metals not just as commercial goods, but as strategic assets in global supply chain competition.
A Strategic, Not Just Commercial List
According to the USGS, the definition of “critical minerals” includes materials that are essential to the economy or national security, are vulnerable to supply chain disruptions, and have systemic impacts if they are not available.
Silver, a metal widely used in electronics, solar panels, jewelry, and investments, is the most notable case. Its inclusion on the list has caused market volatility: New York silver stocks hit record levels, while London markets saw short-term shortages. The United States currently relies on imports for nearly two-thirds of its silver needs, mainly from Mexico and Canada.
The addition of silver “is the start of a new policy cycle,” said Suki Cooper, an analyst at Standard Chartered, and if tariffs are imposed, it could reshape the global balance of supply and demand for precious metals. While some silver customs codes have been exempted, the political signals from Washington are enough to trigger a wave of speculation and hoarding.
From Minerals to Geopolitical Power
This is not a one-off change. The US administration, starting with Trump and continuing under Biden, is remaking mineral policy as part of its national security strategy.
From promoting domestic mining, to funding smelting projects, to using financial tools like tax credits and federal loans, Washington is trying to reduce its dependence on imports, especially from China, which now dominates many rare and industrial metals supply chains.
In addition to silver, elements such as lead, silicon, phosphate, uranium and rhenium were also added to the list, reflecting the US vision of a “transitional energy economy”. Meanwhile, elements with the highest risk of supply chain disruption, such as rhodium, gallium, germanium, tungsten and rare earths, remain in the “special priority” category.
The resource power structure is shifting, and the US clearly wants to reshape that order, starting with establishing a “self-reliant mineral ecosystem”.
Gold, silver and investor defense
In this context, the acceleration of the gold and silver markets reflects more than just traditional safe haven sentiment. The 58% surge in precious metals demand in the US shows that capital is shifting from financial assets to physical goods, a manifestation of concerns about the debt cycle, expansionary monetary policy and prolonged geopolitical volatility.
Precious metal ETFs recorded net inflows of $16 billion in the most recent quarter alone, while gold prices continue their relentless bull run. Gold and silver are being repositioned as “strategic assets”, not just temporary shelters.
Long-term impact
The US upgrade of its mineral policy represents a turning point in post-globalization industrial policy: not just to protect productive capacity, but also to create leverage in strategic competition with other economies.
If tariffs and financial support are implemented in a coordinated manner, the metals market could enter a prolonged bull market, with higher volatility and deeper fragmentation in global trade.
In the long run, this is not just a story about gold or silver prices, but about how the US reshapes the physical power base of the 21st century economy.
Technical outlook analysis OANDA:XAUUSD
After a strong rally from July to early October, gold prices have entered a correction and consolidation period around the $3,850–$4,000/ounce range. The daily chart shows a short-term bearish structure within a falling channel, but selling pressure is showing signs of weakening as prices hold above the 0.5 Fibonacci level at $3,846/ounce.
The RSI is moving sideways around the neutral level of 50, indicating that the bearish momentum has slowed down, while the short-term MA21 (around $4,055) is acting as important dynamic resistance. A decisive break above $3,973–$4,000 could be an early signal for a technical recovery towards the $4,120 (0.236 Fibo) range.
Conversely, if the price loses the $3,846 mark, corrective pressure could pull the price to the next support zone at $3,720 (Fibo 0.618), which corresponds to the medium-term bottom of the current price channel.
Overview:
Gold is in a consolidation phase after a long rally, with the range narrowing and awaiting a fresh catalyst from monetary policy or geopolitics. A compression phase before a breakout is likely, with lower risk for buyers if prices continue to hold above the $3,850 area.
SELL XAUUSD PRICE 4021 - 4019⚡️
↠↠ Stop Loss 4025
→Take Profit 1 4013
↨
→Take Profit 2 4007
BUY XAUUSD PRICE 3939 - 3941⚡️
↠↠ Stop Loss 3935
→Take Profit 1 3947
↨
→Take Profit 2 3953

GBP/USD 1.3159 Analysis — Fibo Confluence SetupGBP/USD Analysis — Fibo Confluence Setup in Line with the Downtrend
Context:
The market is maintaining its main bearish trend, with price structure still having room to extend toward lower levels.
Technical Analysis:
1️⃣ The overall trend remains steadily bearish, with no clear signs of reversal.
2️⃣ When drawing the Fibonacci retracement in the direction of the trend, the 0.5–0.618 zone aligns with the key level around 1.3159, creating a strong confluence between two major swing points (high and low).
3️⃣ This is an area where price may react downward again if the current bearish structure continues.
Expected Scenario:
Observe price behavior around 1.3159. If price shows weak reaction here and signals continuation, the downtrend is likely to strengthen further.
The area above the confluence zone can be viewed as a risk management zone for this setup.
Analysis by: Hung Minsk Fibo Trung

NKE may be ready to jump big timeFrom a technical standpoint, it’s important to note that we appear to have completed a multi-year correction, followed by a solid relief rally and a subsequent pullback to the 61.8% Fibonacci retracement level. This is the basis of my technical stance.
My fundamental analysis of NIKE, though, reveals a company at a critical inflection point. The analysis indicates significant deterioration that current market pricing fails to adequately reflect. The -43.5% net income decline, -9.8% revenue contraction, and -50.6% free cash flow deterioration paint a concerning picture of operational challenges and margin compression.
Despite these headwinds, NIKE continues to trade at premium valuation multiples that appear disconnected from the company's current growth trajectory. The P/E ratio of 27.9x and EV/EBITDA of 20.7x are difficult to justify given the earnings contraction and negative revenue growth. While technical indicators suggest oversold conditions, the broader trend remains downward, reflecting market recognition of these fundamental challenges.
The saving grace for NIKE remains its formidable brand equity and global market positioning, which provides some downside protection and potential for recovery if management can successfully navigate the current competitive landscape. However, until clear evidence emerges of successful execution and fundamental improvement, the risk/reward profile remains unfavorable long term. I would recommend a HOLD stance with caution , as current valuation levels appear unsustainable and fail to adequately discount the operational headwinds facing the company.
Current Price: $62
Price Target: $96
Invalidation: $55

GBP/USD Technical Analysis – November 7, 2025The British Pound has recently formed a rounded bottom (cup pattern) on the 1H timeframe, signaling potential bullish continuation if momentum sustains above the neckline area near 1.3120–1.3140.
Technical overview:
The EMA(9) is currently trending upward around 1.3129, providing short-term dynamic support.
The price has broken through the neckline resistance near 1.3120, retested, and is now attempting to resume the uptrend.
The bullish target for this structure sits around 1.3165–1.3180, which aligns with previous supply and Fibonacci 0.618 retracement of the last major downswing.
A failure to hold above 1.3100 would invalidate this bullish setup and could trigger a pullback toward 1.3060.
Trading plan:
Buy Zone: 1.3110–1.3120 (confirmation from lower-timeframe bullish candles recommended)
Take Profit (TP): 1.3165–1.3180
Stop Loss (SL): below 1.3100
Risk-reward ratio: approximately 1:2
Market sentiment:
The pair is gaining strength following improved risk appetite and softer U.S. yields, but traders should remain cautious ahead of upcoming U.S. labor data and BoE comments, which could cause volatility spikes.
In summary, GBP/USD maintains a short-term bullish bias as long as 1.3100 holds. A clean breakout above 1.3180 could open the path toward 1.3220.
Stay patient and follow price reaction near the neckline — confirmation is key before committing to the next swing.
Follow for more daily forex setups and strategies.

EUR/USD 1.1570 Analysis — Fibo Confluence Setup Downtrend🔹 EUR/USD Analysis — Fibo Confluence Setup in Line with the Downtrend
Context:
Price is currently in a primary downtrend. The market structure remains consistently bearish, with room for the trend to continue.
Technical Analysis:
1️⃣ The overall trend remains bearish, with no clear signs of reversal yet.
2️⃣ When drawing the Fibonacci retracement in the direction of the trend, the 0.5–0.618 zone coincides with the key level at 1.1570, forming a strong confluence of three technical factors.
3️⃣ This is a potential reaction zone where price may continue its downward momentum if the market structure remains intact.
Expected Scenario:
Monitor price action around the 1.1570 area. If price shows weak bullish reaction and signals continuation, the downtrend is likely to strengthen.
The area above the confluence zone can be viewed as a risk control region.
Analysis by:Hung Minsk Fibo Trung

Gold (XAU/USD) Technical Analysis – November 7, 2025Gold is currently consolidating within a broad sideways range between 3940 – 4040, showing limited directional conviction after several sessions of choppy movement. On the 1H timeframe, the price structure suggests a potential short-term retracement before a new bullish wave emerges.
Technical outlook:
EMA(9) is flattening near 3990, confirming indecision and range-bound sentiment.
Price has repeatedly rejected the 4035–4040 resistance zone, forming a temporary ceiling.
The support area lies near 3935–3945, aligning with previous demand and the lower boundary of the current accumulation channel.
The projected move shows a possible dip toward support before rebounding toward 4040–4050 if buyers regain momentum.
Trading strategy:
Buy Zone: 3935–3945 (look for bullish confirmation patterns)
Take Profit (TP): 4040–4050
Stop Loss (SL): Below 3925
Alternatively, sell scalps near 4035 with tight risk until breakout confirmation.
Market sentiment:
The market remains in equilibrium, awaiting new macro triggers (such as US economic data or bond yield adjustments). A breakout above 4040 could shift bias toward 4080–4100, while a breakdown below 3930 may reopen a path to 3880.
Keep monitoring intraday reactions at the range boundaries — patience and precision are key in sideways markets.
Follow for daily insights and updates on gold price action.

NQ Nasdaq down to 24,900? Or rebound?The next level lower for NQ is 24,900. This price level also has confluence with the daily 200 EMA. Is there enough buyer interest to rebound before dropping to this level? Or, is this just a healthy pullback? Do you think NQ can go lower?

Gold Price Forecast (7 Nov 2025): Buyers Waiting Below $4,000📌 Current Price Snapshot
The spot price for Gold is around US $3,991 per troy ounce (as of 7 Nov 2025) according to
In Australian dollars the price is about A$6,144 per troy ounce.
🎯 Key Technical / Market Context
Resistance / Support zones
The metal has tested and broken through the psychological US $4,000/oz level recently but has found resistance there.
World Gold Council
A key breakdown level is around US $3,700/oz. If price drops below that, it opens a risk of deeper pull-back (to ~US $3,500/oz).
On the upside, if momentum returns and breaks convincingly above ~US $4,400/oz it could trigger a fresh leg upward.
Technical indicators
The recent analysis shows gold is trading below its 50-day EMA, meaning short-term momentum is weak and there’s dominant selling pressure.
Economies.com
While oversold indicators have given somewhat of a bounce, the up-trend is not yet strong.
Economies.com
Drivers (fundamentals & macro)
A weaker US dollar and expectations of rate cuts by Federal Reserve have been major tailwinds for gold.
goldpriceforecast.com
Geopolitical uncertainty and central-bank buying are adding structural support.
But caution: If the dollar strengthens, or rate cuts get delayed/inflation surprises happen, gold could be vulnerable.
BullionByPost Europe
🔍 My Trading View & Strategy
Given the current levels and market structure, here’s how I’m positioning, if I were trading gold today:
Short term (next few days to 1–2 weeks):
With the price ~US $3,991 and under pressure below key moving averages, I’m not chasing a long position aggressively. I’d wait for either:
A dip toward support (~US $3,700) with signs of bounce (good risk-to-reward for long).
Or a breakout above ~US $4,200-US $4,400 with strong volume and momentum for long.
Medium term (next 1-3 months):
My base view is still bullish (structural tailwinds remain) but price is in a consolidation/correction phase. So:
Consider buying on dips around US $3,700-3,800 with tight stops.
If price drops below US $3,500, reevaluate: risk of deeper correction.
If price breaks above US $4,400 convincingly, potential target toward US $4,800+ in that window.
Risk management:
Stop-loss placed just below the key support (e.g., beneath US $3,650) to protect downside.
Use smaller size if entering in this somewhat volatile environment.
Keep an eye on macro news (Fed announcements, USD moves, inflation prints).

Rest day on Friday.After the volatile move to the downside on the daily chart in the S&P 500 on Thursday, the expected behavior for Friday is a rest day which result in Friday's daily range inside of the range from Thursday.

EURUSD 3H: Selling the OTE High - Targeting the Drawdown🎯 EURUSD 3H: Selling the OTE High - Targeting the Drawdown
Timeframe: 3-Hour (3H) Chart Analysis: High-Probability ICT/SMC Setup
EURUSD has just wicked into the 3H OTE High at 1.1550, a classic high-probability level for a short entry. We are looking for an immediate reversal and a strong move lower.
The Setup:
Entry Zone: Price has touched the key resistance/reversal zone around 1.1550 (OTE High).
Target (Liquidity Magnet): The target for this short swing is the 3H OTE Low at 1.15280. This is where sell-side liquidity is waiting, and we expect institutional flow to drive price down to fill this gap.
Anticipation: The chart projects an immediate bearish move, driving down to complete the mitigation of the recent high and test the liquidity at the lower OTE level.
Watch for confirmation on lower timeframes (e.g., 15m/5m) for a break in market structure to confirm the short entry!
Greetings,
MrYounity

XAUUSD: Daily OTE & CRT Setup - Targeting the DrawdownTimeframe: Daily (1D) Chart Analysis: Smart Money Concepts (SMC) / ICT
Gold (XAUUSD) is setting up a high-probability move as it consolidates beneath the recent Daily OTE High. The daily candle is painting a potential CRT Manipulation phase before a distribution down to clear liquidity.
The Setup: Targeting the CRT Drawdown
Current Range (CRT): Price is currently held within the range of the last major daily candle, suggesting Accumulation/Distribution is in progress.
OTE High Resistance: The overhead resistance at $3,991.82 (OTE High) is critical. A potential short-term sweep above this level (the Manipulation phase of CRT) could occur to grab liquidity before the main move.
The Liquidity Target: The projected path indicates a clear run to the Daily OTE Major Low at $3,929.78. This level is a major magnet for liquidity and represents an excellent area for the next Accumulation phase and a potential long entry.
🎯 Trade Plan:
Bearish Bias: Favor a move down toward the $3,929.78 zone.
High-Probability Entry: Wait for price to enter the lower OTE zone at $3,929.78 and look for a lower-timeframe Market Structure Shift (MSS) or bullish Displacement for a long entry confirmation.
The path of least resistance is lower to mitigate the recent Daily high and collect the sell-side liquidity.
Greetings,
MrYounity

"Short-selling is correct" - Gold consolidation awaits breakout.Gold prices have indeed been somewhat sluggish recently, fluctuating repeatedly within a range. While this volatility can be agonizing, it reflects the market's rhythm. In terms of trading, avoid blindly chasing highs and lows. If you're bearish, don't chase the market down. Patiently wait for a rebound and resistance before entering a position. The recent market rhythm is very clear: sharp rallies are prone to pullbacks, and sharp drops are prone to rebounds – typical characteristics of a range-bound market. Our trading advice remains clear: focus on the 4010-4030 area. If a rebound fails to break through resistance, continue shorting, building positions in batches and proceeding steadily. We have repeatedly emphasized that gold is currently in a range-bound, slightly bearish adjustment phase, with the overall center of gravity continuing to shift downwards. Short-term rallies do not signify a reversal, and so-called signals are often just bull traps. High-level rebounds remain a good opportunity to establish short positions. Market conditions can change rapidly, but there are always patterns to follow. Don't be misled by appearances; look at the underlying logic and structure. Gold is still in a downward continuation phase. Rebounds present opportunities, while false breakouts pose risks. Gold prices fell as expected. Although we exited early and missed the lowest point, a steady exit is a victory in itself. Trading is never about who is more greedy, but about who knows how to control the pace better.

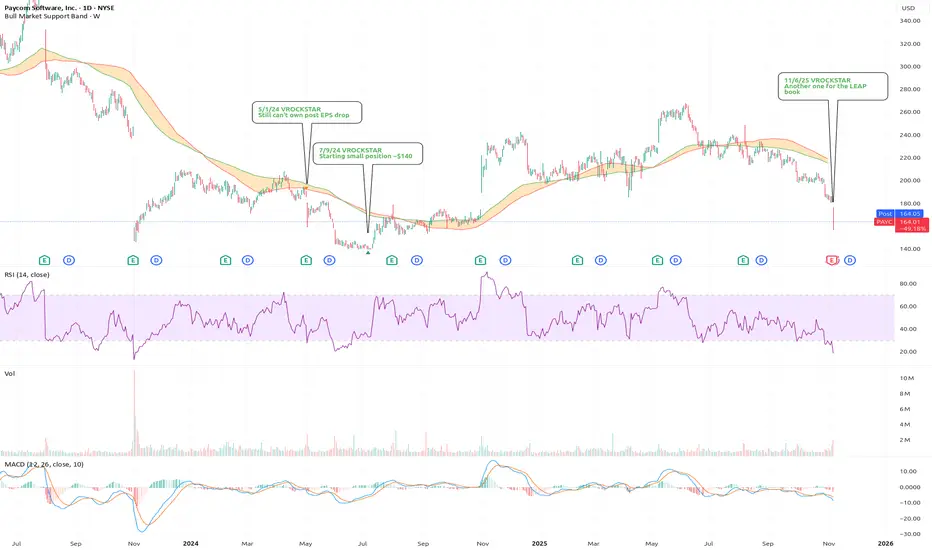
11/6/25 - $payc - Another one for the LEAP book11/6/25 :: VROCKSTAR :: NYSE:PAYC
Another one for the LEAP book
- $9B business
- solid high teens low 20s ROICs
- growing HSD top line
- trades like every other HCM business
- guys we are 100% in a consumer/ business recession
- so it's expected these things are trading as such - i'm not going to take the opposite POV
- it will defn take more than a few rate cuts to correct this ship. usually what happens is the wheels fall off the magic school bus of hopium, things crash and the powers that wannabe step in to buy everyone's bags. that hasn't happened
- so what i'm doing is collecting 5-10 names rn that are great LEAP spots
- 2-1 and will collect premium as these things start to move one way or another
- this is a solid name in the HCM space, perhaps the best one to watch
- but alas, there are no great beta in a tide-go-whoa.
- keep that head screwed on, cash heavy book still looks best
- if u spot anything that makes sense LMK!
- rn I like:
1/ networks
2/ growing minimally HSD, ideally teen++
3/ solid ROICs
4/ FCF mgns in the 6%+ region
5/ no skeletons or "need a Q or two of resolution" stories
V
Tempus AI — Is This Where Time Turns Bullish Again?Fundamental View
Tempus AI (NASDAQ: TEMP) continues to attract attention with major partnerships in the AI and biotech space — including collaborations with AstraZeneca, Illumina, and Boehringer Ingelheim.
These deals strengthen its role in using AI for diagnostics and drug development, giving it strong long-term growth potential.
However, as a newly listed and high-growth company, short-term volatility remains likely.
Technical View
Price has made a sharp retracement into the golden OTE zone ($72–$63), overlapping a high-probability Fair Value Gap (FVG) and the weekly bullish Order Block (OB).
This zone represents a key area of interest where smart money could accumulate.
Safer traders will wait for confirmation signals within this zone, while aggressive entries could scale in early with managed risk.
Upside targets are $103 for partial profit and $155 for a full swing continuation.
Outlook
Tempus sits at a critical turning point — strong fundamentals meet a high-probability technical setup.
If the golden zone holds, a bullish reversal could unfold toward major liquidity levels.
Patience and confirmation remain key before full commitment.
⚠️ Disclaimer: This breakdown is for educational and entertainment purposes only. It is not financial advice — always DYOR and trade responsibly.

11/6/25 - $mdalf - Hrm. Buying more... sus px action11/6/25 :: VROCKSTAR :: OTC:MDALF
Hrm. Buying more... sus px action
- so much for being mostly cash
- even this guy is looking for a MSD++ year, ugh
- but realistically, i remain high cash
- and a LOT of the stuff i've been building positions in (the "LEAP book") are down 20 to 60% on the year and honestly that's the point
- here's another one
- sheesh. people LOVED it at $35 and they can't be bothered to care at half off
- these guys supply most space satellites in one way or another
- they're actually a profitable company
- actually have a backlog
- so perhaps there's something fishy here. TBH I'm keeping it small, but today it's now a 2% position and my trigger is to make it 3% once we get to the $12-13 region and i've had a chance to come up for air.
- stay sane out there. the index doesn't tell the story. we are in a consumer recession/depression and many stocks are already deep recession/ correction.
- it's these times in 2H of 4Q and 1H of 1Q where people act all irrational. they cut losers to offset winners... and you get great deals. good names get sold and they should keep running
- stay plugged in.
- this is the hard part. and this is where the money is made, always, without exception. just be careful about the leverage and stay nimble.
V

Gold up correction wave X Gold price is currently in wave X of correction WXY. Today, 06-11-2025, wave 2 is expected to correct to 3958. Buying from 3960, targeting 4072 as wave 3. Stop loss at 3945.

Potential BUY Trade Idea GOLD (xauusd) 15mins TFLooking forward to go Long as a trend reversal trade setup.
Counter Trade- Highly Risk but tradable as long as we get the green light
Will update you soon when trade executed or becomes invalid.

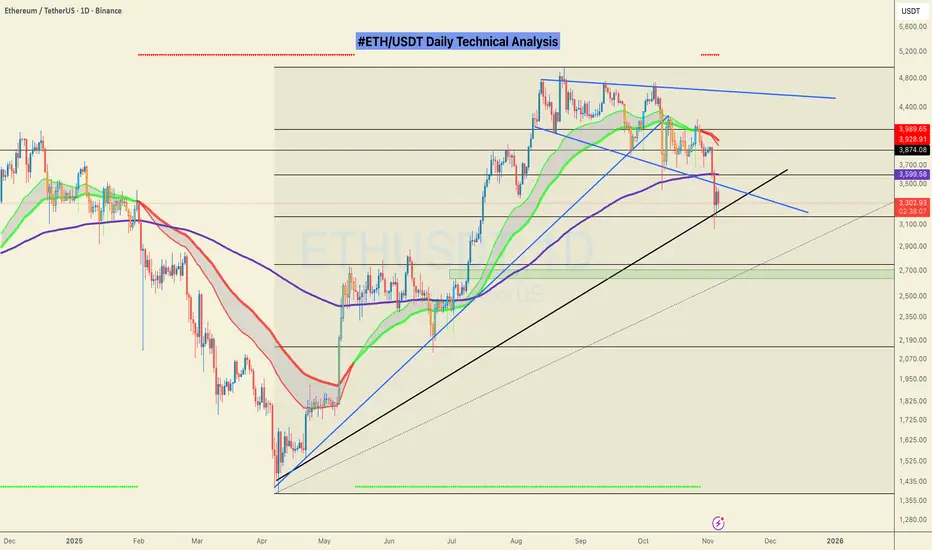
Does this scenario cross your mind? What if…Does this scenario cross your mind? What if…
CRYPTOCAP:ETH drops below $3,000, maybe $2700, and everyone thinks it’s all over. Then, just as everyone is convinced the bears have won, ETH bounces back, shaking out the sceptics while most people stay on the sidelines. Meanwhile, Tether and the Bitcoin dominance index show bullish moves but suddenly start printing negative daily closes.
Altcoins begin pumping again. To mask what's really happening, you'll start seeing a few bullish headlines about some random company that has nothing to do with crypto. Classic.
What’s your take on this?
Do share your views in the comments and hit the like button if you like it.
Thank you
#PEACE
Natural Gas - Bullish Long Term SignalNatural Gas rallied on inventories today.
Inventory report came in better than expected. 33B build vs 34B estimate.
Natural Gas is on the precipous of squeezing to $5.40
A golden cross is set to occur in the next few sessions....When the 50MA and the 200 MA crossover occurs it likely means the medium to long term price goes higher.
In the very near term that signal often results in some profit taking.

Don’t Rush the AI Infrastructure Arms Race: Waiting Could Win### Don’t Rush the AI Infrastructure Arms Race: Why Patience Could Win
In the tech sector, the urge to invest heavily in GPUs and data centers is strong—to capture market share before competitors do. However, early movers risk a dangerous trio: skyrocketing capital expenditures (capex), fast hardware obsolescence, and inflexible financing. A wiser strategy for many investors and operators? Pause non-essential spending, secure options on emerging technologies like photonic and optical computing, and wait for innovations to mature before locking in major commitments.
#### 1. Hyper-Capex Meets Power Shortages
Big tech firms are projected to spend $350–$400 billion on capex in 2025, mostly for AI infrastructure, with global AI investments potentially hitting $1–2 trillion by 2029 (Goldman Sachs, 2025 forecast). U.S. data center power demand is expected to triple by 2030, surging 22% in 2025 alone (Electric Power Research Institute). Governments, including the U.S. DOE, are already considering power rationing for data centers amid grid strain—echoing overbuild risks in resource-limited sectors like semiconductors (WIRED, Oct 2025).
#### 2. The Hardware Treadmill Accelerates Obsolescence
NVIDIA's high-end GPUs now launch annually (e.g., Blackwell in 2024 to Rubin in 2025), with power draw rising to ~1,200W per unit (NVIDIA Q3 2025 earnings). This shortens cluster lifespans from 3–5 years to 1–2 years, stranding investments in cooling systems and networks. AMD and Intel follow suit, per CUDO Compute's 2025 analysis, amplifying depreciation costs by 40–50% for outdated setups.
#### 3. Financing Shifts to Debt at Peak Cycle Risk
AI projects increasingly rely on debt: Over $200 billion in AI-related bonds issued in 2025, including $30 billion single deals for data centers (Bloomberg). Off-balance-sheet financing for mega-campuses adds leverage, but with hardware depreciating rapidly, any ROI dip could erode equity value—mirroring the 2022 crypto mining debt crisis (Financial Times, Nov 2025).
#### 4. Photonic and Optical Computing Gains Traction
Silicon photonics and optical interconnects offer 10x bandwidth with 50–70% less energy use for AI workloads (Lightmatter whitepaper, 2025). Firms like Lightmatter and Celestial AI are deploying optical I/O in pilots, targeting full photonic accelerators by 2027. Locking into copper-based systems now could leave investors with inefficient "thermal walls," as optical scales to exascale computing (MIT Technology Review, Sep 2025).
#### 5. Ternary Logic: A Disruptive Wild Card
Ternary (base-3) computing, using three states per bit, could boost efficiency 30–50% over binary for AI inference (IEEE Spectrum, 2025). Revived via neuromorphic chips from startups like Mythic, it's lab-proven but not scaled—yet it highlights the peril of over-investing in binary ecosystems, much like quantum's threat to classical bits (Wikipedia; arXiv preprints, 2025).
#### 6. Even Leaders Strain for Capacity
OpenAI has tapped $10 billion in credit lines and chip-leasing deals in 2025 to hoard GPUs, per Reuters. This cash-burn approach ties firms to current tech paths; a photonic pivot could disadvantage debt-laden players, favoring agile newcomers with cleaner sheets.
#### Actionable Steps for Investors and Operators
- **Pause Legacy Builds**: Limit GPU/data center capex to projects with >20% IRR under obsolescence/power stress tests. Opt for modular, 18-month depreciation (The Next Platform, 2025).
- **Secure Future Options**: Sign pilot MOUs with photonics leaders; reserve optical upgrades in contracts for penalty-free swaps (Lightmatter, 2025).
- **Flexible Financing**: Use staged debt, pay-as-you-go leases, and vendor rebates tied to milestones—avoiding the leverage traps seen in recent $50B+ issuances (Financial Times).
- **Co-Develop for Priority**: Invest small in non-recurring engineering (NRE) for optics trials; offer AI datasets for faster validation and queue-jumping (IDTechEx report, Q4 2025).
- **Mitigate Power Risks**: Hedge via futures; site builds near renewables with PPAs expandable to 500MW+ to dodge allocation caps (S&P Global Ratings, 2025).
**Bottom Line**: Amid trillion-dollar AI bets, optionality trumps haste. Wait for photonics and advanced logic to commercialize—delivering cooler, cheaper compute—without the drag of obsolete, debt-fueled infrastructure. Patience positions winners for the next curve.