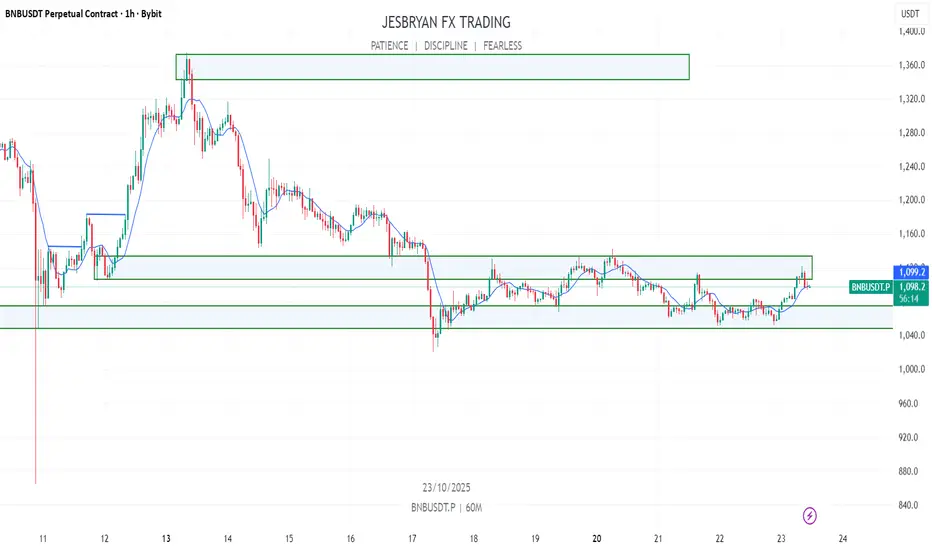
BNB analysis: BYBIT:BNBUSDT.P Price is currently trapped between the support and resistance levels. A breakout above $1150 could push the price toward a new all-time high. The key support is around the $1000 level, and a drop below this would be considered bearish.
Fundamental Analysis
FTSE: hunt on previous highs. An excellent set-up with FTSE sweeping the weekly internal range liquidity first before aiming for external range above. Daily RSI support the trade along with bullish divergence. Text-book.

SILVER | Head & Shoulder Breakdown After All-Time HighAfter reaching a new all-time high, #SILVER seems ready for a healthy correction before the next bullish rally.
🔹 On the 1H timeframe, price has clearly formed a Head & Shoulder pattern.
🔹 The neckline has been broken, confirming the start of a bearish move.
🔹 This indicates a possible short-term correction phase before bulls take control again.
Trade Idea:
Taking a short position at CMP with strict risk management looks favorable.
Potential targets: near recent support levels.
Stop loss: above the right shoulder.
Always wait for candle confirmation and use proper position sizing.
What’s your view — will #Silver continue the correction or bounce back soon?
Comment your thoughts below and don’t forget to like, follow, and share if you find this analysis helpful!
#Silver #XAGUSD #HeadAndShoulders #ChartAnalysis #TechnicalAnalysis #PriceAction #TradingSetup #Commodities #Forex #Metals #SwingTrade #DayTrading #TradeIdeas #BearishSetup #RiskManagement #TradingCommunity #MarketAnalysis #TradersLife #TrendReversal

USDJPY Buy Setup | Liquidity Grab + Order Flow + CHOCH/BOS📈 On USDJPY , the market is showing a beautiful example of a bullish structural shift based on smart money concepts and clean order flow behavior.
Recently, we’ve seen a Change of Character ( CHOCH ) followed by a Break of Structure ( BOS ) — this confirms that the bearish momentum has shifted and buyers are stepping in on higher timeframes.
This gives us a bullish bias heading into the next sessions.
💧 Liquidity Context:
There’s plenty of resting liquidity below current price, including Asian session liquidity, which the market might target to collect before continuing higher.
This area of liquidity aligns perfectly with our bullish order flow, offering a potential liquidity sweep → order flow continuation setup.
⚙️ Order Flow Insight:
Instead of a simple OB touch, we’ll focus on order flow alignment — waiting for the market to:
1️⃣ Grab the external liquidity below recent lows,
2️⃣ Rebalance or mitigate within the bullish order flow zone, and
3️⃣ Show a strong shift in LTF structure (MSS / CHOCH) to confirm the intent to move upward.
This ensures that we’re entering in line with momentum, not against it.
🧭 Trade Plan:
✅ Wait for liquidity to be swept below the lows (including Asian liquidity).
✅ Once the liquidity is taken, monitor the 1M–5M timeframe for a clean bullish confirmation:
Minor CHOCH / MSS,
Strong bullish engulfing candle, or
Clear market structure alignment with higher highs and higher lows forming.
✅ After confirmation → execute long , following order flow in the bullish direction.
❌ No confirmation → no trade. Simple and disciplined.
🎯 Targets:
Initial targets will be around the next swing high and liquidity zones above BOS, while keeping the higher timeframe flow in mind for possible continuation.
🧩 Setup Summary:
Bias → Bullish
Confluence → CHOCH + BOS + Liquidity Grab + Bullish Order Flow
Entry → Only after strong LTF confirmation (1M–5M)
Target → Next Swing High / Liquidity Pool Above
Type → Scalp to Intraday Buy Setup
Risk Rule → Confirmation-based entry only
⚠️ Disclaimer:
This is my personal analysis and not financial advice.
Always confirm your entries and manage your risk properly before executing any trade.

Gold (XAU/USD) Analysis – October 23Gold (XAU/USD) Analysis – October 23: Bulls Eye Key Breakout Levels Above 4180
Gold has shown a steady recovery after last week’s aggressive sell-off, now consolidating just below the 4,180 USD resistance level. The current structure suggests that buyers are slowly regaining control, but a confirmed breakout is still needed before a stronger bullish leg can form.
Technical Overview:
Trend bias: Neutral-to-bullish short-term as price forms higher lows on the 1H chart.
Key resistance: 4,180 (neckline of previous breakdown)
Next upside targets:
4,340 – 4,360 (first resistance zone, Fib 0.618 retracement)
4,520 – 4,560 (major supply zone, previous double-top region)
Support levels: 4,060 and 4,010 remain key areas where buyers previously defended strongly.
RSI: Recovered from oversold territory and trending upward, signaling improving bullish momentum.
EMA structure: Price is attempting to reclaim the EMA-50; a close above it would strengthen the bullish case.
Trading Scenarios:
Breakout-Buy Setup:
Entry: Above 4,185 (confirmed H1 close)
Targets: 4,340 / 4,520
Stop-loss: 4,120
Risk-to-Reward ≈ 1:3
Range-Sell Setup (if rejection occurs):
Entry: 4,170 – 4,180
Target: 4,050 – 4,010
Stop-loss: 4,200
Market Insight:
Gold remains highly sensitive to Fed rate-cut expectations and USD movement. A weaker dollar or dovish comments from the Fed could push gold beyond 4,180, opening the path toward 4,340+. Conversely, strong USD data may keep the metal trapped below resistance.
Keep an eye on the 4,180 USD zone — it’s the battleground between bulls and bears.
If you find this setup useful, follow for more daily strategies and live market updates.

What’s Happening with Beyond Meat (BYND) SharesWhat’s Happening with Beyond Meat (BYND) Shares
Beyond Meat (BYND) shares have been experiencing extreme volatility today, with price swings measured in hundreds of per cent — turning the stock into a textbook example of a meme asset. Here’s a brief overview of the situation.
Drop Below $0.50
Throughout 2025 (and in the preceding years), the share price of the plant-based meat producer had been locked in a long-term downtrend, reflecting its financial difficulties.
Facing a substantial debt load due for repayment in 2027, Beyond Meat restructured its liabilities — extending maturity to 2030 at a higher interest rate in exchange for issuing more than 316 million new shares. This dilution of shareholder equity was viewed as a deeply negative signal.
The market reacted instantly: BYND plunged to point A, falling below $0.50 per share (a striking contrast to its peak above $200 less than five years ago). The steep drop also attracted a surge of new short sellers.
Spike Above $7
Spotting the low price and the high short interest (around 10.5% of total shares), retail traders began coordinating mass purchases through social media platforms. The result was a classic short squeeze, as forced short-covering combined with speculative buying propelled BYND above $7 per share (point B).
What’s Next?
Despite the spectacular rebound from point A to point B, the company’s fundamentals remain weak. Beyond Meat’s upcoming earnings report (scheduled for 4 November) may continue the trend of falling revenue — as seen in Q2 2025, when sales dropped by nearly 20% year-on-year.
The company is still loss-making, and high-profile partnerships — such as McPlant with McDonald’s — have yet to deliver meaningful results.
In the short term, market hype could push BYND towards the $10 psychological level, but it’s unlikely to change the broader picture. The company’s long-term outlook remains overshadowed by deteriorating financials.
This article represents the opinion of the Companies operating under the FXOpen brand only. It is not to be construed as an offer, solicitation, or recommendation with respect to products and services provided by the Companies operating under the FXOpen brand, nor is it to be considered financial advice.

BITF — Swing Trade Breakdown (TSX: BITF)🏢 Company Snapshot
Bitfarms Ltd. (TSX: BITF) is a Canada-based bitcoin mining and compute-infrastructure operator with facilities across Canada, the U.S., Paraguay, and Argentina.
The stock has gained attention recently due to surging crypto-mining sentiment and a sharp technical breakout.
📊 Fundamentals
BITF remains loss-making, making traditional valuation metrics less reliable.
P/E: Negative (no profits yet).
P/B: Around 4.2× — elevated for a miner still unprofitable.
Cash Flow: Negative; capex-heavy operations keep pressure on liquidity.
Balance Sheet: Recently announced large convertible notes (~US$300–500M), which could add dilution and leverage risk.
Dividend: None — this is a pure speculative growth play.
💡 Summary:
High-risk, high-reward exposure to bitcoin and compute infrastructure. Valuation remains stretched given negative earnings, but sentiment and momentum could override fundamentals in the short term.
📈 Trends & Catalysts
Revenue Growth: +31.8% YoY (FY2024: US$192.9M vs US$146.4M).
EPS: Still negative but improving (-US$54.06M vs prior year).
Cash Flow: Under pressure — analysts expect negative FCF ahead.
Balance Sheet: Leverage risk rising; capital raise adds short-term liquidity but long-term dilution concerns.
Catalysts:
Rebound in bitcoin prices and hash-rate efficiency.
Progress on compute/co-location diversification.
Technical breakout momentum and broader rotation into crypto-mining stocks.
Risks:
Bitcoin downturns or energy cost spikes can crush margins.
Regulatory tightening or dilution from new financing rounds.
Execution risk in scaling data/compute infrastructure.
🪙 Industry Overview
Crypto-mining equities have been volatile, tracking bitcoin sentiment closely.
Weekly: -20% (short-term pullback).
Monthly: +60%+ rebound for BITF amid rotation into miners.
12-Month: Volatile, underperformed broader markets.
Overall: Sentiment improving, but macro risk remains high.
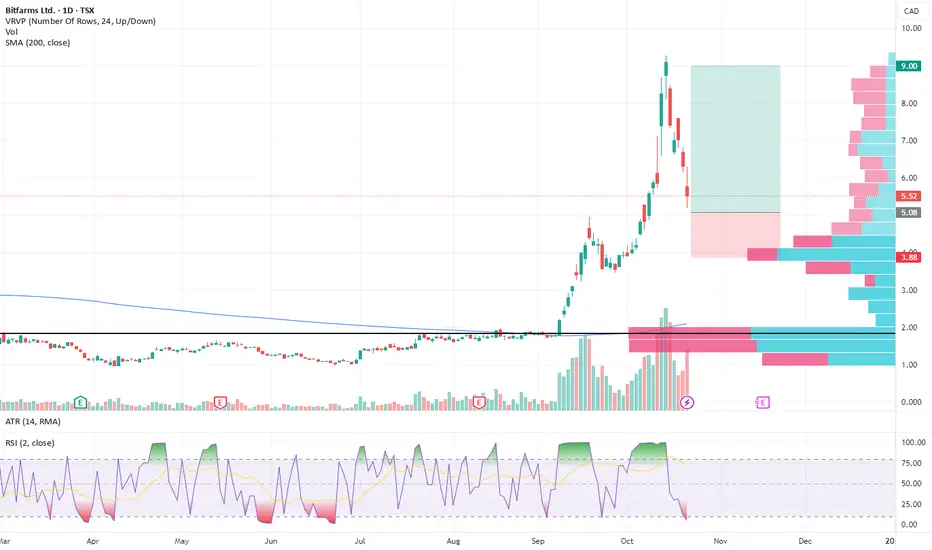
📐 Technicals
Price: ~CAD $5.52
50 SMA: ~CAD $3.63
200 SMA: ~CAD $2.09
RSI(2): 5.22 → deeply oversold, potential bounce setup
Pattern: Breakout toward ~$9.30 (52-week high) followed by pullback — potential bull flag or retest formation.
Support: ~$4.00
Resistance: ~$9.00
Volume: Strong recent uptick confirming trend continuation potential.
🎯 Trade Plan
Entry Zone: ~CAD $5.00
Stop Loss: ~CAD $3.85
Target Range: CAD $9.00 – $10.00
🧠 My Take
BITF offers a speculative swing setup fueled by crypto momentum and a bullish technical structure. It’s above key moving averages with strong volume confirmation, but fundamentals remain weak — this is not an investment, it’s a trade.
Use strict risk management, manage position size, and stay aware of bitcoin’s short-term price direction — it’s the main driver.
⚠️ Disclaimer:
This analysis is for educational purposes only and not financial advice. BITF is a high-volatility stock tied to crypto sentiment — trade at your own risk.
EURCAD: Retest Patiently waiting for a retest of the Daily FVG (1.61680) and if bullish, the following bullish pattern.
I like:
- Strong bullish uptrend on the daily.
- Pullback to 50EMA (not seen on this chart)
- Fall in crude oil prices
I don't like:
- Regular bearish divergence on daily TF
- A possible break of 1.61500

Gold facing pressure but still open for further surgeFollowing a recent rally, the gold price met significant profit-taking pressure. Prices reached a record high of 4381, signaling an easing of US-China trade tensions.
China confirmed trade talks with the US will occur tomorrow in Malaysia alongside the ASEAN summit. However, both sides are escalating tensions pre-talks to gain bargaining power, potentially complicating a final agreement.
Meanwhile, the prolonged US government shutdown, combined with a weakened Labor Market and a lack of data, has obscured the Labor Market's current situation. This uncertainty fueled market concern and drove investors toward safe-haven assets.
Concurrently, expectations place the US CPI at 3.1% YoY, accelerating from 2.9%. This increase raises stagflation concerns in the US economy, further supporting the gold price.
Technically, XAUUSD hovers slightly above the EMA78. Both EMAs are consolidating, signaling continued flattening momentum.
However, the long-term trend remains to the upside, suggesting investors may buy the dips amid the remaining uncertainty.

USD/JPY Analysis Potential Rejection Ahead Before Deeper DeclineThe USD/JPY pair has recently completed a rounded-top formation, signaling exhaustion in bullish momentum. After breaking below short-term consolidation, price is now retesting the lower support zone around 0.00654, which coincides with a previous liquidity pocket.
If buyers fail to defend this area, a short-term rebound toward the 0.00660 resistance is likely before the next bearish leg continues. This level also aligns with a key neckline and prior supply zone where sellers previously stepped in.
A confirmed rejection from 0.00660 could trigger a continuation move toward 0.00652 – 0.00650, forming a clean bearish structure. Traders should monitor price behavior closely at these levels for potential short entries on rejection signals such as bearish engulfing or break-of-structure patterns.
Key levels to watch:
Resistance: 0.00660
Support: 0.00654 and 0.00650
Trading plan: Wait for a retracement to 0.00660 to look for confirmation of bearish momentum before shorting. A daily close below 0.00654 will further validate the bearish continuation scenario.
Stay alert and follow for more daily technical updates and trading strategies.
Would you like me to also write the Vietnamese SEO version matching this post?

Can a $251 Billion Backlog Predict the Future?RTX Corporation has positioned itself at the intersection of escalating global defense imperatives and the recovery of commercial aviation, generating a formidable $251 billion backlog that provides unprecedented revenue visibility. The company reported strong Q3 2025 results with sales of $22.5 billion (up 12% year-over-year) and raised its full-year guidance, driven by double-digit organic growth across all segments. This performance reflects RTX's dual-market advantage: surging defense spending, with global military expenditure reaching $2.7 trillion in 2024 and NATO's new 5% GDP target by 2035, combined with recovering commercial aviation demand projected to exceed 12 billion passengers by 2030.
RTX's technological superiority centers on proprietary Gallium Nitride (GaN) semiconductor innovations that power next-generation radar systems, creating substantial barriers to entry. The company's LTAMDS radar delivers twice the power of legacy Patriot systems while eliminating battlefield blind spots, and the newly launched APG-82(V)X radar enhances fighter aircraft capabilities against advanced threats. Major contracts underscore this dominance, including a $5 billion Army award for the Coyote counter-drone system, which extends through 2033. RTX has committed over $600 million to manufacturing expansion this year alone, with the Redstone Missile Integration Facility expansion specifically targeting increased production of Standard Missile variants and counter-hypersonic solutions.
On the commercial side, Pratt & Whitney's GTF Advantage engine achieved EASA certification in Q4 2025, resolving earlier durability challenges with a design targeting double the time-on-wing compared to prior models. This breakthrough secures RTX's control over the A320neo and A220 fleets, guaranteeing decades of high-margin maintenance, repair, and overhaul revenue. Collins Aerospace's global network of over 70 MRO sites and flexible AssetFlex program capitalizes on supply chain constraints that force airlines to invest more heavily in fleet maintenance rather than new aircraft purchases.
The financial trajectory appears compelling: analysts project free cash flow will surge from $5.5 billion in 2023 to $9.9 billion by 2027, representing 15.5% annualized growth and compressing the price-to-FCF multiple from 31.3x to 17.3x. Wall Street maintains a consensus "Buy" rating across thirteen covering firms with zero sell recommendations. RTX's 60,000-patent portfolio, built on $7.5 billion in annual R&D spending, spans advanced materials, AI, autonomy, and next-generation propulsion, creating a self-reinforcing cycle where investment drives proprietary technology that secures long-term government contracts. With an affirmed BBB+ credit rating and stable outlook, RTX presents a structurally sound investment thesis built on geopolitical necessity, technological moats, and expanding cash generation.

GOLD → Fundamental background boosts interest FX:XAUUSD is recovering after a correction, trading in the range of 4060-4120 amid geopolitical tensions and risks of an escalating trade war.
Key supporting factors: New threats from the US against China, which is responding with additional measures. Trump imposed sanctions against Russian oil companies, accusing Moscow of lack of progress on Ukraine. US inflation data (CPI) on Friday may cause volatility, although the Fed's rate cut next week is likely already priced in.
The meeting between Trump and Xi Jinping next week remains uncertain.
Gold remains a safe haven, but near-term dynamics depend on the balance between dollar strength and geopolitical risks.
Resistance levels: 4116, 4163, 4200
Support levels: 4082, 4060, 4002
A retest of support at 4082-4060, as well as a breakout of resistance at 4116, could trigger a bullish reaction—a rise to the resistance level or imbalance zones. Against the backdrop of the escalating trade war, gold is becoming attractive again.
Best regards, R. Linda!

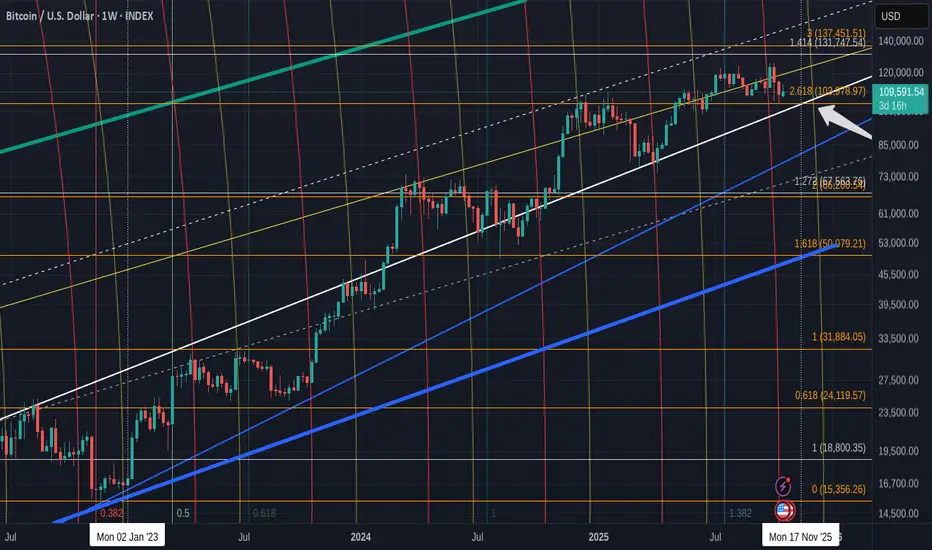
BITCOIN Weekly chart shows strength with potential to extend
This chart is one of my oldest and most trusted charts.
Thhis main chart is Weekly and from the end weeks of the Bear in 2022. You can see wre January 2023 is marked and so we can see the rising channels that developed.
The Blue Bold line is a Long term line if support from 2013 that we may never visit again.
There are 2 lines I want to draw your attention to.
The rising bold White line that acted as strong resistance in August 2022 and was turned in to Support in early 2024.
It has been strong support ever since.
The other is the 2.618 Fib extension ( Arrow ).
This line was resistance in early 2025 and remained so until crossed in around June this year.
It has been support ever since.
PA is heading towards the intersection of these two lines in Mid November ( around 17th ). PA could react before this date but it is very possible that PA will rise to a new ATH from this point.
The 2.618 Fib was tested recently in that Sudden Drop and we can see this on the daily chart below.
See that last wick down ? For me, the fact that this Snowballing liquidation was stopped by that line, shows massive strength of support there.
We can also see that rising line of support worked well in April this year.
These are 2 very strong lines of support and PA is above both of them and heading to the intersection of the two in November.
But what supports this idea further ?
The Weekly RSI is in a zone that previous occasions have bounced from, though it could fall a little further, giving a delay in PA rising.
November 17 is just over 3 weeks away. We may see RSI rise, Dip, rise
The weekly MACD also offers some insights
The weekly MACD is dropping bearish and its projected line till it reaches support is around end of November. Later than the 17th November
The Daily MACD may show us the idea of a bounce for the short term
MACD is turning up from OVERSOLD but we need to see what happens over the next few weeks closely. The idea that a short term Bounce in the Daily MACD also supports the idea of the RSI bouncing up down up, as mentioned above.
Something that I do find very interesting is the change in MVRV this cycle.
I have never seem MVRV rising in a channel like this and what is more interesting is how the Z Score ( yellow ) has bounced off the lower trend line twice previously.
And it is heading towards that line again, with a projected Touch around 27 November.
SO, all in all, we have Bitcoin Above Strong Support, heading to a point of intersection that has the potential to push PA higher.
That push could then be supported a little after with strong support from Technicals.
This may Push Bitcoin PA in a sustained rise with next major resistance levels at 137K
We need to get above and Hold that level.
BUT, as ever, MACRO could take over and we have, next week, the FED interest rate decision.
However, NOVEMBER is the focus here.
The Federal Reserve does not have a scheduled FOMC meeting in November 2025. The next meeting after October 28-29, 2025, is scheduled for December 9-10, 2025
This could be VERY INTERESTING Q4
Stay safe
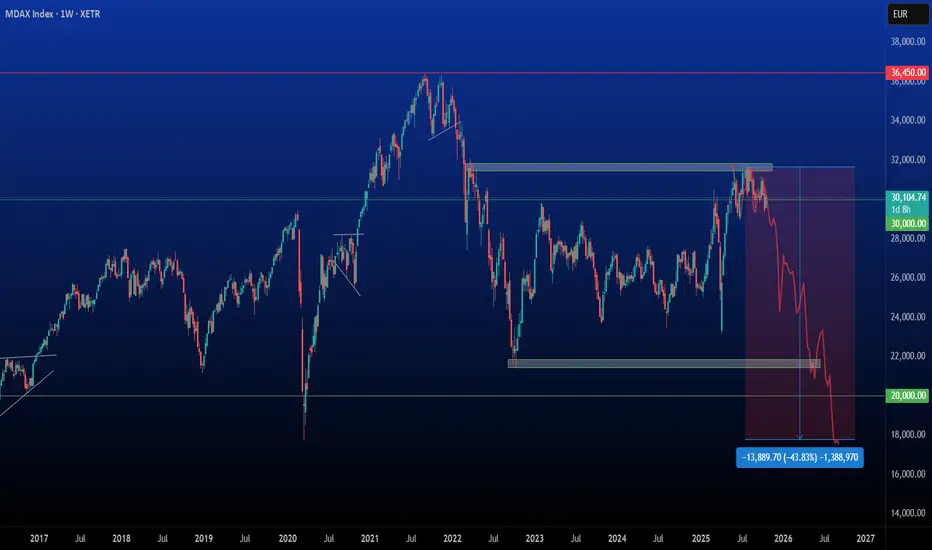
MDAX: Recession Fears and Tariff Risks Weigh on German Mid-CapsAs we approach the end of 2025, it has become increasingly clear that the German economy is flirting with a mild — and possibly deeper — recession. Recent data confirm the slowdown: Germany’s Manufacturing PMI remains stuck around 47.2, signaling continued contraction in industrial activity, while exports and industrial orders have yet to recover from the post-pandemic plateau.
Mid-cap German companies, which dominate the MDAX, are particularly exposed to these headwinds. Their earnings are under pressure from weak global demand, persistently high energy costs over the past three years, and renewed trade-policy uncertainty under the Trump administration. Should the U.S. impose higher tariff rates on European goods — similar to those previously applied to China — Germany’s export-oriented industrial base could see further margin compression.
Meanwhile, China’s strategy of redirecting exports from the U.S. toward the EU and other markets may create deflationary pressures in Europe as import prices fall and domestic producers are forced to adjust. Combined, these forces could weigh heavily on profit expectations and sentiment toward German mid-caps through 2026.
Technically, the MDAX appears to be encountering strong resistance at current levels and may remain range-bound toward the lower end of its 2025-2026 trading band. My medium-term target is a retest of the 2020 COVID-era lows. If Germany’s recession fears materialize more forcefully, the downside potential could extend even further.
UJ Long If Price Holds 152!FX:USDJPY has had an impressive rally since last weeks Low of 149.371 and that Low was supported by a touch of the 200 EMA with an immediate reaction that spells Bullish!
Currently, price is encountering some resistance from the Oct. 13 Highs in the 152.5 Area.
Now, If USD remains to be Bullish, we can expect Price to potentially drop from the Resistance Zone (if it is unable to break through) down to test the Break of Previous Structure in the 152 - 152.17 Area.
If Price finds Support there, it may deliver a Long Opportunity to take Price up into the 153.7 Area where Price will be expected to come in contact with Rising Resistance, seen on a Higher Time Frame! (Daily/Weekly)
Fundamentally, with CPI to be released on Friday with a forecast of higher inflation and the US Government shutdown with no real end in sight yet, could really impact what happens so stay vigilant!
* If USD loses strength, Price could fall below 152, changing the sentiment Bearish!

GBPUSD (SK)FPMARKETS:GBPUSD
Price is now retracing into a supply zone (BC area) that aligns with previous structure and moving average confluence.
A potential short setup could form from this zone if bearish confirmation appears, targeting lower liquidity levels below the (C) point.
The expectation is for price to reject the BC zone and continue the downward trend as indicated by the red arrow.
