XAU/USD – 1H Supply Zone Reaction | Possible Short SetupAfter a clean pullback from the recent low near $3,860, Gold is now approaching an important 1H supply zone (around $4,050).
The overall structure still remains bearish, with lower highs and lower lows dominating the chart.
🔍 Technical Outlook
Price approaching previous structure zone (potential supply).
Market structure: Bearish on both 1H and 4H.
Rejection from $4,050–$4,060 could trigger a short move back to $3,900–$3,860.
Setup invalid if 1H closes above $4,060.
💰 Trade Plan (Example)
Entry: 4,030–4,050
Stop Loss: Above 4,060
Take Profit: 3,900 → 3,860
🧠 Bias: Bearish
🎯 Watching for rejection confirmation from $4,050 zone before short entries.
#XAUUSD #Gold #Forex #TradingView #TechnicalAnalysis #PriceAction #SmartMoneyConcepts #Scalping #FXTrading #GoldAnalysis
Fundamental Analysis

Ethereum Market AnalysisEthereum Market Analysis
Introduction
Hello dear traders! In this analysis, I have updated the status of the popular Ethereum chart
In the previous analysis, for Ethereum on a long-term basis, we identified the CHoCH (Change of Character) trend change with precision and specified the best buy zone. { Ideal time to buy with Confirmation }. According to our forecast, after the price enters the buy zone, the market moved up to the main target, which was the old high. Now this is a daily analysis and it shows us the small upward steps. My analysis is very simple and straightforward, and there is no need for further explanation. If the CHoCH trend changes in the daily analysis, I will present a new analysis to you. Wishing you success and enjoy.
Wishing you all success!
Fereydoon Bahrami
A retail trader in the Wall Street Trading Center (Forex)
Risk Disclosure:
Trading in the cryptocurrency market is risky due to high price volatility. This analysis is solely my personal opinion and should not be considered financial advice. Please do your own research. You are responsible for any profits or losses resulting from this analysis.

Are you ready for a $BTC next leg?Bitcoin is preparing for a new upward wave towards the resistance zone, reacting to the rising wedge-on-uptrend formation.
This structure often signals a decisive moment after recent momentum.
The reaction to the resistance line will determine the next trend direction.
Staying on top of the trend is crucial during this period.

Front run or discount prices - ETH weekly update Oct 27 - 02ndDear traders and investors,
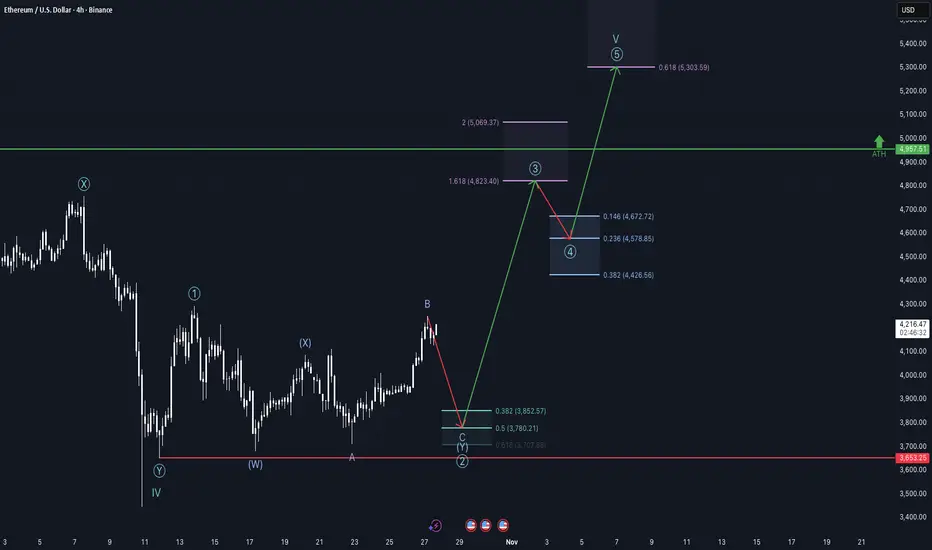
I firstly want to mention that everyone who took that last weeks trade, it is now time to close it or, if you want to take on more risk, you can hold through the next descending phase where you could get stopped out. But lets get into the analysis.
As I mentioned in todays Bitcoin analysis, the macro environment is currently bullish. We have a rate cut coming in on Wednesday with a high probability and lower than expected CPI on last Friday, leading to Powell being rather dovish than hawkish but still cautious. Trump is also signaling a tariff deal with China may be coming in soon. I do think this also has to do with his ambitions to lower the rates and tariffs may impact the inflation so he avoids more uncertainty.
Looking at the money flows, ETFs are receiving and inflows are looking like they are topping out right now. I think this is a typical behavior for a fifth wave, as institutionals are backing of from the market and using the late retailers as exit liquidity.
Moving on to market structure, it seems to be likely that this pump on Sunday was rather a overshooting wave B, than a actual impulsive move of the third wave. There is just to much lethargic in this move. In addition to that, funding rates rose to higher-than-normal highs and there is a bunch of liquidity forming under the current price. Therefore, the odds for longs getting liquidated rise. Alternatively, this is actually the third wave. If so, Ethereum should pump further without hesitation within the next few candles.
All in all, I would favor a short postion with stop loss at the high of the minor wave B or one percent above and the take profit at the 0.5 fibonacci extension level. This scenario is also in favored by Bitcoin, as I also anticipate a short-term drop. nonetheless be careful with short positions, we are in a bull market, the upside is overall in favor and shorts being liquidated is really easy right now. For people who look for a opportunity to buy in, the extension levels are all a good trade with stop loss at the low of the primary wave Y and take profit at the anticipated third wave or fifth wave high.
I hope i was able to give some value, have an exceptional successful week!
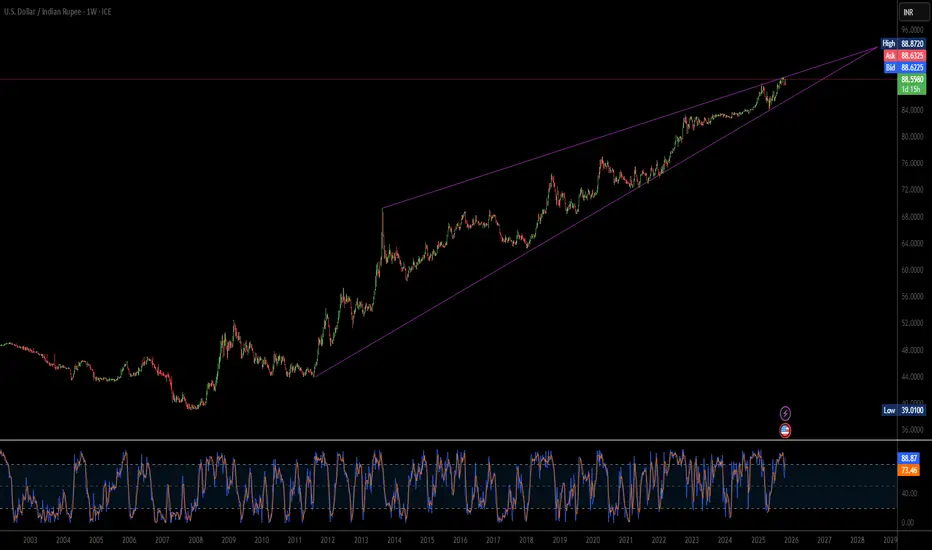
Why Is The Rupee Falling When The Dollar Is Weak?The Indian Rupee (INR) is exhibiting a pronounced, sustained weakness against the US Dollar (USD), pushing the USD/INR pair toward the 88.60 level, even as the global US Dollar Index (DXY) shows signs of softness. This resilience in the USD/INR confirms that domestic and structural headwinds—rather than external dollar strength—are primarily responsible for the Rupee's depreciation. A deep analysis across strategic, economic, and technological domains reveals that geopolitical delays and cautious monetary policy abroad are significantly outweighing any temporary relief from global dollar flows.
The central source of this structural weakness stems from two major factors: geopolitical uncertainty and macroeconomic policy divergence. The persistent delay in finalizing a comprehensive trade agreement between the US and India fuels Foreign Institutional Investor (FII) anxiety, leading to hesitant capital inflows. While FIIs showed a brief surge in buying, overall conviction remains low without a clear trade resolution. Concurrently, the US Federal Reserve's commitment to a "higher-for-longer" interest rate floor, despite a recent cut, strengthens the relative appeal of the USD. This policy stance attracts global capital to US assets, thereby limiting liquidity and increasing the cost of holding the INR.
Furthermore, India’s technological landscape adds to the structural demand for the USD. Low domestic Research & Development (R&D) investment and a heavy reliance on foreign patents mean the nation must spend more USD to import essential high-tech equipment and intellectual property. This technological deficit creates a persistent, structural requirement for foreign currency, putting continuous pressure on the Rupee. From a technical analysis perspective, the USD/INR pair's decisive hold above the 20-day Exponential Moving Average (EMA) confirms the market's bullish bias, suggesting the current trend is robust and targeting the all-time high of 89.12.
In essence, the Rupee's struggle is a complex interplay of internal and external structural factors. Until a major trade deal is confirmed, capital inflows become more decisive, or India's technological import needs stabilize, the market will continue to favor the USD. Traders must recognize that the technical path of least resistance for the USD/INR is upward, driven by these fundamental geopolitical and economic asymmetries rather than temporary movements in the global dollar index.
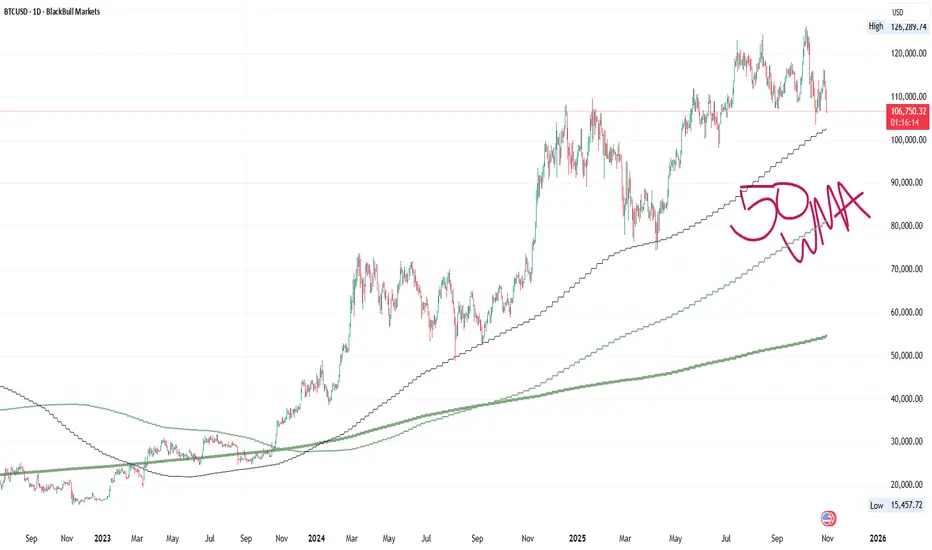
Bitcoin’s 50-week moving average could signal path to $150,000 Bitcoin has consistently held above its 50-week moving average since March 2023. Each time the market has attempted to break below, buyers have quickly stepped in, keeping the uptrend intact.
This moving average has become a key indicator defining Bitcoin’s broader bullish structure. As long as price remains above it, the focus potentially stays on new record highs, with the next major target projected between 140,000 and 150,000.
This outlook aligns with MicroStrategy co-founder Michael Saylor, who expects Bitcoin to reach $150,000 by the end of 2025. He described 2025 as the most transformative year yet for the digital-asset industry. According to Saylor, the $150,000 target also reflects the consensus among equity analysts covering both MicroStrategy and the broader Bitcoin ecosystem.

When Fundamentals Mislead — Only the Chart Tells the TruthGold Analysis – Special Weekly & Monthly Closing Edition
This report combines daily, weekly, and monthly charts to look beyond short-term noise — connecting technical, economic, and geopolitical factors for a broader perspective.
Economic & Geopolitical Highlights
1. Fed Rate Cut (-25 bps) — Neutral
The move was fully priced in; gold showed no bullish response.
2. Jerome Powell’s Press Conference — Bearish
He noted that a December rate cut is “no longer guaranteed,” cutting odds from 90% to 60%, weighing on gold.
3. Trump–Xi Meeting — Bearish
Talks were commercially positive, signaling tariff relief — reducing safe-haven demand.
4. Trump’s Comments on Nuclear Tests — Mildly Bullish
Even verbal tension keeps geopolitical uncertainty alive in the background.
Hot Topics Still on the Table:
Trump–Putin meeting in Hungary
Sanctions on Russian oil firms
New U.S. tariffs
U.S. government shutdown updates
In short — fundamentals remain highly unstable and reactive.
As I posted earlier on X:
“When Fundamentals Mislead — Only the Chart Tells the Truth.”
So, let’s see what the truthful chart has to say
Technical Analysis – Daily Chart
Current price: $4012
Gold trades below the 10-EMA ($4042) and 20-EMA ($4023) — both acting as near-term resistance.
The metal has stayed under the 10-EMA since Tuesday, Oct 21, repeatedly failing to reclaim it despite several intraday attempts.
Even the brief contact with the 20-EMA on Monday was rejected quickly, sending price lower again.
For now, gold is trying to retest the 20-EMA (4023).
The key question:
Will it manage to reclaim it, or is it preparing to visit the 50-EMA near $3852 instead?
Using Fibonacci retracements, potential correction zones appear between 3831–3701,
while Fibonacci expansions suggest 3785–3728 — roughly the same area.
These aren’t distant targets for gold, which has recently dropped nearly $400 in a single day — reminding us that “what flies too high often falls faster.”
Weekly Chart
10-EMA Support: $3870
20-EMA Support: $3670
The broader trend shows a retest of major support after a long bullish stretch.
Monthly Chart
High: $4381
Low: $3819
Range: $562
Midpoint (Key Pivot): $4100
October’s close will define the year-end bias:
Above 4100 → bullish continuation possible
Below 4100 → opens room for a deeper correction toward 3830–3700
As of now, gold is trying to hold above $4000, after hitting a weekly low at $3886 on Tuesday.
Support & Resistance Levels
Resistance:
4023 – 4030 – 4042 – 4100 – 4121 – 4144 – 4161 – 4381
Support:
3990 – 3961 – 3914 – 3886 – 3843 – 3831 – 3785 – 3728 – 3701 – 3670 – 3645
Trader’s Note – Before the Weekly & Monthly Close
Avoid emotional trades before the weekend or a major monthly close.
Long positions: watch 4040–4100 as a heavy resistance cluster.
Short positions: trail profits near 3870–3830.
Print these levels and keep them beside your screen — risk management matters more than prediction.
Disclaimer:
This analysis is for educational and informational purposes only and does not constitute trading advice.
Market conditions can change rapidly with new data or headlines.

Day 59 — Trading Only S&P Futures | +$142 & Netflix Split Recap & Trades
Day 59 — started off strong shorting 6930 resistance right out the gate.
Those early plays hit perfectly, and I built up about +$300 in profit.
Later, I got a little greedy — took a risky end-of-day setup, got stopped out right before a recovery, and ended up finishing at +$142.
Could’ve been a bigger day, but I’ll take a green close any time I stick to the plan.
Lesson & Mindset
Sometimes the best win is walking away with discipline intact.
Once you’re up early, your focus should shift from “how much can I make” to “how well can I protect it.”
That mindset compounds long-term consistency.
News & Levels
Big market story today — Netflix just announced a 10-for-1 stock split.
Tomorrow’s levels: Above 6920 bullish, below 6875 bearish.

GBPUSD Extends Bearish Momentum After Structure BreakGBPUSD remains under bearish pressure after a clear break of the structure from the 1H resistance area. Price action shows a potential short-term retest before continuing lower toward the support zone, signaling sellers’ dominance in the market.
Key Levels:
Sell Entry: 1.3195
Take Profit: 1.3129
Stop Loss: 1.3242
Reasoning:
Technically, the pair has confirmed a downside structure break with consistent lower highs, indicating momentum in favor of sellers. The 1H chart shows price rejecting the resistance area and forming a bearish continuation setup.
Fundamentally, the British Pound remains weak amid concerns over slowing UK growth and firm U.S. dollar demand supported by steady Treasury yields and hawkish Federal Reserve outlook. This continues to weigh on GBP/USD sentiment.
Disclaimer:
This analysis is for educational purposes only and not financial advice. Always manage risk and follow your own trading plan before executing any trade.

Pour Yourself A "Cup" of Cola, Grab A Share of KONYSE:KO has made a 61.8% Fibonacci Retracement of the Low @ $60.62 to the High @ $74.38 and begun to form what looks to be a Cup and Handle Pattern!!
On Wednesday, Price on NYSE:KO managed to Confirm the Pattern by reaching the Equal High of $71.61, completing the "Cup".
Now based on the Cup and Handle Pattern, we want to see Price make a Retracement to form the "Handle" of the Pattern and currently Price on NYSE:KO is falling. We can expect Price will Close the Gap from Last Week and find Support at the 50% Fibonacci Level @ $68.48.
Once the Retracement is successful, we should see Price move up to Complete the "Handle" and Pattern altogether!
Fundamentally, NYSE:KO CFO, John Murphy, plans to make changes to products with affordability in todays economy in mind for both High and Low income earners.
www.tradingview.com
NYSE:KO also posted greater than forecasted Earnings for Q3 this year!
www.tradingview.com
If Technicals and Fundamentals can align, NYSE:KO may be a great company to get stock in soon!

Bitcoin Daily Analysis – October 30, 2025🚀 Welcome to another Bitcoin analysis!
Yesterday, the interest rate was cut by one step, just as everyone expected — and that’s definitely a positive signal for Bitcoin. 💪💰
But why did we see a drop? 📉
The world is still anxious about the U.S.–China tariff situation, and those concerns intensified after Powell’s comments, suggesting the December rate cut isn’t guaranteed.
Right now, the market is in a fear phase 😨 — meaning both good and bad news can move prices sharply.
Stay calm and patient, and don’t let the candles scare you. 🕯️🧘♂️
Overall, conditions still favor a bullish continuation, and unless major negative news comes from the U.S. or China, we could soon start the final leg of this uptrend. 📈🔥
The $106,000–$102,000 zone is showing strong demand, making it a potential entry area — but always manage your risk and capital wisely. ⚖️
Remember: every decision in this part of the market should follow your predefined scenario — never trade emotionally or react impulsively. 🧠💼
Disclaimer:
This content is for informational purposes only and does not constitute financial or investment advice. © DIBAPRISM
Larry D.Kohn

GBPNZD BUY!!Targeted an orderblock on the daily, price reacted nicely and is about to continue its rally to the upside

[EURNZD] Trade ideaLong opportunity on this pair after FOMC the move should be clean. Targeting the previous high and probably even higher next ...
Great Trade !

Ethereum Game Plan - TDLRKZ MODELEthereum Game Plan - TDLRKZ MODEL
📊 Market Sentiment
On 29/10, the FED lowered rates by 25BPS, as expected. However, Powell’s comments introduced uncertainty regarding another cut in December, stating that further policy moves depend on incoming data.
Interestingly, one FED member dissented, preferring no cut this cycle — a shift from September when all members supported easing.
Following the statement, rate-cut expectations dropped from 95% to 68%, prompting traders to take profits and hedge, creating a short-term bearish sentiment across markets.
Despite this, the mid-to-long term outlook remains bullish, given the broader liquidity cycle and easing policy bias.
📈 Technical Analysis
Ethereum is currently accumulating inside a well-defined range.
Price failed to sustain above the $4950 range high and has started retracing toward the HTF bullish trendline, a potential reaction zone aligning with prior liquidity pools and confluences.
If price holds around this zone, ETH could seek the range high again once momentum returns.
📘 Model in Use – Trendline Deviation with HTF LR into Key Zone (TDLRKZ Model)
This model identifies setups where price deviates from HTF trendlines while interacting with liquidity zones and key structural levels.
The goal is to align HTF context with LTF confirmation for high-probability trend continuation setups.
Model Steps:
1️⃣ Identify the HTF trend direction and only trade in that direction.
2️⃣ Mark the HTF bullish trendline supporting price.
3️⃣ Spot HTF Key Zones likely to act as reaction areas.
4️⃣ Locate nearby liquidity pools or order concentrations.
5️⃣ Wait for confluence: when all align, confirm with a 4H market structure break for entry.
📌 Game Plan
Looking for ETH to retrace into $3350 and reject from that level.
If a 4H break of structure occurs and daily candle closes above $3350, this will trigger a long-biased setup.
🎯 Setup Trigger
→ 4H structure break after tagging $3350
→ Daily close above $3350
📋 Trade Management
→ Entry: After confirmation above $3350
→ Stop Loss: Below swing low that caused 4H break of structure
→ Targets:
TP1: $4150 (EQ)
TP2: $4550
TP3: $4950 (Range high)
→ Move SL to breakeven after TP1 is reached.
💬 Check my Substack for deeper macro and sentimental breakdowns — free subscriptions are open.
⚠️ Disclaimer: This content is for educational purposes only and does not constitute financial advice. Always DYOR before trading.

Capri Global - Triple Engine Growth storyDear Readers,
This is a pure Techno- Funda story, Firstly, coming to fundamentals, Yesterday company published results of q2 FY-2026. Generally, for an NBFC , I look for the growth in AUM followed by the quality of the book, ROE, and the most important thing is the credit cost and finally which we all see is the bottom line that is PAT. I was surprised to see ROE at 16%, a sequential growth in AUM and the important thing credit cost is down sequentially, QoQ and YoY.
So what led me to call this triple engine? here are some of the reasons.
1.Mangement in the month around June had raised around 2000 crores via preferential issue, this was done to enhance lending capabilities and to dispose debt around 650 crores from the book. As per monitoring agency report, the money stands UTILIZED.
2.So far, I had been tacking stock since last 2 qtrs for its cheapness( Discount) in the stock, but so far stock was not moving anywhere and it was sideways, But now there are green shots with respect to clarity from management, it seems like they had already Walk the Talk and they are on the road to achieve 50k AUM by 2028 ( currently as on Q2 2026 - 26k).
3.Historically, An NBFC growing by 35% was getting around price to book of 5-6. but Capri is trading around 3-3.2 Post Q2 results, suggesting significant discount on the stock.
Now, coming to Technicals, Stock has always been a slow mover in terms of volume and price action. but considering their life time highs around 290, Seems like stock is now ready for Next leg move and a proper and fit candidate for RERATING. I consider FIBONACCI as the Godfather of Trend estimation and certainly test levels in the future.
Lastly, I would say its a No brainer Stock from fundamental and technical point of view, from an Investor point of view, Risk to Reward Ratio is Favorable.
Disclaimer- Please consult your Financial Advisor before taking any position. I am not a financial advisor or expert . this is purely for the love of technofunda.

XAU/USD – Key Decision Point Before the Next Big MoveGold continues to consolidate below the major resistance zone at $4,060–$4,100, after a recovery from the $3,950 area. The market is currently testing an important structure level, and today’s reaction here will determine the next short-term trend.
Technical Outlook (H1 timeframe):
Immediate Resistance: $4,060 – $4,100
Major Resistance: $4,180 – $4,200
Support Zone: $3,950 – $3,900
Key Level to Watch: $4,000
If price breaks and holds above $4,060, bulls may gain momentum toward $4,150 – $4,200, forming a potential short-term continuation pattern.
However, a rejection below $4,060 could trigger another decline toward $3,950, and if that breaks, the next target lies near $3,860.
Trading Strategy:
Bullish Scenario: Wait for a confirmed breakout and retest above $4,060, then target $4,150–$4,200.
Bearish Scenario: Look for rejection signals at $4,060 or a break below $4,000 to sell toward $3,950 and $3,860.
RSI is showing a potential short-term overbought condition, so traders should remain patient and wait for price confirmation before entering.
Stay disciplined—gold is in a key reaction zone, and today’s close could define the next 2–3 sessions.
Follow for more daily gold trading strategies and updates.

WTICUSD: Post-Sanctions 5% Rebound Hints at 20% WTICUSD: Post-Sanctions 5% Rebound Hints at 20% Upside Amid Supply Constraints – SWOT, Price Action, and Intrinsic Value Insights
📊 Introduction
As of October 30, 2025, WTICUSD (WTI Crude Oil) is showing signs of a tentative rebound after recent volatility, rising 5% over the past week to trade around $60 per barrel on increased volume following U.S. sanctions on Russian firms like Rosneft and Lukoil.
This price action reflects a partial recovery from October lows near $57, amid viral social media discussions on supply disruptions (#OilSanctions trending with 600K+ mentions). Applying timeless investing principles to identify profitable setups, this highlights potential mispricings in the energy sector, driven by macroeconomic factors such as subdued global demand growth at 700 kb/d and Fed rate stability, while sector dynamics underscore WTI's role in U.S. production highs of 13.5 mb/d, though offset by OPEC+ cuts and oversupply fears.
🔍 SWOT Analysis
**Strengths 💪**: WTI's proximity to major U.S. shale basins enables efficient production with AISC around $45-50 per barrel per EIA data, supporting a resilient supply chain that has driven recent rebounds from $57 lows. High liquidity in futures markets (average daily volume 1M contracts) ties into strategies for capitalizing on quick asymmetry plays in volatile commodities.
**Weaknesses ⚠️**: Sensitivity to global demand slowdowns, with U.S. inventories up 5% YoY, has led to 10-15% price corrections amid forecast revisions, emphasizing the need for safety in cyclical assets.
**Opportunities 🌟**: Sanctions disrupting ~1 mb/d Russian exports and green energy transitions boosting industrial use position for 15-20% price surges on shortage signals, with metrics like forward P/Supply ratios offering re-rating potential to generate returns through market tightening.
**Threats 🚩**: OPEC's third demand cut for 2025 (to ~700 kb/d growth) and rising non-OPEC production could trigger further 10-15% pullbacks, as seen in recent dips post-forecasts, but proven principles aid in navigating for profitable outcomes.
💰 Intrinsic Value Calculation
Employing a value investing approach for commodities, we estimate WTI's intrinsic value using a weighted production cost and supply-demand premium model, incorporating a margin of safety as emphasized in classic methodologies to ensure actionable, money-making insights. Key inputs from EIA and IEA data: AISC ~$48 per barrel, global surplus forecast ~0.5 mb/d (reversed to deficit under sanctions), assumed growth rate 10% (based on industrial demand CAGR).
Formula: Intrinsic Value per Barrel = (AISC * Weight) + (Surplus/Deficit Adjustment * Growth Multiplier)
- AISC weighted at 0.6 for base costs
- Adjustment: -0.05 (mild surplus; negative for downward pressure), Multiplier: 15 (classic: 5 + 2*5, scaled for energy volatility)
Calculation:
(48 * 0.6) + (-0.05 * 15) = 28.8 - 0.75 = 28.05
Scaled to market comparables (e.g., historical Brent premium ~$5, adjusted for U.S. focus): Refined = 28.05 * 2.5 ≈ $70.13
Apply 20% margin of safety: $70.13 * 0.8 ≈ $56.10
At current ~$60 (post-rebound), WTICUSD appears fairly valued but undervalued by 15-20% to $70 on sanction-driven deficits—no debt flags, sustainability hinges on demand growth above 700 kb/d. 📈 Undervalued.
🚀 Entry Strategy Insights
Rooted in time-tested disciplines for compounding wealth, seek support zones at $57-58 (near recent lows and 200-day SMA) for unleveraged, long-term positions via dollar-cost averaging, entering on breakouts above $62 after 5-10% corrections from news events. Tie non-repainting signals to viral sanctions updates for profitable timing amid volatility.
⚠️ Risk Management
Size positions at 1-5% to preserve capital against energy swings, diversifying with renewables or bonds. Caution on 15-20% volatility from OPEC news; trailing stops 10% below entry (e.g., $54) ensure holds only on strong fundamentals, promoting sustainable profitability.
🔚 Conclusion
WTI's rebound on sanctions buzz, supply dynamics, and undervalued profile offer principle-driven paths to 20%+ gains via mispricings and safety. Key takeaways: Track deficit forecasts for upside, verify EIA data independently. Share your thoughts in comments – does this sanctions news shift your view?
#ValueInvesting #CrudeOil #EnergyMarkets #WTICUSD #CommodityTrading
This is educational content only; not financial advice. Always conduct your own due diligence.

Update on Bearish continuationPlayed out as analyzed in my previous post.
Depending on your style of trading, patience should be the #1 rule.
Furthermore, we should be looking for a LH now, breaking 1.1547. Then look that we get a liquidity sweep back at 1.1586 for continuation to the downside. Wait for confirmation and manage your stop loss to the downside.

Gold 30 Mints Resistance Rejection SetupGold is showing signs of weakness after retesting the 30-minute resistance area, following a clear break of structure. The market currently respects the lower high formation, suggesting a potential short-term correction toward the support zone as sellers regain control.
Key Levels:
Sell Entry: 3980
Take Profit: 3950
Stop Loss: 4000
Reasoning:
Technically, the price has completed a structure break and is now retesting previous resistance, turning it into a new supply zone. Candlestick behavior shows bearish pressure, supporting a short setup.
Fundamentally, stronger U.S. dollar sentiment and cautious risk tone before upcoming U.S. data keep gold under pressure.
Disclaimer:
This analysis is for educational purposes only and not financial advice. Always manage risk and follow your own trading plan before executing any trade.

SELL USDCAD RIGHT NOWIm only think about share idea like memo my trade setup
how im thinking about market
Weekly commercial is still bullish
Downtrend is dominance in daily chart
H12,H4 price is up by new release
After new
Sell drop base drop is good trend following set up

FI: The Contrarian Bull Case – Buying the 40% DropValuation Reset and Overreaction: The market's 40%+ punishment may have overshot the fundamental impact of the guidance cut. The company is now trading at a much lower valuation multiple (P/E ratio), making it significantly cheaper than its historical average and key competitors. The deep sell-off may have priced in much of the negative news, establishing a compelling entry point for value-oriented investors near the recent 52-week low.
Durable Business and Secular Tailwinds: Fiserv remains a global leader in payments and financial technology, serving banks, credit unions, and merchants with mission-critical services (like the Clover platform). The long-term secular trends of digital payments and banking modernization are still intact and will continue to drive demand for Fiserv's core services.
Strategic and Operational Focus: Management is proactively addressing the operational missteps that led to the disappointment. The announced "One Fiserv" plan and the executive leadership restructuring are aimed at a "critical and necessary reset" to simplify the business, enhance client focus, and drive more sustainable, predictable growth in the future.
Analyst Consensus and Future Targets: Despite the flood of immediate downgrades, a substantial portion of Wall Street analysts maintain a "Buy" or "Hold" rating, with median 12-month price targets that suggest a significant upside from the current deeply depressed price.
Trade Idea:
Entry 1 (Green Arrow 1) Initial Position / Deep-Value Buy $67.00 – $69.00
Entry 2 (Green Arrow 2) Adding to Position / Confirmation $64 A second entry on a slight pullback
Exit (Red Arrow) Profit Target $83

BCHUSDT → Consolidation ahead of news. Target 600?BINANCE:BCHUSDT.P is consolidating above key resistance. Consolidation is forming ahead of news. Are the bulls in play?
Bitcoin is consolidating, trading above key support at 111650. News ahead, a positive outcome could support the market, including altcoins...
As for BCHUSDT, the coin is breaking through the strong resistance zone of 549.15 as part of a bullish trend and is forming consolidation in the range of 549-570. A liquidity pool has formed below 549. There is a high probability of a long squeeze before growth.
Resistance levels: 570, 600, 612
Support levels: 549.15, 533, 511.25
The market is bullish, which is clearly visible on the D1 timeframe. After a strong rally, the coin is entering a consolidation phase, which is forming above the previously broken resistance. A retest of support could trigger growth in the direction of the trend.
Best regards, R. Linda!
