$HYPER Near Demand Zone$HYPER is currently retesting its key support trendline after a steady uptrend.
If this zone holds, a rebound looks likely, but a breakdown could trigger deeper correction toward the S/R zone.
DYOR, NFA
Fxsignals

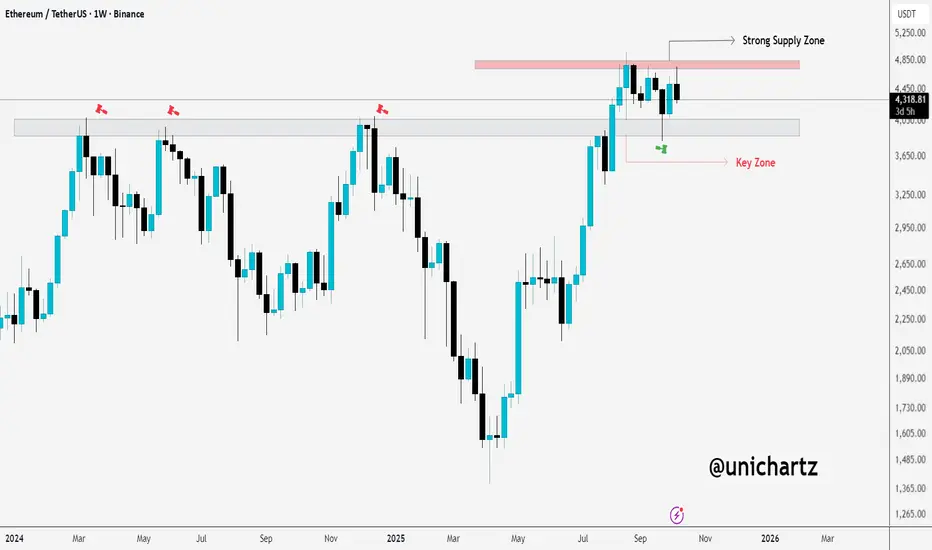
ETH: Critical Levels to Watch Now!The chart shows Ethereum ( CRYPTOCAP:ETH ) on the weekly timeframe, and we're currently at a crucial point. Ethereum is approaching a strong supply zone around $4,800, which has acted as a resistance level in the past. This suggests that the price could face selling pressure in this range. If Ethereum fails to break through this level, it might experience a pullback or sideways movement.
On the other hand, the key zone around $4,100 is providing current support. As long as this level holds, there is potential for Ethereum to attempt another move upwards toward the supply zone at $4,800. However, if the price breaks below this key support zone, we could see a deeper pullback, possibly targeting lower support levels.
#PEACE
Stay tuned for more update
AUD/USD 4HR Trendline Breakout Long Setup. Daily Continuation.I will be entering a long trade at the close of the current daily candle on AUD/USD.
Stoploss and take profit provided. With this one management will be if the market does not trade through the target area by daily candle close on Thursday then I will close the trade manually.
Simple trading execution and plan.

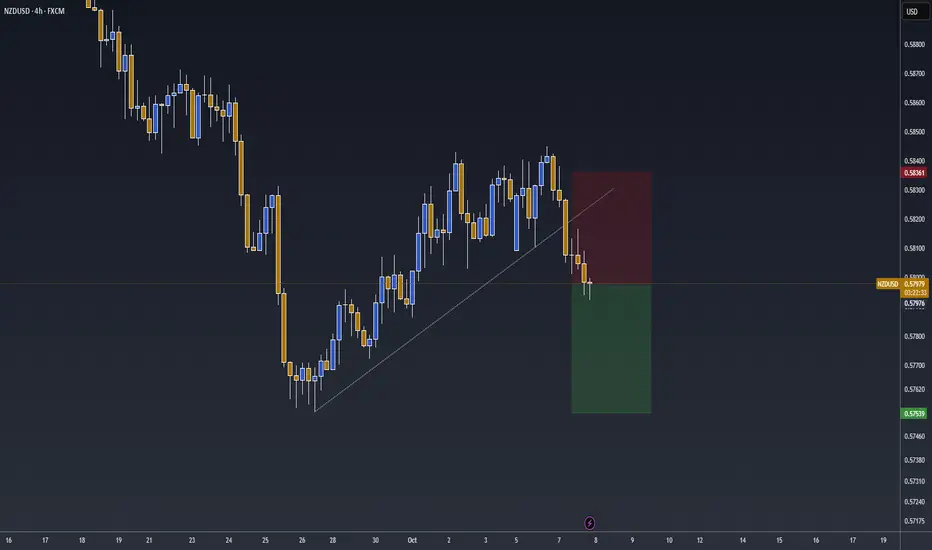
Trend Line Breakout 4HR. Daily Candle Continuation.Simple breakout pattern on the 4HR timeframe.
For this trade idea I will be holding till the end of new york session trading hours expecting movement to the downside.
Simple Trading Idea.
ADA Multi-Year Downtrend Nearing EndCardano CRYPTOCAP:ADA is forming higher lows and looks ready for a big breakout once it moves above the red resistance line. Price is currently in the accumulation zone, which means smart money might be loading up here.
Plan:
Buy Zone: Between 0.75 and 0.88
Stop Loss: Below 0.66 (if it drops there, the setup fails)
Targets:
TP1: 1.09
TP2: 1.35
TP3: 1.70
TP4: 2.18
TP5: 3.10
Strategy:
Start with a small position here. Add more only after a confirmed breakout above 0.90.
Once the first target hits, book some profits and move your stop loss to entry.
Note:
This is a long-term setup, could take several months to play out. Always do your own research (DYOR).

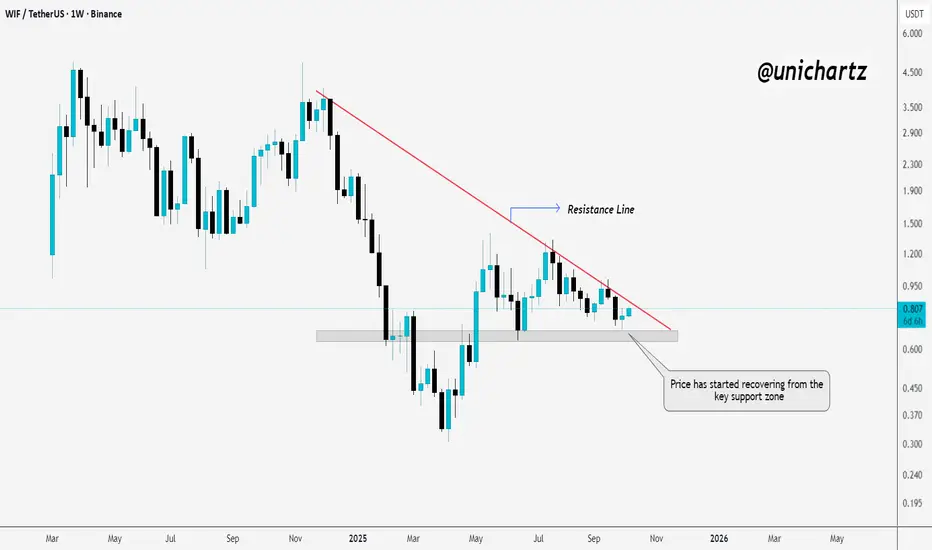
WIF Weekly Reversal SetupSEED_WANDERIN_JIMZIP900:WIF is showing early signs of strength after bouncing from the key support zone.
A breakout above the descending resistance line could confirm a fresh bullish wave.
DYOR, NFA
#PEACE
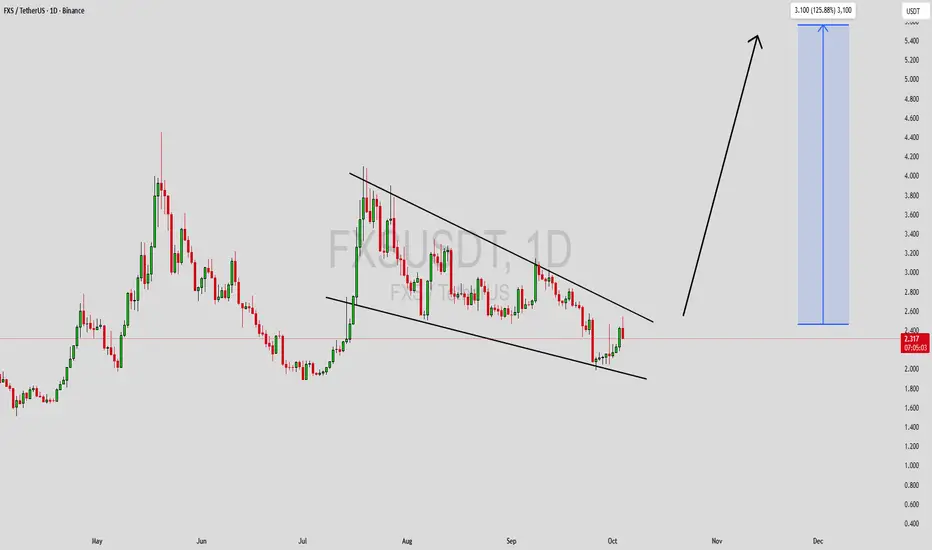
FXSUSDT Forming Falling WedgeFXSUSDT is currently exhibiting a falling wedge pattern — a classic bullish reversal signal that often precedes a strong price rally. This technical setup indicates that selling pressure is gradually weakening, while buyers are beginning to gain control. The compression of price within the wedge suggests an imminent breakout, which could lead to a significant upside move once resistance is breached. The good trading volume confirms growing participation, reinforcing the strength of this pattern.
With an expected gain potential of around 90% to 100%+, FXSUSDT is showing signs of strong bullish sentiment building up in the market. Historically, falling wedge breakouts are followed by sharp rallies as traders rush to catch the reversal momentum. If current levels hold and volume continues to increase, FXS could be preparing for a substantial breakout phase that captures wider market attention.
Investors have been gradually accumulating positions, showing growing confidence in the future potential of this project. The combination of technical strength, volume confirmation, and increasing investor interest makes FXSUSDT one of the promising setups to watch closely in the current crypto market environment. Traders looking for breakout opportunities may find this setup particularly attractive in the days ahead.
✅ Show your support by hitting the like button and
✅ Leaving a comment below! (What is You opinion about this Coin)
Your feedback and engagement keep me inspired to share more insightful market analysis with you!
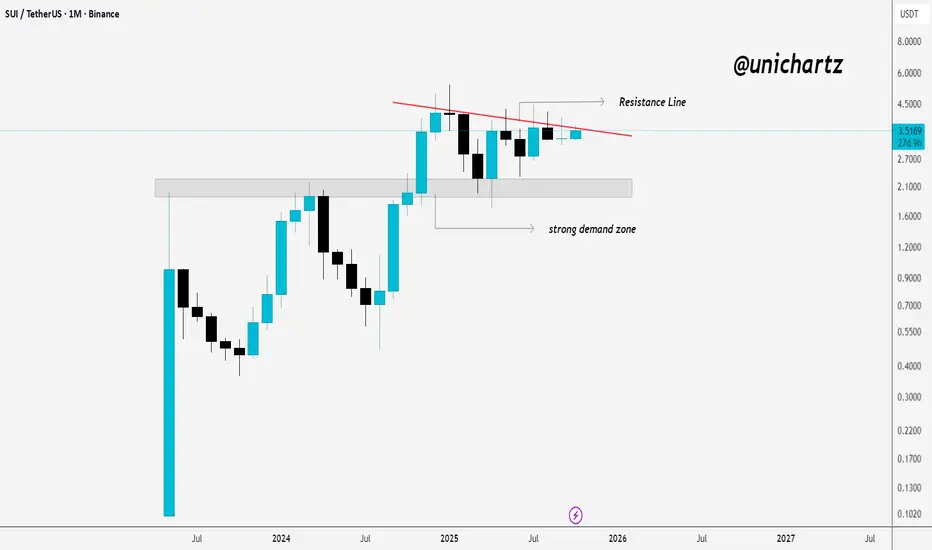
SUI Testing Monthly Resistance$SUI/USDT Monthly Chart
SUI is holding firm above the demand zone near $2.2, showing solid buyer interest. Price is now testing a descending resistance line that has capped previous rallies.
A monthly close above $3.8–$4 would signal a potential breakout and shift momentum toward the $5 zone. Until then, pullbacks to the demand area remain healthy for accumulation.
DYOR, NFA
$PUDGY: Watching for Flag Breakout
The CSECY:PENGU is still contained within the flag pattern, following a strong rally. While there’s upward momentum, the breakout hasn’t fully occurred yet.
Key points:
Resistance: Watch the 0.032 area as the flag's upper boundary. A breakout here could confirm a continuation of the bullish trend.
Support: The 0.026 support zone remains crucial. If price holds here, it could set up for another push higher.
For now, the price is stuck in the flag pattern, with the breakout above resistance being the next key move.
Follow us and stay tuned for more updates.
#PEACE
DYOR, NFA

SOL: Ready for a Big MoveWe can see CRYPTOCAP:SOL is currently in a period of accumulation, just like it was back in 2021 before a massive rally . The key rising support line has been holding up strong, and after periods of accumulation, the price has consistently exploded upwards, reaching new highs.
Right now , the price is approaching its previous all-time high (ATH), and if history repeats itself, we could be in for another "boom" phase. The price is holding well above the key support, which strengthens the bullish outlook.
Keep an eye on the price action around the ATH level, if we break through, it could signal the next major leg up. This setup looks very similar to past accumulation phases that led to significant price jumps.
#PEACE
Stay tuned for more updates

BNB Soars Above Key SupportLooking at this $BNB/USDT chart, here's a more concise breakdown:
Rising Support: The red line shows a strong support level that has held up since 2018, with the price bouncing off it several times, confirming its importance.
Accumulation Zone: Between 2020 and 2021, BNB traded sideways, building up buying pressure before the next move.
Breakout: After the accumulation phase, BNB broke out sharply, signaling the start of a strong upward trend.
Current Trend: The price is now above the rising support line, and the bullish momentum seems to be continuing, suggesting further potential upside.
In short , BNB is in a solid uptrend, with a key support line holding strong. The breakout indicates more gains ahead if the trend continues.

Price Poised for Bullish Flag Surge!$XRP/USDT chart shows an accumulation phase from April to June, followed by a breakout in July. Price is now testing a key zone, acting as support. If it holds, we could see more bullish momentum, especially with the triangle breakout. A break above 3.20 signals further upside.
If not, a retest of lower levels like the accumulation zone is possible. Watch for confirmation at this level.
DYOR, NFA

ETH Retest Done – ATH SoonEthereum has pulled back perfectly into its key resistance-turned-support zone and held strong. This successful retest is a healthy sign for the trend, showing buyers are stepping in to defend the level.
If momentum builds from here, CRYPTOCAP:ETH could gear up for another big leg higher toward new highs.
Stay tuned.
DYOR, NFA
Follow us for more market insights and daily updates on Tradingview.
#PEACE ✌

Bitcoin Roars Above $120K, ATH on the RadarBitcoin just blasted through resistance and is charging straight toward its all-time high.
The beast is alive and moving with power. 🚀
#PEACE

MYX: History Repeats – Will We See Another Boom?LSE:MYX has been following a clear accumulation pattern, with a sharp rally after each phase. Currently in a similar setup, the price is consolidating, and if history repeats, we could see another breakout soon.
Keep an eye on this, as the next move could be significant.
DYOR, NFA
#PEACE

GBPUSD Short/Sell SignalThoughts and Analysis: Sterling’s running out of gas, plain and simple. My chart analysis is screaming weakness due for a short and we’ve got a classic rejection at the 1.346–1.350 zone, the kind of level that turns dreamers into bag-holders. Price lost the short-term moving average and can’t reclaim it. Sellers are defending that ceiling, and unless the market rips clean through it, the path of least resistance is down first to 1.3200, then to the psychological 1.3000 line in the sand.
GBPUSD Fundamentals: They’re pouring fuel on this fire. The dollar’s got wind at its back with U.S. growth and spending numbers keep defying gravity, pushing out rate-cut expectations and keeping Treasuries bid. Across the pond, the UK’s looking shaky: inflation refuses to die, the BoE’s stuck in a corner, and gilt yields are exploding like it’s 2022 all over again. Recent U.S. data revisions and spending figures have shown resilience (upgraded Q2 GDP and stronger consumer spending) which has supported the dollar recently and made Fed rate-cut expectations more cautious. A stronger dollar or higher UST yields is a direct headwind for GBPUSD. Positioning only sharpens the knife. Big boy desks are leaning bearish with Nomura and others are calling for a slide into the low-1.30s. When the smart money’s already stacking chips on the short side.
Key support zones: TP1 is set at 1.3200 lines up with a prior congestion/swing area (previous rejection / swing low), and TP2 hovering at 1.2998–1.3000 is a psychologically and structurally important zone (round number + prior multi-touch support area). Those are reasonable first targets if momentum continues.
Momentum confirmation: short-term oscillators on this sort of price action tend to stay bearish while the shorter MA is resistance and price closes under it; OANDA/desk technical notes have recently highlighted similar short-term bearish bias and 1.3315–1.3280 as next pivots.
So here’s the trade: short the rejection, stop just above 1.3475, let the first leg bleed into 1.3200, and ride the momentum to 1.3000 if the floor gives way. That’s a clean two-, three-to-one reward profile. Don’t overcomplicate it. The story is simple: sterling’s tired, the dollar’s strong, the bond market’s flashing red, and the technicals are setting up a textbook short.

BTCUSD Short/Sell SignalBitcoin (BTC/USD) – Tactical Short/Sell Positioning Framework
From a technical perspective, Bitcoin is currently presenting a compelling short-side opportunity as the structure unfolds. After multiple failed attempts to sustain momentum above the $110,000 handle, price action has carved out a sequence of lower highs and retests of the same horizontal zone, a classic sign of weakening bullish conviction and potential distribution at elevated levels.
The current chart reveals several critical dynamics:
1. Stop-Loss Placement (Risk Management Discipline)
A prudent protective stop (SL) I have set at $112,800, just above recent resistance. This ensures adverse upside volatility is capped while preserving favorable risk-to-reward asymmetry.
2. Initial Breakdown Trigger
Bitcoin’s repeated interactions with the 200-day moving average highlight the significance of this level as both psychological and structural support. A clean break beneath it could catalyze accelerated downside flows, inviting systematic selling and liquidations.
3. Downside Targets (Profit Objectives)
Take Profit 1 (TP1): $100,070
This marks the first tactical support level, aligning with prior consolidation and offering a conservative initial profit capture.
Take Profit 2 (TP2): $89,566
A more ambitious level, representing the mid-range support where prior accumulation took place. A breach of this zone would likely confirm a broader bearish continuation pattern.
Take Profit 3 (TP3): $76,193
The ultimate downside objective in this framework, corresponding to deep structural support. Achieving this would imply a full retracement of the bullish leg initiated earlier in the year.
4. Strategic Interpretation
This sequence of measured downside targets aligns with a tiered scaling-out methodology, ensuring that profits are progressively locked in as price declines. Such an approach maximizes capital efficiency while allowing flexibility to ride the broader bearish trend should momentum persist.
My Conclusion
The technical confluence of repeated resistance rejection, weakening market structure, and clear downside liquidity targets positions Bitcoin as a sophisticated short candidate at current levels. Risk is well-contained above $112,800, while downside projections toward $100K, $89.5K, and ultimately $76K create a compelling asymmetric opportunity.

Ethereum’s $4K Battle: What's Next?CRYPTOCAP:ETH is currently retesting a strong support level on the weekly timeframe, previously acting as resistance, around the $4,000 mark.
If Ethereum holds this support, we could see a potential bounce back towards higher levels. However, if the price fails to hold, further downside may test lower support areas.
This could be a pivotal point for Ethereum’s next move, so monitoring this zone is essential for short- or long-term strategies.
DYOR, NFA
#PEACE

Corrections Are Temporary, Bullish Trend Is NotWhile the price is correcting now, it's important to remember this is likely just a healthy consolidation before the next move up. The overall trend is still bullish, with higher highs being made over time, even through corrections.
So, don't let short-term dips cloud your judgment. Focus on the long-term trend, as these corrections can present opportunities to accumulate at key support levels.
Stay tuned for more updates
#PEACE ✌

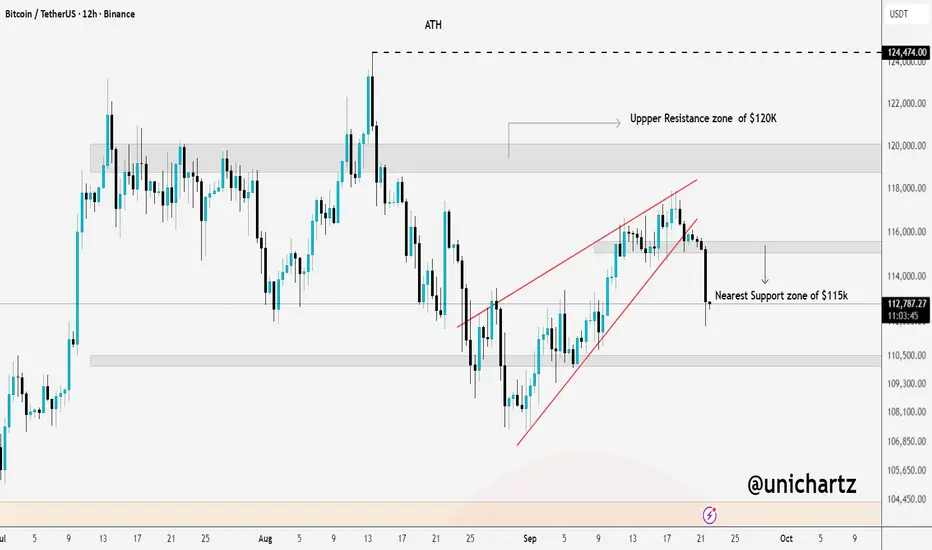
BTC Testing Critical Levels: Will $110K Hold the Line?What we said earlier, I hope many of you are safe.
CRYPTOCAP:BTC has broken down from the rising wedge and already sliced through the $115K support zone. The next major level to watch is the psychological support at $110K. If buyers defend that area, the market could stabilize, but if $110K fails, we’re looking at a deeper correction ahead.
In short: $115K is gone, $110K now becomes the crucial line in the sand.
OMNI: On the Brink of a Breakout$OMNI/USDT is still a good distance from the key resistance line, but it's approaching an important zone around $4.25. If the price can break through and hold this level, we could see further bullish movement.
However, if it struggles at this level, a pullback or consolidation might follow. Keep an eye on how it reacts as it gets closer to that resistance.
DYOR, NFA
#PEACE

ETH Awaits Fed Decision, High Volatility AheadCRYPTOCAP:ETH Update
Back on August 21, when news broke about a possible Fed rate cut on September 17, ETH instantly jumped nearly 14%. Fast forward to today, the actual announcement is scheduled for 2 PM ET, and the market is on edge.
There’s a strong probability of a rate cut, which could inject fresh momentum and push ETH higher. But if the Fed keeps rates unchanged, we could see a sharp downside correction as risk assets react.
Best approach right now? Stay patient. Wait for the full announcement from Powell, his tone will matter as much as the numbers. Extreme volatility is expected around that time, so caution is key.
DYOR, NFA
#PEACE

MANA Eyes 0.75 After Strong Bounce$MANA/USDT is bouncing from a strong confluence zone, where the support area lines up with the rising trendline. This reaction shows buyers are stepping in to defend the structure.
If momentum continues, price has room to push higher toward the 0.75 level and possibly beyond, as long as it holds above support.
In simple terms: the confluence bounce is a bullish signal, and upside targets remain in play if momentum stays intact.
DYOR, NFA
#PEACE
Stay tuned for more update - follow us on Trading View
