FraxShare: A medium-term position is seen FXSUSDT Trading Signal For
Trading Setup:
There is a Trading Signal to Buy in FXSUSDT FraxShare 4h (Futures)
Traders can open their Buy Trades NOW
⬆️Buy now or Buy on 2.411
⭕️SL @ 2.049
🔵TP1 @ 3.349
🔵TP2 @ 4.000
🔵TP3 @ 5.245
What are these signals based on?
Classical Technical Analysis
Price Action

FXSUSDT 1Wjust for fun. we still waiting for altcoin party. the weekly order block is appears just in the GATEIO. exchange.

#FXS/USDT is forming a bullish divergence in 4-Hour TF!#FXS/USDT is forming a bullish divergence in 4-Hour TF!
CRYPTOCAP:FXS will pump anytime from here, and the pump will be hugged. Added some in-spot bags too. The local resistance level is $3.11.
FXSUSDT UPDATE#FXSUSDT(Update)
Hey dear traders. Hope you are enjoying analysis with our team. we are here to analyze FXSUSDT today.
Descending Channel Formation in 1D time frame.
Incase of Successfull Breakout Expecting Massive Bullish wave📈🚀

FXSUSDT IDEAHello Traders Hope You Are Enjoying Our Analysis. Today We Will Discuss About FXS
(Update)
Trying To Breakout Trendline On 12H Chart☑️
In Case Of Successful Breakout Expecting Massive Bullish Wave

Short Position on FXS/USDTI am choosing to sell this token as it is under pressure.
Entry : 3.64
SL : 3.82
TP1 : 3.40
TP2:3.20
I am placing the SL just above the recent resistance level to protect against minor reversals and avoid getting stopped out by short-term volatility.

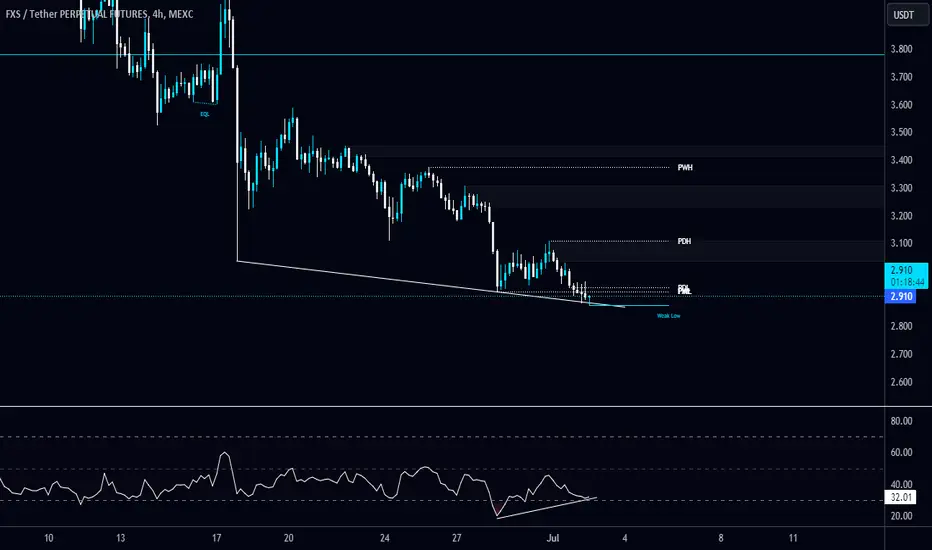
#FXS/USDT is forming a new low in Weekly TF!#FXS/USDT is forming a new low in Weekly TF!
I'm expecting a sweep below and then a reclaim above $3.78 as support. Wait for a sweep and reclaim to add some in spot and a long position in $FXS.

FRAX Finance - ATL - Opportunity ? or not.FRAX marketed as : The world's most innovative decentralized stablecoins and DeFi stablecoin infrastructure. The Frax ecosystem is a self-sufficient DeFi economy utilizing stablecoins as currency.
Frax -uses a principle similar to fractional reserve banking; gets well with stablecoins swaps

FXSUSDT UPDATE #FXSUSDT
UPDATE
Hey dear traders hope you are enjoying trading and analysis with our team. we are here to discuss about FXSUSDT
Falling wedge Breakout done & Retesting is in process ✅
Expecting 50% + profit 📈

Trading Signal For FXSUSDT Trading Setup:
A Trading Signal is seen in the FXSUSDT FraxShare (4h) (spot)
Traders can open their Buy Trades NOW
⬆️Buy now or Buy on 4.248
⭕️SL @ 3.82
🔵TP1 @ 5.5
🔵TP2 @ 6.7
🔵TP3 @ 9.0
What are these signals based on?
Classical Technical Analysis
Price Action Candlesticks Fibonacci
RSI, Movi

See all ideas
Frequently Asked Questions
The current price of FXS / TetherUS (FXS) is 2.300 USDT — it has risen 0.35% in the past 24 hours. Try placing this info into the context by checking out what coins are also gaining and losing at the moment and seeing FXS price chart.
FXS / TetherUS price has fallen by 11.61% over the last week, its month performance shows a 28.73% decrease, and as for the last year, FXS / TetherUS has decreased by 62.72%. See more dynamics on FXS price chart.
Keep track of coins' changes with our Crypto heatmap.
Keep track of coins' changes with our Crypto heatmap.
FXS / TetherUS (FXS) reached its highest price on Jan 12, 2022 — it amounted to 45.900 USDT. Find more insights on the FXS price chart.
See the list of crypto gainers and choose what best fits your strategy.
See the list of crypto gainers and choose what best fits your strategy.
FXS / TetherUS (FXS) reached the lowest price of 2.134 USDT on Jul 5, 2024. View more FXS / TetherUS dynamics on the price chart.
See the list of crypto losers to find unexpected opportunities.
See the list of crypto losers to find unexpected opportunities.
The safest choice when buying FXS is to go to a well-known crypto exchange. Some of the popular names are Binance, Coinbase, Kraken. But you'll have to find a reliable broker and create an account first. You can trade FXS right from TradingView charts — just choose a broker and connect to your account.
Crypto markets are famous for their volatility, so one should study all the available stats before adding crypto assets to their portfolio. Very often it's technical analysis that comes in handy. We prepared technical ratings for FXS / TetherUS (FXS): today its technical analysis shows the sell signal, and according to the 1 week rating FXS shows the sell signal. And you'd better dig deeper and study 1 month rating too — it's sell. Find inspiration in FXS / TetherUS trading ideas and keep track of what's moving crypto markets with our crypto news feed.
FXS / TetherUS (FXS) is just as reliable as any other crypto asset — this corner of the world market is highly volatile. Today, for instance, FXS / TetherUS is estimated as 1.22% volatile. The only thing it means is that you must prepare and examine all available information before making a decision. And if you're not sure about FXS / TetherUS, you can find more inspiration in our curated watchlists.
You can discuss FXS / TetherUS (FXS) with other users in our public chats, Minds or in the comments to Ideas.