Going to retest resistance? Another dump expectedAs we predicted earlier, the bearish scenario is ongoing, still shaping the potential triple zigzag.
Another dump is very likely when the rebound from Gann Fan, helped by the harmonic black swan, ends up in a pullback to retest the resistance.
Factors to watch (for the short term):
- Trendline (from circled "X") around 20500-20600
- Gann Fans 4/1 and 8/1 (to support around 18500?)
- 25EMA on 4H Timeframe
- June 19 low (17600)
- Red channel midline
Gann Fan

$DXY End of Month Range ReviewThere appears to be forces at work that are expect (are working on making) $DXY move down to 106.5 levels by months end. Today, 108 to 108.5 is in the window I'm looking through. Simple as that! Keep an eye out though, if we break 108.5, the market's gonna be tanking pretty bad, and there's already divergence between $DXY and assets like $BTC in play this week, and today's no exception!

X or ex?may be we are in last leg of this rally, so for tomorrow considering gap up scenario this is what I'm expecting, overall short is not advisable. and expecting market to top out on Friday or Monday.
Im not an SEBI registered advisor, so risk v apna apna aur ishq v apna apna, happy trading

My Weekly Analysis 40 Pt. 1I go through my currency pairs and analyze them while listening to music and talk to you guys.
*not a financial advisor*

IDX: JPFA FOR AGUST 2022Strong support at 1610
weak resistance at 1665
I Prefer green trading plan
Disclaimer:
This information is for educational purposes and is not an investment recommendation or representative of professional expertise. This analysis used herein is for illustration purposes only. This personal opinion should not be considered specific investment advice. I am not responsible for any trades, and individuals are solely responsible for any live trades placed in their own personal accounts.

IDX: ANTM FOR AGUST 2022Strong support at 1950
Weak resistance at 2130
I Prefer yellow trading plan
Disclaimer:
This information is for educational purposes and is not an investment recommendation or representative of professional expertise. This analysis used herein is for illustration purposes only. This personal opinion should not be considered specific investment advice. I am not responsible for any trades, and individuals are solely responsible for any live trades placed in their own personal accounts.


Weekly Trade Idea for aug 15 2022EU has been struggling to breakthrough the sell zone for more than two weeks.
As we trade the monthly cycle of high and lows, it is the time for the cycle to drop to the buy zone.
The current price as of Aug 17 is @ 1.01692, we are looking forward for the price to drop down to at least 1.00734. you might short if you are trading shorter timeframe or scalping.
However here we are trading swing and trading days range from 3 days to 2 weeks. we will wait for the price go downward and buy it from there.
Multi level entry would be strongly suggest when the price come to the buy/sell order zone.
Set your order, take care your risk. and let the market do it's job
all the best traders!

IDX: BBRI FOR AGUST 2022Medium support at 4240
Medium resistance at 4350
I Prefer Yellow trading plan
Disclaimer:
This information is for educational purposes and is not an investment recommendation or representative of professional expertise. This analysis used herein is for illustration purposes only. This personal opinion should not be considered specific investment advice. I am not responsible for any trades, and individuals are solely responsible for any live trades placed in their own personal accounts.

IDX: BRIS FOR AGUST 2022Medium support at 1560
Strong resistance at 1700
I Prefer Green trading plan
Disclaimer:
This information is for educational purposes and is not an investment recommendation or representative of professional expertise. This analysis used herein is for illustration purposes only. This personal opinion should not be considered specific investment advice. I am not responsible for any trades, and individuals are solely responsible for any live trades placed in their own personal accounts.

IDX: TLKM FOR AGUST 2022Strong support at 4510
Medium resistance at 4660
I Prefer Yellow trading plan
Disclaimer:
This information is for educational purposes and is not an investment recommendation or representative of professional expertise. This analysis used herein is for illustration purposes only. This personal opinion should not be considered specific investment advice. I am not responsible for any trades, and individuals are solely responsible for any live trades placed in their own personal accounts.

Doge broke the weekly downtrend 1 / 1 Doge finally broke the 1 x 1 downtrend angle. I've been accumulating anything under the 8/1 from the prior swing low. Better times ahead hopefully....

BTC/USDT DMy opinion is based on parallel Channel,
the price can't break previous pivot on daily resistance and it seems to engulf the previous candle.
also, the RSI indicator has dynamic support on it, and the breaks down can cause the price to fall

Bitcoin AnalysisBitcoin Analysis with Gann, Trendlines and Fibonacci circle
Support : 23460
Resistance : 24200
25610
26060
29710

Intel Classic Cup and HandleHello,
Thoughts on technical chart analysis on Intel.
Cup retracement 83% for a deep bowl for good long term returns if the pattern plays out.
In the short term thinking about the handle we see a ~38.2% retracement.
Adding a Gann Fan to help time the movements.

Bitcoin Trend, Macroeconomy Trend, and the BottomThe Bitcoin has been in this price channel since 2017, the channel is not everything, this price channel action now fits the projected macroeconomy timeline.
A bottom in late 2022/early 2023 looks reasonable with the expected macroeconomy-related situations, the Fed would most probably continue its measures, but it will stop as soon as things start getting out of control (unemployment, and the recession) most probably in 2023 Q2.


bitcoin dominanace. Up or down??!In my opinion bitcoin dominanace is going down but its not financial advice and do your own research my analysis can fail and it is possible im totally wrong good luck

UPST - Does lending get tougher with rates increase?
UPST has a better AI lending models than FICO and has gained a lot of partnerships with many small banks, like credit unions. The company claims to be able to improve loan default rates at banks by 75%. I see decent near term potentials. The stock peaked at 400 in 2021, and crashed as low as 25$ in May despite 150% YoY earning growth.
Will they be able to profit and continue to grow in this tough economy and high interest rate? Let's find out on August's earnings.
This is an interesting play. Aside from the fundamentals, here's my TPs for the near term.

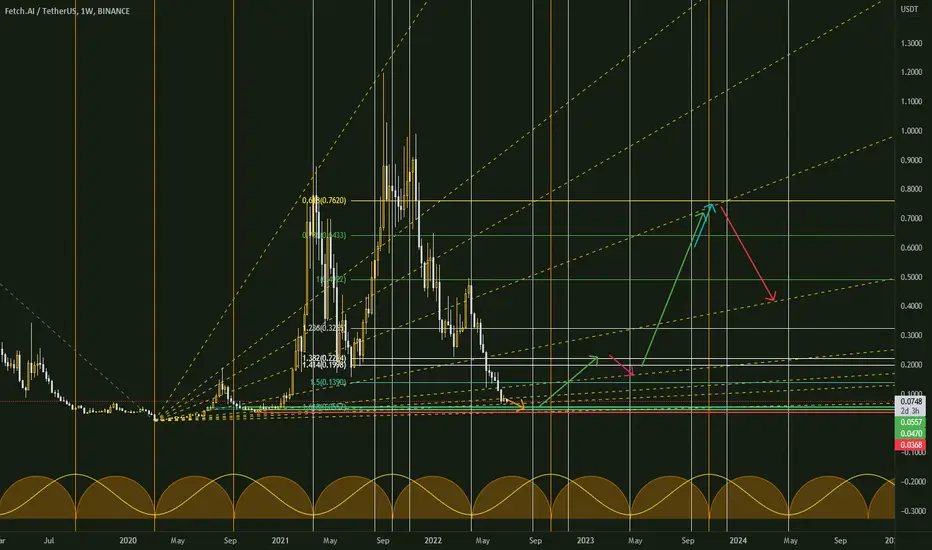
$FET Chart$FET looks good to buy in the 0.057/0.047 area, I think it will start going up on 10 OCT and below 0.0368 looks bad to me.
And you can see The targets on the chart:
1- 0.4922
2- 0.6433
3- 0.762
I will gradually reduce my intake during the ascent and not rely on one target.
>
THE CHART SAYS IT ALL. BOTTOM'S IN, ROAD TO 100KI could explain it in great detail but I'd rather just watch it become reality.

BITCOIN Long-TermThis is what I expect for Bitcoin's path for the next long term,
this chart I held for more than a month and I didn't dare put it up because of its boldness.
But I consider it very logical for me.
And I think we're in a good time to buy (DCA) into the end of September.
Good Luck.

Litecoin goes back to 300Hi fren,
After dipped around 40$, LTC could go back quick to around $300 in july I think. Nice trades! #doggonacci
