Best Harmonic Patterns For Beginners in Forex Gold Trading
In the today's article, I will share with you 4 best harmonic patterns for beginners. We will discuss the structure of each pattern and the rules.
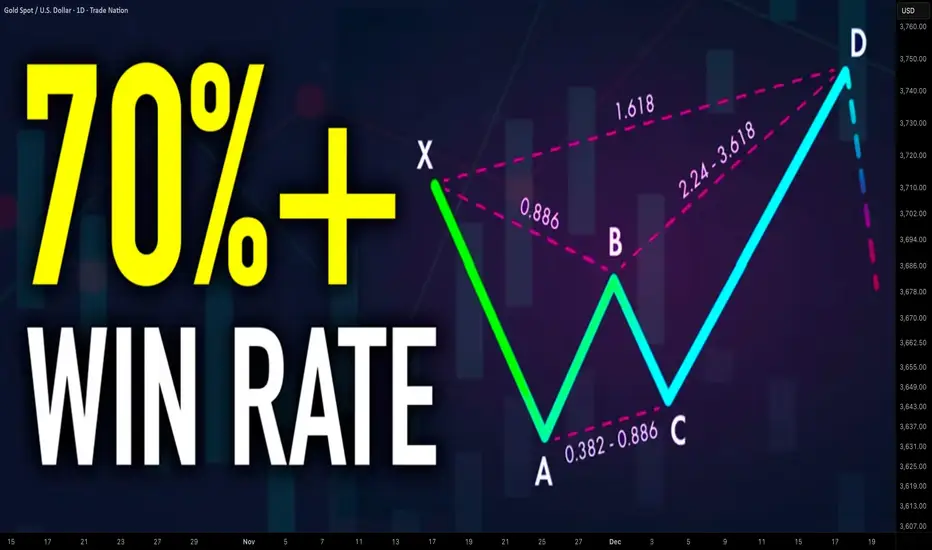
Harmonic ABCD Pattern
That pattern is based on 3 legs of a price movement:
AB leg - impulse leg,
BC leg - retracement with the range of XA leg,
CD leg - impulse leg that has the same direction, the same time horizon and the same length as the XA leg
AB and BC legs should be equal or almost equal, that makes the pattern harmonic.
The completion point of the pattern - D point can be applied for predicting a pullback.
ABCD pattern can be bullish and bearish.
In a bullish ABCD pattern, AB leg is bearish.
D point of the pattern will be a safe point to buy from.
In a bearish ABCD pattern, AB leg is bullish.
D point will be a safe place to sell from.
The next 3 patterns will be based on 4 legs of a move:
XA, AB, BC, CD and will have XABCD structure with the initial point of the pattern being X point.
D point will be a completion point of the pattern from where a pullback will be anticipated.
The type of the harmonic pattern will be identified with Fibonacci numbers. The exact placement of each point of the pattern will define the name of the pattern.
Harmonic Gartley Pattern
In Harmonic Gartley,
B point of the pattern should strictly be between 618 and 786 retracement of the XA leg.
C point should lie between 618 and 786 retracement of AB leg.
D point will be 1.272 extension of AB leg.
Bullish Gartley Pattern will be based on a bullish XA leg.
Bearish Gartley will be based on a bearish XA leg.
Harmonic Bat Pattern
In Harmonic Bat,
B point of the pattern should strictly be between 50 and 618 retracement of the XA leg.
C point should lie between 618 and 1 retracement of AB leg.
D point will be 886 retracement of XA leg.
Bullish Bat Pattern will be based on a bullish XA leg.
Bearish Bat will be based on a bearish XA leg.
Harmonic Cypher Pattern
In Harmonic Cypher,
B point of the pattern should strictly be between 382 and 618 retracement of the XA leg.
C point should lie between 1.272 and 1.414 extension of XA leg.
D point will be 786 retracement of XC leg.
Bullish Cypher will be based on a bullish XA leg.
Bearish Cypher will be based on a bearish XA leg.
These patterns are phenomenally accurate and they are very simple to recognize.
❤️Please, support my work with like, thank you!❤️
I am part of Trade Nation's Influencer program and receive a monthly fee for using their TradingView charts in my analysis.
Gartley
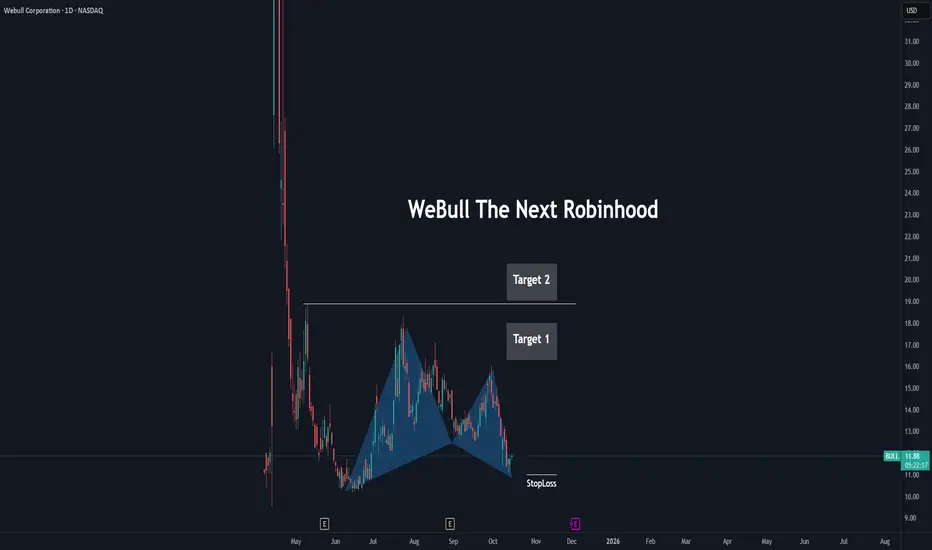
Beautiful Bullish Harmonic Bat PatternMassive Bullish Divergence (using RSI),
Bullish Bat Harmonic Pattern,
Overall WeBull seems bullish to me.
This idea is for educational purposes only and being published as a specualtion.
Do your own Research.
Thumbs up if you like my idea.
Bearish Gartley Pattern Trade Plan:
Entry Zone (PRZ): 1.170
Trigger: Bearish rejection candlestick(s) (e.g., Bearish Engulfing, Pin Bar, Doji) confirmed in the PRZ.
Direction: SELL
Stop Loss: Above the X point (invalidates the pattern).
Profit Targets (Take Gradual Profits):
TP1: 1.160
TP2: 1.158
Risk/Reward: The R/R is highly favorable, potentially above 1:2, depending on your primary target.
Rationale: The PRZ represents a significant area where multiple harmonic alignments converge. The move from B to C was a strong, impulsive wave, increasing the probability of a rejection at the D point completion. The stop loss is well-defined, providing a clear level of invalidation.
if you think it's agood idea please boost .

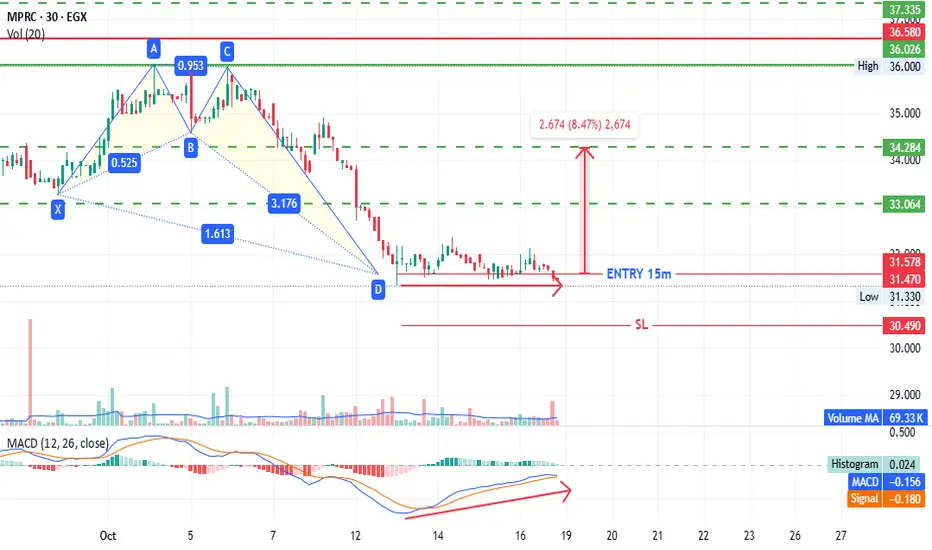
MPRC - is that end of correction ?! EGX:MPRC - EGX30 - Timeframe 30m
Format a Gartley bullish pattern as follows:
- Entry: 31.50 (current price: 31.47)
- Stop loss: 30.50 (potential loss: 3.50%)
- First target: 33.10 (potential profit: 4.70%)
- Second target: 34.25(potential profit: 8.50%)
also MACD is positive that may support our idea
This is not investment advice, only my analysis based on chart data.
Consult your account manager before investing.
Thanks and good luck.
ORHD - EGX30 - Critical point , high risk EGX:ORHD - EGX30 - Timeframe 2 Hours
Prices achieved the minimum target for Head and Shoulders pattern at 21.30,
Moreover now prices Formatted a Gartley bullish pattern as follow:
- Entry: 21.45 (current price: 21.30)
- Stop loss: 21.16 (potential loss: 1.35%)
- First target: 22.41 (potential profit: 4.45%)
- Second target: 23.00 (potential profit: 7.60 %)
This is not investment advice, only my analysis based on chart data.
Consult your account manager before investing.
Thanks and good luck.

ISMQ - wait for action sen 1: 12/10/2025
Entry from 5.85 to 5.76
5.76 is a target for Head & Shoulders (H&S) on the 1-hour chart.
5.85 is an 88% Fibonacci retracement level (FIP) for harmonic patterns on the 1-hour chart.
Stop Loss (SL): 5.65 Target 1 (T1): 6.18 Target 2 (T2): 6.38
sen 2:
Re-enter when closing above 6.44 (the right shoulder) to deactivate the H&S pattern.
Stop Loss (SL): 6.37 Target (T1): 6.70
Its not an advice for investing only my vision according to the data on chart
Please consult your account manager before investing
Thanks and good luck

$ETHUSDBITSTAMP:ETHUSD : Bullish Gartley that I feared did drive ETH to $3734. Selling is so intense. Not sure it'll bounce. Chances are it won't bounce until BTC is driven below $100K.
I'm still long and holding Ethereum ETF. Don't think it's a good idea to add here.

EUROD Stablecoin Debuts as ODDO BHF Enters Crypto MarketIn the evolving crypto market of October 2025, the launch of EUROD marks a pivotal moment as a major European financial institution enters the space with a euro-backed stablecoin. EUROD, designed as a compliant, low-volatility digital euro, is backed 1:1 with fiat reserves and aims to bridge traditional finance with blockchain, offering accessibility for retail and institutional users. This debut reflects the growing demand for regulated stablecoins in Europe, where the market cap has surpassed $300 billion amid MiCA's rollout. EUROD will first list on a Madrid-based crypto platform, backed by telecom and banking giants, positioning it as an alternative to dollar-pegged tokens like USDT. This article analyzes EUROD's launch, its implications for the stablecoin ecosystem, and trading opportunities. Position for the euro-stablecoin shift.
EUROD's Launch: A Compliant Euro for Crypto
EUROD is structured to meet EU's Markets in Crypto-Assets (MiCA) regulations, ensuring transparency, liquidity, and redeemability for users across the European Economic Area (EEA). Backed by a 175-year-old banking institution managing over €150 billion in assets, the stablecoin prioritizes security and compliance, with audited reserves and seamless on-chain accessibility. It targets both retail investors seeking stable digital euros and institutions needing fiat-like stability in DeFi, voting, and payments.
The launch coincides with nine European banks, including ING and CaixaBank, forming alliances for MiCA-compliant euro-stablecoins, signaling a continental push toward tokenized money. EUROD's debut on a Spanish exchange, backed by Telefonica, Unicaja, and BBVA, bridges traditional banking with blockchain, offering frictionless on-ramps for euro liquidity in lending, borrowing, and settlement. This comes as the stablecoin market hits $300 billion, with euro-pegged tokens gaining traction amid dollar dominance concerns.
On-chain data underscores momentum: stablecoin transactions up 25%, with 20% market share for euro variants. Sentiment is 71% bullish, correlating 0.7 with ETH, as MiCA compliance reduces depeg risks by 30%. Risks include liquidity constraints in early trading (5–7% volatility) and regulatory audits, but EUROD's fiat backing mitigates these.
Market Implications: Euro Stablecoins and DeFi Bridge
EUROD's entry diversifies the stablecoin landscape, challenging USDT's dominance with a euro-pegged option for EEA users, potentially capturing 10% of the $300 billion market. It enables efficient cross-border payments, reducing costs by 80% compared to traditional wires, and integrates with DeFi protocols for on-chain lending and borrowing. Partnerships with nine banks, like Societe Generale's EURCV, signal a trend toward bank-issued stablecoins, transitioning from custody to DeFi accessibility.
This launch aligns with the euro's role in tokenized finance, where regulated stablecoins facilitate $10 billion in monthly DeFi volume. Analysts forecast euro-stablecoins reaching $50 billion by 2026, with EUROD paving the way for institutional adoption. However, U.S. dollar hegemony and regulatory scrutiny could cap growth, risking 2–3% depegs in volatility spikes.
Trading Signals: RSI and MACD
Based on recent trends:
ETH ($4,500): RSI at 58 (bullish). Bullish MACD (+0.12)—target $5,200 (15% upside). Support at $4,200, resistance at $4,760. On-chain: stablecoin volume +25%.
BTC ($116,000): RSI at 57. Bullish MACD (+0.15)—target $120,000 (3.5% upside). Support at $115,000, resistance at $117,400.
Overall: RSI 57–58 signals longs for 3.5–15% gains. Risks: liquidity constraints (5–7% dip); hedge with USDC.
Conclusion: EUROD's Crypto Entry
EUROD's debut as a MiCA-compliant euro-stablecoin signals Europe's tokenized future, bridging banking and blockchain with 1:1 fiat backing. RSI 57–58 and bullish MACD suggest 3.5–15% upside—buy the launch for DeFi liquidity gains.
What’s your stablecoin play? Comment below!
#EURODStablecoin #EuroStablecoin #CryptoMarket #ETH #TradingSignals

$ETHUSDBITSTAMP:ETHUSD may have more downside if this Gartley is going to play out. $3725 area. I'm long. If it drops to $3725 range, I plan to add to my position. For now, I'm holding.

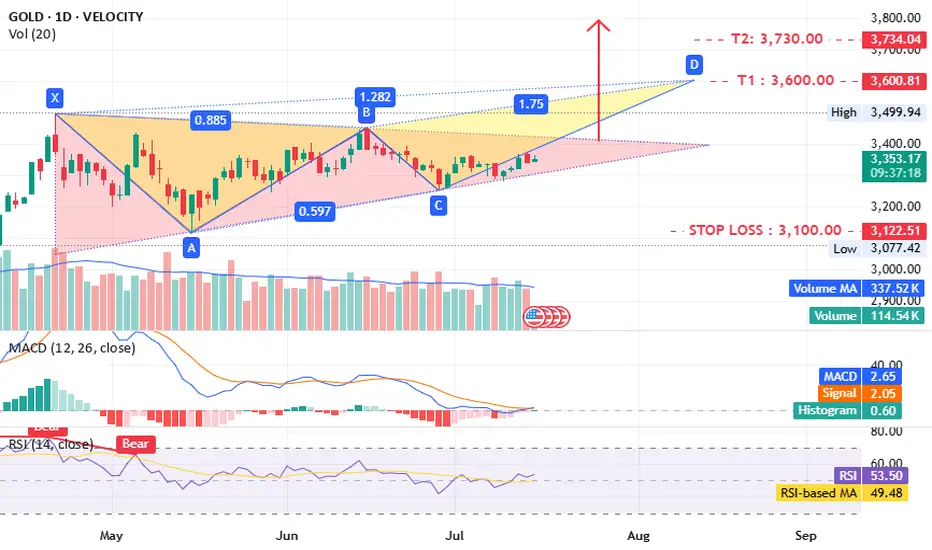
Gold what is next ?!!TVC:GOLD timeframe 1 day
is forming a potential triangle pattern, which could lead to a bearish setup.
The MACD and RSI indicators are positive, supporting this outlook. A close above 3400 would further confirm the idea.
Targets:
- T1: 3600
- T2: 3730–3800
Stop loss: 3100
Support: 3300–3260
Consider opening a long position now, with confirmation above 3400.
Disclaimer: This is not investment advice, only an analysis based on chart data. Consult your account manager before making any decisions. Good luck.
M Gartley signals Trend ReversalOil downtrend channel has lasted a looooong time. Now a Gartley-M Harmonic Pattern is present which could signal a trend reversal... if it holds. Upside includes usual Gartley resistance levels and 1.618 resistance at USD 95.
Thank you for your attention to this matter!

EFIH -EGX30 - great fundamental , low risk EGX:EFIH - timeframe 2 hours
A Bullish Gartley pattern was identified as follow:
entry around 12.15 ( prices now 12.10 )
stop loss 11.85 ( 2.25% potential loss )
first target 12.90 ( 6% potential profit )
secund target 13.50 ( 11% potential profit )
MACD showing a positive diversion that may support our idea
Its not an advice for investing only my vision according to the data on chart
Please consult your account manager before investing
Thanks and good luck

Gartley and math levels In this snapshot of price action on Brent crude we can see today would seem like an unqualified disaster for bulls. The pattern which has emerged from the chaos is an almost perfect gartley. If D anchor holds expect higher from here. Look for volume, rsi confluence.
The levels are precise mathematical and taken from highest volume not from high or low.

Fartcoin Wyckoff ReaccumulationCRYPTO:FARTCOINUSD looks to be in Wyckoff reaccumulation. Honestly, there’s nothing more to say, the chart speaks for itself.
We’re currently sitting in the spring zone, waiting for a bounce, retest, and move up. In my opinion, that should unfold over the coming months.
The risk here is that the spring I’m seeing might not actually be the spring, in that case, price could go lower. Still, I doubt it breaks below the current low; if it does, I’d say the downside risk sits around $0.5.
The trend is slowly curling upward, and I’m looking at potential targets of:
- Bear case: $2
- Base case: $3
- Bull case: $4

Elliott Wave + Gartley Harmonic: Why Bitcoin May Correct Soon!?Bitcoin( BINANCE:BTCUSDT ) has shown strong bullish momentum over the past week, climbing nearly +10% and testing key resistance zones . Several fundamental and technical factors fueled this rally.
Key Drivers of the Rise:
ETF inflows – Significant net inflows into spot Bitcoin ETFs boosted demand.
Macro uncertainty – U.S. government shutdown risk and weaker job data supported risk assets.
Monetary policy – Expectations of softer Fed policy improved market sentiment.
Derivatives impact – Options expiry, high OI, and short squeezes added upward pressure.
Exchange outflows – Lower BTC supply on exchanges signaled accumulation.
Positive sentiment – “Uptober” narrative and bullish analyst targets lifted confidence.
-------------------------------------------
Now, if we look at the Bitcoin chart in the above timeframes from a technical analysis perspective , we can see the following:
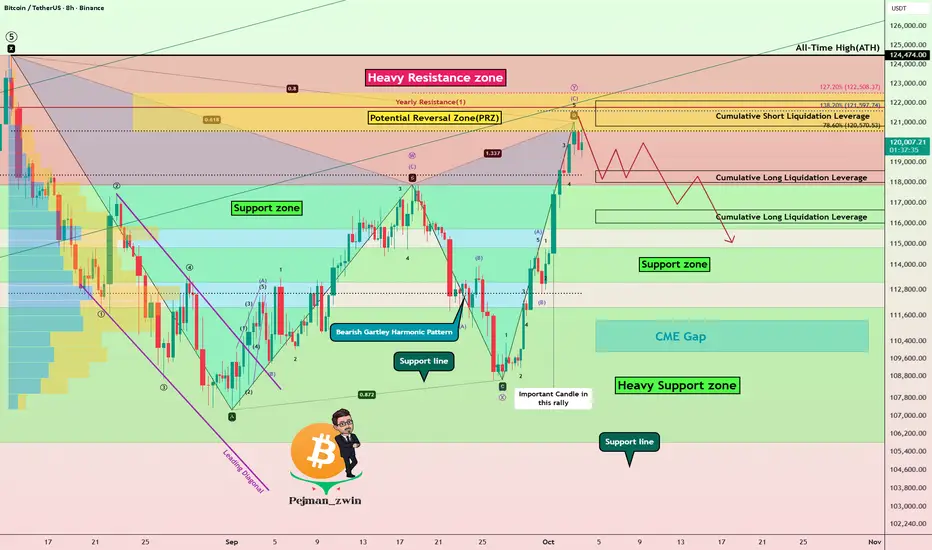
First of all, let me say that the rally that Bitcoin has had over the past 7 days has NOT been accompanied by high volume, and this is not good news for Bitcoin to create a new All-Time High(ATH) .
Bitcoin is entering a Heavy Resistance zone($124,474(ATH)-$117,900) and is moving near the Potential Reversal Zone (PRZ) and Cumulative Short Liquidation Leverage($122,120-$120,823) .
In terms of Elliott Wave theory , Bitcoin appears to be completing a microwave C of the main wave Y . One of the reasons I saw the waves as corrective , other than the microwaves, was the low volume of Bitcoin in the past 7-day rally .
If we look at the Bitcoin chart from a pattern perspective , the important Bearish Gartley Harmonic Pattern is also well and standardly defined on the chart, such that point D in the PRZ can be completed. The Gartley Harmonic Pattern is the most important pattern among the harmonic patterns .
I DO NOT expect a new ATH formation for Bitcoin in this rally due to the above reasons, and I expect it to at least decline to the Support zone($114,820-$113,180) .
Note: Important prices to watch for if Bitcoin reverses (in order of importance of volume): $118,400-$112,700
Note: You should note that these days, Bitcoin has a higher correlation with the SPX500( SP:SPX ) index than before, so if there is a sudden movement in Bitcoin, one of the reasons could be a sudden movement in the SPX500.
Educational Tip : The volume of each candle is considered to be the identity and credibility of that candle, and you can find these candles with the help of volume candle charts.
Cumulative Long Liquidation Leverage: $118,583-$118,000
Cumulative Long Liquidation Leverage: $116,652-$116,000
CME Gap: $111,355-$109,915
Stop Loss(SL): $125,00(Worst)
Please respect each other's ideas and express them politely if you agree or disagree.
Bitcoin Analysis (BTCUSDT), 8-hour time frame.
Be sure to follow the updated ideas.
Do not forget to put a Stop loss for your positions (For every position you want to open).
Please follow your strategy and updates; this is just my Idea, and I will gladly see your ideas in this post.
Please do not forget the ✅' like '✅ button 🙏😊 & Share it with your friends; thanks, and Trade safe.
Binance Coin (BNB) Flips Ripple (XRP) Following Record-Breaking In the volatile cryptocurrency market of October 2025, Binance Coin (BNB) has achieved a historic milestone, surpassing Ripple's XRP in market capitalization for the first time since 2023, fueled by a record-breaking price surge. BNB reached a new all-time high of $1,300, pushing its market cap to $180 billion, while XRP's $178 billion cap reflects a 15% daily gain to $2.27. This flip, marking BNB as the third-largest cryptocurrency behind BTC and ETH, underscores the strength of the Binance ecosystem amid regulatory tailwinds and institutional inflows. From this analysis, we explore the drivers behind BNB's surge, the implications for XRP, and trading opportunities in this high-stakes rivalry. Data as of October 7, 2025—position for the next phase of altcoin dominance.
BNB's Record Surge: $1,300 ATH and $180B Market Cap
BNB's ascent to $1,300 represents a 50% monthly gain, driven by the Maxwell upgrade on Binance Smart Chain (BSC), which reduced block times to 0.75 seconds and boosted transaction throughput by 49%. BSC's TVL hit $10 billion, with DeFi protocols like PancakeSwap processing $3.33 billion in daily volume, up 36% weekly. Institutional interest surged, with Nano Labs announcing a $500 million BNB accumulation strategy, highlighting BSC's role in cross-chain DeFi. BNB's utility in governance, staking (16.8% APY), and fee discounts on Binance Exchange has attracted 1.5 million new users monthly.
On-chain data reinforces the momentum: holder growth +15%, whale accumulation +10%, and burns reducing supply by 5% quarterly. BNB's flip of XRP (from $96.5 billion cap in November 2024) cements its position, with a 0.8 correlation to BTC signaling sustained upside.
XRP's Response: 15% Daily Gain but Lagging Behind
XRP surged 15% to $2.27, reclaiming $178 billion market cap amid optimism for spot ETFs (90% approval odds by late 2025) and Ripple's stablecoin launch rumors. The XRPL processed $16 billion in cross-border payments, with 59 billion XRP in circulation from its 100 billion fixed supply. XRP's narrative as a payments token strengthened post-SEC settlement, but BNB's ecosystem utility outpaced it, with XRP's RSI at 72 indicating overbought conditions after a 200% monthly rally.
On-chain: XRP transactions +25%, but whale sells +5% suggest profit-taking. XRP's flip by BNB highlights BSC's DeFi edge over XRPL's payments focus, though XRP's compliance-friendly features (e.g., native KYC) position it for institutional remittances.
Market Implications: BNB's Dominance and Altcoin Rotation
BNB's flip signals a rotation toward utility-driven tokens, with BSC capturing 5.5% of smart contract market share vs. XRP's 1%. BNB's burns and upgrades reduce supply, supporting $1,400 by Q4, while XRP eyes $3.60 on ETF approvals. The $50 billion meme and $150 billion stablecoin markets amplify this, with BNB correlating 0.7 to ETH for DeFi synergies. Risks include Binance regulatory scrutiny (e.g., $4 billion fine in 2024), but GENIUS Act clarity boosts confidence.
Sentiment is 71% bullish, with BNB's flip accelerating altcoin rotation, potentially lifting the total market cap to $4.2 trillion by year-end.
Trading Signals: RSI and MACD for BNB and XRP
Analysis uses RSI for momentum and MACD for trends, based on April 2025 uptrends:
BNB ($1,300): RSI at 62 (bullish above 60). Bullish MACD crossover (histogram +0.15)—target $1,400 (7.7% upside). Fibonacci support at $1,200 (50% retracement), resistance at $1,350 (161.8% extension). On-chain: Volume +36%, burns +5%.
XRP ($2.27): RSI at 72 (overbought, caution but bullish divergence). Bullish MACD (+0.12)—target $2.50 (10% upside). Fibonacci support at $2.10 (50%), resistance at $2.40 (161.8%). On-chain: Transactions +25%.
Overall: RSI 62–72 signals momentum—long BNB at supports for 10–15% Q4 gains, trim XRP at RSI >75. Risks: Regulatory news (5–7% dip); hedge with USDC.
How to Profit from BNB's Flip
Capitalize on this rivalry with disciplined strategies:
AI-Driven Alerts: Real-time notifications on RSI >60 (e.g., BNB at $1,200) and MACD crossovers, targeting 10–15% yields on ecosystem upgrades.
On-Chain Tracking: Monitor BNB burns (+5%) and XRP transactions (+25%), spotting rallies pre-ETF news.
Portfolio Rebalancing: Allocate 20–30% to BNB/XRP, hedge with stablecoins at RSI >70—aim for 15% Q4 returns through data-driven trades.
Educational Resources: Webinars on token utility and demo accounts for simulated trades, minimizing regulatory risks.
Integrated with Binance and XRPL explorers, these tools ensure precise decisions for rivalry plays.
Conclusion: Ride BNB's Surge
BNB's $1,300 ATH and flip of XRP ($178B cap) mark ecosystem dominance, with RSI 62/MACD bullish signaling 10–15% upside. Position for BNB's lead in the altcoin race.
Ready for the flip? Track signals and enter longs. What's your BNB/XRP target? Comment below!
#BNB #XRP #CryptoFlip #MarketCap #TradingSignals

#ZECUSDT - Another leg up is aheadWe all saw a massive bullish in zec in previous days out of 260% instant bullish... and now it's in consolidation
it shows a symmetrical triangle pattern in hourly chart with 2 attempts of breakout ... third one must be work
the next station at ( 250 - 280$)
best Regards:
Ceciliones🎯

EURCAD: wedge at the top with bearish divergenceThe EUR/CAD pair has been trading within an ascending channel, but the 4H chart shows a rising wedge pattern, typically a reversal setup. Attempts to sustain above 1.64 have failed so far, while the CCI indicator shows a series of bearish divergences, highlighting weakening bullish momentum.
Technically, the likelihood of a decline after the wedge breakout is high. Initial targets lie at 1.6260, followed by 1.6080, and deeper at 1.5780. A retest of the broken level (re-entry) is possible before the downward move accelerates.
From a fundamental perspective, the euro remains pressured by weak macro data and a cautious ECB, while the Canadian dollar is supported by stable oil prices and a firm Bank of Canada stance. This divergence in fundamentals strengthens the bearish case.
It’s a classic situation where the market tempts traders into expecting a reversal, but confirmation is still required. As always, emotions aside — we wait for clear signals before acting.

Bearish Gartley Potential on BTCTarget is around ~120,800 for the 0.786 retrace.
- 4hr RSI showing extreme levels
- Currently meets all criteria for a Bearish Gartley pattern

AUDNZD: Bullish Continuation + Gartley Pattern ComThe AUDNZD is giving us a unique trading opportunity where we can combine a harmonic pattern setup with a trend continuation play.
🔹 Price recently broke through a key structure level and printed an inside doji bar, a strong sign for potential bullish continuation.
🔹 Dropping down to the lower timeframes, we also have a potential Gartley pattern forming—one that can be traded as a standalone setup, used as an entry reason into the continuation move, or even both.
This type of scenario offers traders flexibility: you can trade the pattern completion, the trend continuation, or a confluence of both for added confidence.
Please leave any questions or comments below.
Akil

EURJPY Pattern Bracket: Dual Gartley Setups Ready to TriggerThe EURJPY has been in consolidation recently—great news for harmonic traders, since that type of price action often leads to pattern formations.
In this breakdown, I’ll show you two potential Gartley patterns setting up on either side of price, creating a pattern bracket scenario.
➡️ I don’t know which way price will break as we start the trading week, but the beauty of this setup is simple:
If price moves higher → one Gartley pattern comes into play.
If price moves lower → the other Gartley takes over.
Either way, I’ll have a high-probability trading opportunity on my radar.
Please leave any questions or comments below!
Akil

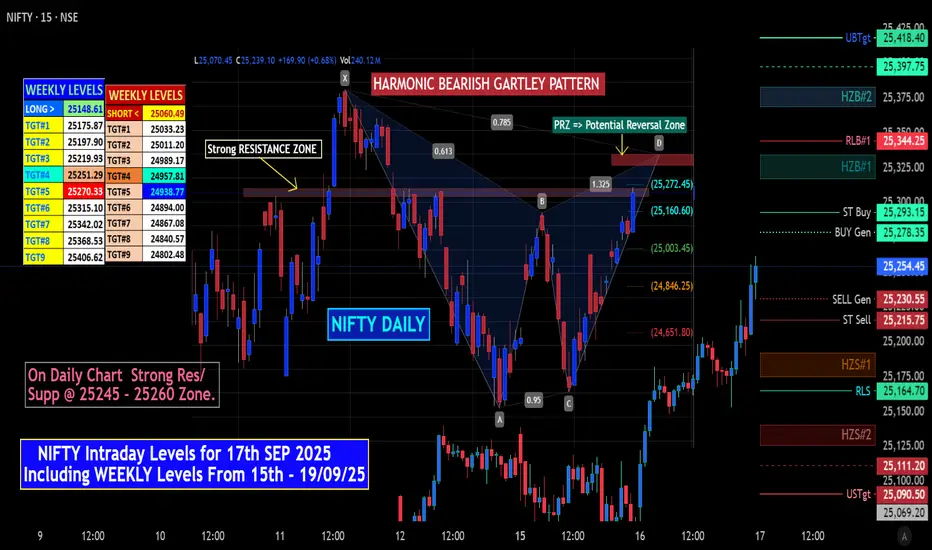
NIFTY Intraday Levels for 17th SEP 2025 & SWING PointsMarket Analysis:
NIFTY 50 Index is currently showing Bullish sentiment as it moves within an Ascending Channel (in Daily Chart ), indicating a potential upward trend continuation.
Though formed Bearish Harmonic Gartley Pattern havimg PRZ Near "25345 - 25395" Zone , signaling profit taking at any point of time on Above mentioned zone..
Indicator & Oscillator Short Analysis: "The price is above the 50-period moving average, suggesting a positive momentum. A Bullish MACD crossover further supports the upward movement, providing additional confirmation for potential buying interest.
Major Support levels Shifted from lower level near 24750 - 24850 to at 25110 - 25090 and 25000 ,
while resistance levels at 25345, 24395 and 25418 mark .
# "WEEKLY Levels" mentioned in BOX format.
^^^^^^^ Plot Levels Using 3 Min, 5 Min Time frame in your Chart for Better Analysis ^^^^^^^
L#1: If the candle crossed & stays above the “Buy Gen”, it is treated / considered as Bullish bias.
L#2: Possibility / Probability of REVERSAL near RLB#1 & UBTgt
L#3: If the candle stays above “Sell Gen” but below “Buy Gen”, it is treated / considered as Sidewise. Aggressive Traders can take Long position near “Sell Gen” either retesting or crossed from Below & vice-versa i.e. can take Short position near “Buy Gen” either retesting or crossed downward from Above.
L#4: If the candle crossed & stays below the “Sell Gen”, it is treated / considered a Bearish bias.
L#5: Possibility / Probability of REVERSAL near RLS#1 & USTgt
HZB (Buy side) & HZS (Sell side) => Hurdle Zone,
*** Specialty of “HZB#1, HZB#2 HZS#1 & HZS#2” is Sidewise (behaviour in Nature)
Rest Plotted and Mentioned on Chart
Color code Used:
Green =. Positive bias.
Red =. Negative bias.
RED in Between Green means Trend Finder / Momentum Change
/ CYCLE Change and Vice Versa.
Notice One thing: HOW LEVELS are Working.
Use any Momentum Indicator / Oscillator or as you "USED to" to Take entry.
📢 Disclaimer
I am not a SEBI-registered financial adviser.
The information, views, and ideas shared here are purely for educational and informational purposes only. They are not intended as investment advice or a recommendation to buy, sell, or hold any financial instruments.
Trading and investing in the stock market involves risk, and you should do your own research and analysis. You are solely responsible for any decisions made based on this research.
"As HARD EARNED MONEY IS YOUR's, So DECISION SHOULD HAVE TO BE YOUR's".
GARTLEYDOGE/USD (4H) – Bullish Gartley at D (Reversal → T1/T2)
Quick summer check-in while I sneak some downtime: DOGE just printed a clean Gartley-style completion and buyers are reacting at D.
📌 Pattern Overview
Pattern: Gartley (Bullish)
Asset: Dogecoin / USD
Timeframe: 4H
Bias: Long from D/PRZ on confirmation and structure reclaim
🔑 Key Levels
X: 0.1956
A: 0.2549
B: 0.2176 (shallow retrace of XA)
C: 0.2427
D (PRZ): 0.2078 (confluence with XA fib + AB=CD symmetry)
Target 1: 0.2493 – 0.2606 (≈ 61.8%–78.6% of AD)
Target 2: 0.2933 – 0.3165 (≈ 127.2%–161.8% extension)
📐 Technical Confirmation
BC retrace ≈ 67% of AB, CD ≈ 1.27–1.41 × BC into D.
Confluence at 0.207–0.210 forms the PRZ; first bullish reaction printed.
Structure pivot to watch: 0.224–0.226 (break/hold confirms momentum).
⚡️ Price Action & Trade Setup
Plan A (confirmation): Wait for a close above 0.224–0.226, buy the retest → T1, trail remainder toward T2.
Plan B (PRZ fade): Scale in small on holds within 0.208–0.212 with a tight stop; add on higher-low + pivot reclaim.
🧠 Market Sentiment
Choppy, but dip-buyers active near structure lows; holding above D keeps the recovery path open.
📊 Next Potential Movements
Upside path: 0.226 → 0.235 → 0.249–0.261 (T1), extension toward 0.293–0.317 (T2) if momentum broadens.
Pullbacks: 0.214 / 0.210 are spots to defend for higher-low continuation.
🛡 Risk Management
Invalidation: clean close below 0.2078 (D); conservative invalidation below 0.1956 (X).
Stops: just under 0.205 (aggressive) or < 0.195 (structure).
TP: scale at T1, trail to T2; move stop to BE after ~1R.
🚀 Conclusion
Gartley completion at D is holding. A firm 0.224–0.226 reclaim unlocks T1 (0.249–0.261), with room toward T2 (0.293–0.317) if buyers keep control.
“Patterns set the map — discipline drives the journey.”
@TRADECHARTPATTERNSLIKETHEPROS.
