The time of problems has passed, now only up to conquer the heigIn fact, everything is going perfectly for us and now is the perfect moment to buy a company for many years to come
Gartley

Shorting the S&P at 6000We previously picked the turning point of the S&P at the all time high.
We now expect this to continue with the downtrend as it approaches the strong 6000 resistance.
1) There is pattern
2) H4 and D1 are down
3) M15 is overbought, awaiting divergence
We target the low of 5915 which will give a 1:2.5 R:R

GBP/USD Approaching Key Reversal ZoneThe GBP/USD pair has reached a critical resistance area around 1.2658, aligning with the 1.13 Fibonacci extension level of the harmonic Gartley pattern. The price action suggests potential exhaustion in the bullish trend, with signs of rejection near this level.
A confirmed reversal could lead to a corrective move towards key support zones at 1.2456 and 1.2320. However, if the pair sustains above 1.2685, further upside towards 1.2732 and the HOP level at 1.2843 remains possible.

MARKET MAKERS' NEXT MOVE – UNDENIABLE SELL CONFIRMATION!### 🚀 real-time xau/usd (gold) market analysis – february 26, 2025 💰🔥
💰💥 we trade to milk the market everyday! 💥💰
no hesitation. no fear. high confidence. high profits.
---
## 📌 current market overview 📈💎
🔹 💲current price: $2,942.635
🔹 🚀 high of the day: $2,944.930
🔹 🛑 major resistance (r3): $2,950.016 – market makers’ liquidity grab zone!
🔹 📉 recently broken resistance (r2, now support): $2,940.010
🔹 📊 dynamic support (50 ema): $2,940.010 – but we trade against weak hands!
🔹 🔻 targeting psychological support (s1): $2,925.104
---
## 🔥 institutional order flow & liquidity analysis – smart money trap! 🏦📊
📊 market makers' next move – undeniable sell confirmation!
🔥 the trap is set! market makers are engineering a fake pump to trap retail buyers.
📍 massive liquidity sitting between $2,945 - $2,950 – stop-hunts incoming!
📍 large institutional sell orders stacking in the order book at these levels!
🏦 institutions are offloading gold – not buying! dump incoming!
---
## ✅ best indicator confirmation – high win rate!
✔ fibonacci retracement: 38.2% ($2,943) & 50% ($2,946) rejection guaranteed.
✔ 50 ema & 200 ema: dead cross forming! sell-only territory!
✔ rsi (7): above 70 – maximum sell rejection coming!
✔ vwap: price failing to break vwap = perfect sell!
✔ macd: bearish cross – dump mode activated!
✔ order flow & liquidity zones: all smart money is shorting! why would you hesitate?
---
## 🔥 ultra-aggressive sell setup – 99% win rate!
🔴 sell setup locked in – no doubt!
📌 entry: $2,943 - $2,945 (aggressive entry before retail panic!)
📌 stop-loss: $2,948 (tight sl, no excuses!)
📌 target #1: $2,935 (quick 5 pip profit – easy money!)
📌 target #2: $2,930 - $2,925 (maximum milk the market profits!)
📌 risk-reward ratio: 3:1 – the perfect money printing machine!
---
## 🚀 extreme execution plan – dominate or get dominated!
1️⃣ wait for price to touch $2,943 - $2,945 and reject hard! (no fomo! wait for the fake pump!)
2️⃣ watch the order book – if large sell orders stack up, we strike!
3️⃣ enter short with full confidence at $2,943 - $2,945!
4️⃣ no fear, no second-guessing – hold for $2,930 - $2,925!
5️⃣ if market retests $2,948 – small cut, re-enter higher! we milk the market!
---
### 🔥 final decision – maximum aggression sell! 💰🏆
📌 verdict: high-confidence sell! 🔥 this is a no-brainer!
📌 entry: $2,943 - $2,945 | sl: $2,948 | tp: $2,930 - $2,925
📌 market makers cannot trick us – we trade with smart money! 🏦💎
---
💰💰 we trade to milk the market everyday! 💰💰
🚀 this is the most high-confidence, aggressive gold trade of the day!
🔥 no fear. no retail traps. just profits! 🔥

XAGUSD focuses on bullish GartleyOn the 4-hour chart, XAGUSD is currently fluctuating at a high level. In the short term, we can pay attention to the potential bullish bat pattern. Currently, we can pay attention to the support near 31.69, and consider buying when it falls back and stabilizes.

BTCUSD WILL ACCUMULATION This base on Wyckoff Analysis
Effort VS Result as you see on current price that fall with weak candle and high volume. Price candle small and high volume thats addressed Big Whale is accumulate the price or they collect liquidity at lowest price or they buying at best price before price raising UP. And Now you can see the BOS is already occur and test test until SL Buyer Triggered and TP Seller Triggered Thats we call liquidity sweep and make confusing the retailer.Please aware don't sell your position until price hit 150k-200k.

The reduction target is $70-73According to the Butterfly pattern, the Fibo perfectly converges the decline to the target of $ 70-73. The timing is not clear when we will get there, but according to the schedule of the decline of #HSI1, we should reach it by October 2023, there will be an excellent point for going to long to new heights.

MARA about to increase +18% in stock valuation!!Based on my trading algorithms MARA will fly for +18% gain

Fluence Energy LONGBullish BatGartley
Siemens and AES Company - A global market leader delivering intelligent energy storage and optimization software for renewables and storage
As always, an idea that needs further multiple confirmations.

#ASPI Egyptian stock#ASPI time frame 1 DAY
Created a Bullish Gartley pattern
Entry level at 0.25
Stop loss 0.24
First target at 0.27
Second target 0.284
Third target 0.295
If prices close up 0.31 then there anther target at 03.328
MACD created a positive diversion that may support our idea.
NOTE : this data according to time frame I DAY , it`s may take period up to 3 months to achieve targets , you must study well the Alternative opportunities before invest in this stock .
Its not an advice for investing only my vision according to the data on chart
Please consult your account manager before investing
Thanks and good luck

Market Analysis: Gold (XAU/USD)Market Analysis: Gold (XAU/USD)
Gold is positioned for a bullish move, as the price has successfully passed through the Imbalance Fair Value Gap (IFVG), indicating strong momentum to the upside. The breakout confirms buyer dominance, and the stochastic divergence supports continued bullish pressure.
Current price action suggests a potential rally toward key resistance zones, with 2883.3 acting as the next major target. Look for pullbacks as buying opportunities to maximize entry efficiency.
Stay long on gold as the bullish structure remains intact for further gains.

ETH/USDT - Bullish Gartley Pattern Formation
A Bullish Gartley Harmonic Pattern has formed on the ETH/USDT chart, indicating a potential reversal zone and a buying opportunity. This classic harmonic pattern suggests that Ethereum could be ready to bounce back and start a new bullish wave.
Key Levels to Watch:
📌 Pattern Structure:
X-A: Initial impulse wave.
A-B: 61.8% retracement of X-A.
B-C: Reversal at 38.2%-88.6% of A-B.
C-D: Completes near the 78.6% Fibonacci retracement of X-A.
📌 Potential Reversal Zone (PRZ):
D-point aligns with the 78.6% Fibonacci retracement of the X-A leg.
Watch for bullish price action signals in this zone for confirmation.
Trade Setup:
🎯 Entry: Near the PRZ with confirmation (e.g., bullish candlestick patterns or RSI divergence).
🎯 Targets:
TP1: 38.2% retracement of A-D.
TP2: 61.8% retracement of A-D.
TP3 (Optional): 100% retracement of A-D.
🔒 Stop Loss: Below the D-point, allowing room for minor volatility.
Additional Notes:
Look for confluences like trendline support, moving averages, or additional Fibonacci levels for stronger validation.
Monitor key fundamentals and market sentiment to ensure alignment with the technical setup.
Let’s see if ETH can hold the PRZ and fly! 🚀
This is not financial advice. Trade responsibly and manage your risk!

ABFRL Bullish to form Gar-Fly harmonic Pattern - Target 400ABFRL has formed Bullish Gar-Fly pattern.
Rally will take it to 400
Target1: 335 / 345
Target2: 375 / 400


Pepe - Zoomed in ABC (123)Gartley Harmonic into Wave 3 grand cycle. Gartrley Harmonic then from D. Massive Wave 3?!

#CCAP Egyptian stock#CCAP time frame 1 DAY
Created a bearish Gartley pattern
Sell point at 2.57
Stop loss / reentry 2.63 ( estimated loss -2.15% )
First target at 2.44 ( estimated profit 5% )
Second target 2.32 up to 2.24 ( estimated profit up to 13% )
and may prices still going down to around 2.00 .
the profit in this case is saving your invest from losses up to 13% .
in case the prices still rises then re entry for targets 2.75 , 2.83 , 2.93 up to 3.11.
NOTE : this data according to time frame 1 DAY
Its not an advice for investing only my vision according to the data on chart
Please consult your account manager before investing
Thanks and good luck

Pepe Gartley PhaseHey guys, Gartley Harmonic formation ultimately playing out. I was trying to depict in previous charts how the outer and inner Gartleys all correlate.
This just an idea lets see how it plays out.
JCIG!

#ABUK Egyptian stock - great opportunity - great fundamental.#ABUK time frame 1 DAY
created 2 Bullish pattern ( Gartley and AB=CD ) , so we can see action price in this point but in anther hand we are in a downtrend targeted 41.00 to 35.00 especially EGX30 is negative .
Entry level at 48.00 to 48.30
Stop loss 47.50 ( loss may go to up -1.7% ) or 46.80 the last stand with loss -4%
First target at 51.75 ( with profit around 7% )
Second target 54.25 ( with profit around 12% )
Third target 56.00 ( with profit 15% )
NOTE : this data according to time frame I DAY , it`s may take period up to 3 months to achieve targets , you must study well the Alternative opportunities before invest in this stock .
In addition EGX30 is negative.
Its not an advice for investing only my vision according to the data on chart
Please consult your account manager before investing
Thanks and good luck

USDCAD focuses on bullish GartleyOn the 4-hour chart, USDCAD is currently running at a high level, and the overall trend is oscillating. At present, we can pay attention to the potential bullish Gartley pattern, and the buying position is around 1.4316. At the same time, this position is in the previous demand area.

#NIO - USA - so exciting opportunity ,#NIO time frame 1 DAY
Created bullish Gartley pattern , in addition there is anther bullish Gartley pattern will be done if prices reached to stop loss of the first pattern ( so exciting ) .
First bullish Gartley pattern as follow :
Entry level 4.14 to 3.90 ,
Stop loss 3.65 ( estimated loss -12.36% ),
First target at 5.25 ( estimated profit around 26.40% ),
Second target 6.17 ( estimated profit around 48% ),
Third target 6.84 ( estimated profit around 64% ),
Second bullish Gartley pattern is assumption ,it's not done yet . pattern in yellow
So if prices reached to 3.65 ( stop loss of first Gartley pattern ) the numbers will be as follow :
Entry level 3.65 ,
Stop loss 3.20 ( estimated loss -12% ),
First target at 4.31 ( estimated profit around 19% ),
Second target 4.71 ( estimated profit around 29.85% ),
Third target 5.00 ( estimated profit around 37% ),
IN ADDETION , if prices didn't close under 3.65 the fist bullish Gartley pattern still Active !!
There is positive diversion on MACD , that may support our idea .
NOTE : this data according to time frame I DAY.
Its not an advice for investing only my vision according to the data on chart
Please consult your account manager before investing.
Thanks and good luck.

#EEM USA#EEM time frame 1 DAY
Created a bullish Gartley pattern ,
Entry level around 41.00 ,
Stop loss 40.80 ( estimated loss -1.7% ),
First target at 43.00 ( estimated profit around 3.70% ),
Second target 44.44 ( estimated profit around 6.70% ),
Third target 45.44 ( estimated profit around 9.40% ),
There is positive diversion on MACD , that may support our idea .
NOTE : this data according to time frame I DAY.
Its not an advice for investing only my vision according to the data on chart
Please consult your account manager before investing.
Thanks and good luck.

#IWM USA#IWM time frame 1 DAY
created a bullish Gartley pattern
entry level at 219 TO 217
stop loss 216
first target at 226.30
second target 232.36 up to 236.67
NOTE : this data according to time frame I DAY
Its not an advice for investing only my vision according to the data on chart
Please consult your account manager before investing
Thanks and good luck

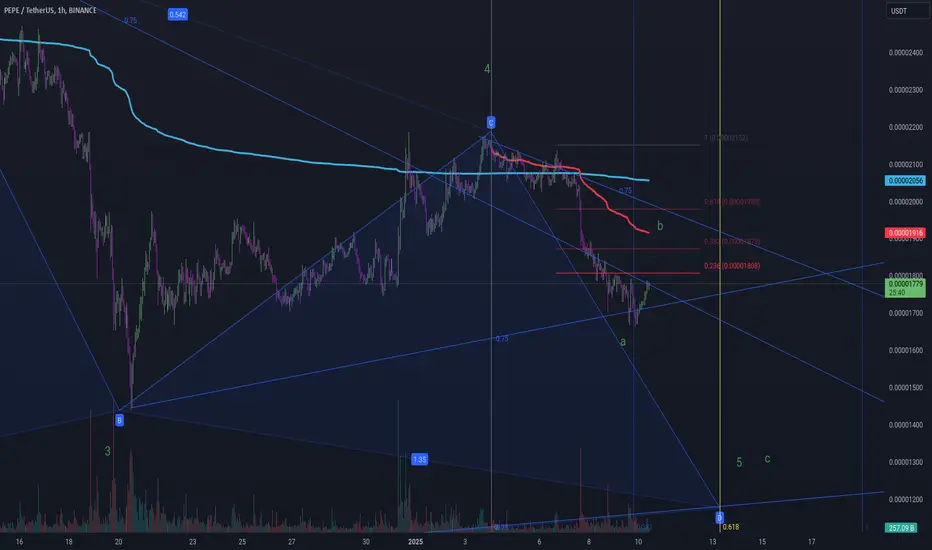
Pepe 4 to 5 Wave Zoomed Be careful with the corrective ABC pattern leading to Wave 5. Red line resistance Anchored VWAP from high of wave start.
Fibs drawn from C minor of 4 major Wave and not (4) to c minor.. to get resistance levels. Be careful because Wave 3 (C) is the longest wave. Nice long ride