US10Y yields and Gold Miners (GDX)Gold is an inflation hedge, so expect to see XAUUSD rising as the CPI and PCE data prints show consistent prints above 2% on average for the year.
US10 year yields steepen against the 2-year yield as short-term inflation expectations are crushed by QE and low-interest rates but medium-term inflation risks are starting to show their presence in the cost of commodities, materials, and rising wages. The Fed is adamant that the current signs of inflation will be transitory and as the base effects from last year fall out of the year-on-year data readings the inflationary pressures will ease.
Gold producers on the COT report had trimmed their short positions from the beginning of 2021 until April but have started selling more again as the price of Gold bounced off $1700, which make me feel that the range between $1700 to $1900 is here to stay for a while longer.
One way to try and capitalise on the price of Gold without the need for it to break $2k necessarily is to invest in a Royalty or Streaming company. With prices for mining output already set, the Royalty companies can still make money even when the gold price is falling. They don't operate mines themselves, and so the huge infrastructure and operating costs do not fall to them.
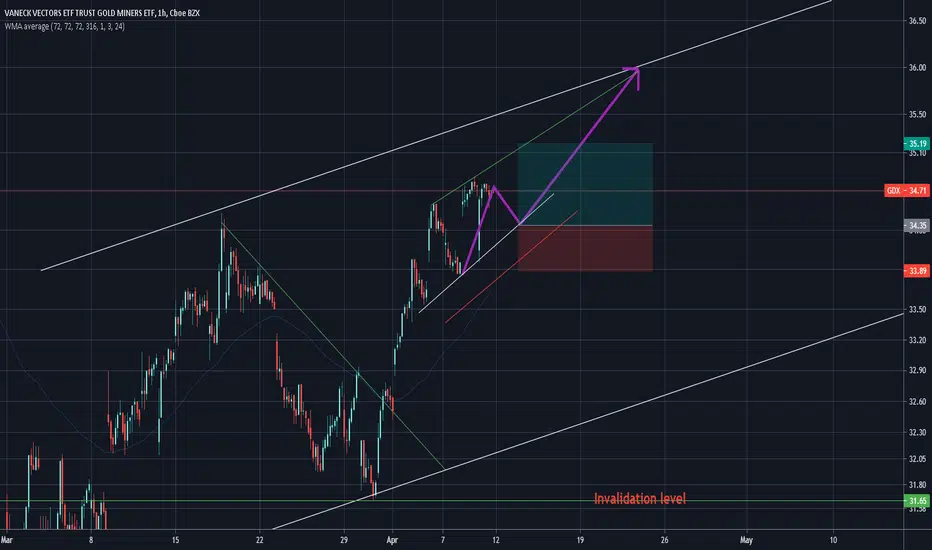
GDX


GDX breaking out from a multimonth down-trendAMEX:GDX is looking promising with today's breakout from a downward channel that started in August 2020, with OANDA:XAUUSD closing above resistance of USD 1760.

GDX: In the Arc We TrustAMEX:GDX has formed long-term support that has been built upon the arc shown in the chart. Should this arc prove to be true and continue to hold, it will lead us to our SCOTCHstocks initial target range of $52-$60.
Everything shared here is my own opinion and no results are guaranteed. Good luck!


GDX Elliott Wave View: Showing Corrective BounceShort term Elliott wave view in GDX suggests that it is doing a recovery from March 03, 2021 low in a corrective structure. The internals of that bounce is unfolding as Elliott wave zigzag structure where the first leg of the bounce ended in wave A at $34.48 high. Down from there, the GDX made a 3 wave pullback in wave B with another lesser degree zigzag structure. While the lesser degree wave ((a)) ended in 5 waves at $31.91 low. Wave ((b)) bounce ended in 3 swings at $32.96 high and wave ((c)) ended at $31.65 low thus completed wave B pullback.
Afterward, the ETF is trading higher in the next leg higher within wave C. The internals of the current bounce is unfolding as an impulse sequence where wave ((i)) ended at $32.79 high. Wave ((ii)) ended at $32.42 low, wave ((iii)) ended at $34.59 high and wave ((iv)) ended at $33.83 low. Near-term, as far as the pivot from $31.65 low stays intact then GDX is expected to take the extension higher in wave ((v)) towards $35.47- $37.83 area higher. Before it ends the cycle from 03, 2021 low in a zigzag structure & consequently the correction against the cycle from January 05, 2021 peak.

𝗖𝗵𝗮𝗿𝘁 𝗼𝗳 𝘁𝗵𝗲 𝗠𝗼𝗻𝘁𝗵: $TLT / $SPY Monthly. Key TestAll the way back down to blue TL. Could we see a reaction and get a #bond bounce?
$TNX $ZN_F $GLD $GC_F $GDX $DXY $SPY $SPX $ES_F $VIX $QQQ $NQ_F $DIA #Trading #Stocks #StockMarket 📈

𝗚𝗼𝗹𝗱 𝗠𝗶𝗻𝗲𝗿𝘀 𝗨𝗽𝗱𝗮𝘁𝗲: $GDX Weekly. Upside CaseHas been in this channel for sometime now. Tested key level in 31s and blue TL. Over 35-36 and we could see a pop into the 40s
$GDXJ $GLD $SLV $GC_F $SI_F $NUGT $DUST $DXY #Trading

Goldaholics Anonymous Pour yourself a glass of Goldschläger and let's review the 12 steps before diving into this.
1. We admitted that we were powerless over the Fed -- that our balance sheet had become unmanageable.
2. Came to believe that a Power greater than our central bank could restore us to solvency.
3. Made a decision to turn our fiat over to the care of sound money, as we understood it.
4. Made a searching and fearless inventory of our finances.
5. Admitted to Peter Schiff, Lyn Alden, and Pomp the exact nature of our wrongs.
6. Were entirely ready to have big, fat Gains.
7. Humbly asked to avoid getting short squeezed.
8. Made a list of all the naysayers about to be harmed.
9. Sent direct messages to them to gloat in victory.
10. Continued to count our gains and polish our bullion.
11. Sought through fundamental and technical analysis to improve our entries and exits.
12. Having had a financial awakening as the result of these steps, we tried to carry this message to other goldaholics, and practice these principles in all of our trades.
Macro Fibonacci
Below we can see the magic of Fibonacci extensions, measuring the last macro bull run to the 2016 low.
Zooming in a bit, it is clear that these levels attract attention. Each one of these fibs acts as a step in the staircase. All we need to do is look at volume and price action to validate each level. The smart money had their sell orders at the 0.618 Fibonacci extension. The 0.5 could not hold which indicates that the next level down will be tested. Watch for heavy volume to come in there near the 0.382 level.
In the U.S. stock market and many other developed financial markets, about 70-80 percent of overall trading volume is generated through algorithmic trading.
Historical Price Action
Looking back to the last bull run there are a few simple patterns to watch for...
1. Weekly MACD flailing around above the zero level.
2. Mark the down trends and wait for the break.
3. Price action is above the 20 Week EMA.
Trading Setup
Using historical price action the trading setup becomes clear...
1. Weekly MACD is flailing above the zero level.
2. The down trend line is clear. Wait for the break.
3. Wait for 20 Week EMA support.
Now, the targets are the Fibonacci levels above, and the ghost bars look reasonable, however, it would be wise to take a look at what exactly is driving Gold on this path.
The U.S. Dollar
The Dollar index inversely pressures Gold prices so this is worth noting.
1. Momentum is shifting bullish as a bullish MACD divergence reveals itself on the daily chart.
2. This recent move was the 3rd wave down which often precedes a reversal.
3. The index is at the bottom of this future channel.
As this index recovers back towards the 200 Week EMA, it will surely scare the metals market. However, the macro downtrend is only on it's first wave down. From a technical standpoint, the second wave is often the deepest as panic sets in from the failed recovery.
Treasury Yields
Yields recently had a similar bullish MACD divergence with a very weak recovery that followed. The trend is still clear and it's highly likely to roll over as it timidly approaches the trendline in the coming months. Gold has been riding along side Bonds so this should continue to drive up prices. Depending on the severity of falling yields, it could trigger temporary crashes in the metals. But longer term, buying the dips is the way to go.
Trading is risky. Don't do it.
Long
Bullion: Gold, Silver, Platinum
Equities: GDX, PHYS, CEF, SLV, RIO, SPPP
Futures: (Not yet)

GDX/Gold Pinch PointDescending channel from GDX inception, and an ascending channel from the lows in 2016. GDX has had a strong close into the end of the week, we may see a breakout that will blow our socks off, or we may be left bagholding..
I will be monitoring this very closely as it seems it is all to play for...

Gold (AUD)- log chart long termGold (AUD) log long term chart. If ascending wedge fails to the downside, it is hello yellow support line.

can gold and gdx regain bullish trend above 65 day moving averaggold and gdx could regain upward momentum soon.

Gold and Sentiment, Turbo Bear?My favorite ratio for cutting through the noise is an LT view of Gold/Oz($) : HUI (the Gold Bugs Index). Generally when it rises we gold bugs suffer because the price isn't reflecting our buying habits. That's why I'm looking for the next bottom on this chart sometime in July that might coincide with this broadening wedge... A date that keeps recurring for me is June 28th, and I haven't figured why just yet..
The broadening wedge may indicate that some dramatic downside is very possible, I just hope that it's in late summer after some profit-taking. Reasons for hope here:
1] a breakdown from this channel is giving me hope, as sentiment is outstripping gold price performance.
2] it seems to coincide with deep retrace and ultimately a break below the 100Mo MA, the 30Wk Ma, and 30D Ma are firmly below. (Looking for the 30D to cross below 30Wk for TURBO BEAR)
3] downward cloud pressure is huge and respected at this time
See my previous post on GDX/Gold for another view at this pivotal time

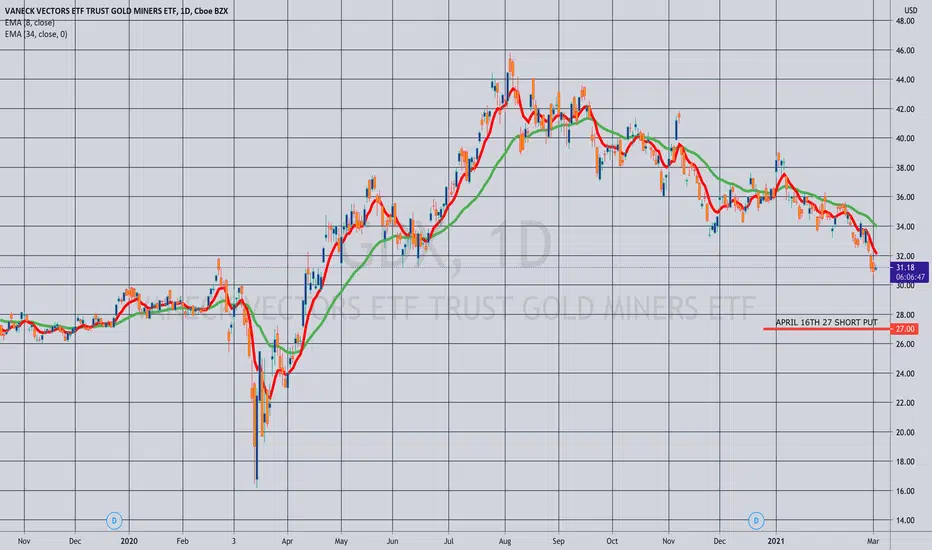
Opening (IRA): GDX April 16th 27 Short Put... for a .42/contract credit.
Notes: With 30-day at 44.5%, adding some miners out in the April monthly on this weakness. 1.58% ROC at max as a function of notional risk; 12.82% annualized. As usual, will take profit on approaching worthless or roll out/take assignment and sell call against if in the money toward expiry (whichever pays more credit).
OPENING (IRA): GDX MARCH 19TH 31 SHORT PUT... for a .60/contract credit.
Notes: With 30-day at 36.7% and expiry-specific at 39.2%, opening a 19 delta short put with a 30.40 break even in the March monthly, since I've already got some on in February. 1.97% ROC as a function of notional risk.
Will run to approaching worthless and/or roll out if in-the-money or take assignment/sell call against (whichever pays most from a credit standpoint).

GDX UpdateBounce off the gap from APR21 2020 as expected. Where we go from here will be very telling. A breach of the medium-term down channel and the .786 retracement level will be necessary for confidence, possibly materializing by end-April (29th).

Gold: We have entered a bear cycle.This long-term chart of GLD reveals that we have entered the next bearish cycle for the Gold market. This cycle of the Gold market peaked a couple of months ago and seems to be following the same trend from the last cycle. In fact, if we use the fib-retracement tool to plot the pullback from the first pulldown from the peak, we can see that GLD has bounced up and found minor support on the 100% fib trend retracement line.
We can now expect a rise to the 61.8%-38.2% levels before falling down from there again. Be careful shorting puts or going long in those levels as we may never see another ATH for months if not years.
Trade Idea: Short GLD around $171-$180.
While it is unlikely for it to keep rising higher to new ATHs anytime soon, you can set stop-losses above at a comfortable level while leaving enough wiggle room. We can expect GLD and Gold to continue to fall from those $175 levels down below the $156 fib support, and then the 148 support area. Once the price breaks those levels, we can expect a high-velocity waterfall sell-off to the $136 support area, where we can also take some profits on the way. The key support area and the final price target is the parallel channel support around $107.5-$115, which we can expect to see in anywhere from 9 months to 5 years.


GDX, is this a forgotten treasure?Hello everyone,
So Gold is finally back in a buy/accumulation zone, even though DXY may have more room to run I doubt this will translate in to heavy downside for gold. 1650 maybe? However, the stars look alligned once again to buy gold, or in this case GDX (Gold miners ETF). You can see the trade parameters in the chart. But this is definetely an opportunity like no other, whilst everyone is still lookin at Bitcoin, or Stocks, nobody is expecting a resurgence from gold at this point. However as we see volatility is not dead and gold does like volatile times. Even though this trade will take patience, and most likely won't payoff like crypto. The optimal upside is around a 150%, and in a mania case 400-600%. And the risk is -25%, I mean, it's a casual day in crypto or even stocks these days... Buying now is like buying BTC at 10k. Which BTW i've also advised in doing heavily. It's the same mantra as always - Buy low, sell high. However, most will do it the other way around.
Also check out my other ideas, even though I don't post often. When I do it's usually when things are CHEAP or EXPENSIVE.
As always, stay safe and stay liquid.
