Get ready for the $SILVER move! $SLVThe Q4 FOMC combined with mid December tax loss selling is a prime time to sneak your way back into the precious metals sector. It has been a great year for metals, and believe it or not the 4 month correction from August to December is perfectly normal and reasonable given history.
GDX

(DXY) What Really Is Driving Gold (Yields)There is much speculation across the investor universe about what influences Gold prices and vice versa. Today I will be focusing on the false theory that Gold prices lead treasury yields and that by extension, Gold signals market crashes.
The Financial Solar System
Taking a look at the chart it is clear that sometimes Gold prices parallel and slightly lead treasury yields. However, if we overlay the Dollar index it is astronomically clear that the only times that Gold does this is when the Dollar's gravitational pull temporarily alters Gold's trajectory. Gold prices at the root are inversely corelated with Treasury yields.
It is really that simple. The Treasury market is the Sun while Gold, the Dollar, and the Stock market are planets. As treasury yields ultimately dominate and inversely lead Gold prices, the Dollar acts as a secondary force.
Yields are the only pre-signal for Market crashes and it looks to me like another leg down is imminent. However, it also looks like the dollar is setting up for a relief rally which means Gold would plummet along side stocks before the Sun sling shots it to new highs.


GOLD - Cup and Handle formation. Very Bullish!GOLD - Cup and Handle formation. Very Bullish!
For shorter term, yellow channel range bound. Breakout likely to the upside.

GDX - ready to break out ?GDX is bullish against the last low. Same for GDXJ.
There's no sure thing - you trade what's in front of you.

GOLD 19 YEARS AGOThe GOLD to SPX ratio currently looks similar to 2001. Where were you 19 years ago? I know where I was and I was clearly not buying enough gold! Hindsight is clear.. or should I say 20/20? Seeing as history tends to rhyme, precious metals look like the better deal over the next decade- especially if you hold them in your possession.


Elliott Wave View: GDX Ended Correction and Ready to Resume HighElliott Wave view in $GDX suggests that the Gold Miner Index ended cycle from March low in wave ((2)) at 33.16. The Index has turned higher again in wave ((3)) with the internal unfolding as an impulse Elliott Wave structure. Gold Miners still need to break above previous wave ((1)) high on August 5 at 45.78 to avoid a double correction. Up from wave ((2)) low at 33.16, wave ((i)) ended at 34.5 and wave ((ii)) pullback ended at 33.35. Gold Miners then extended higher again in wave ((iii)) towards 36.07, and pullback in wave ((iv)) ended at 35.7. Final leg higher in wave ((v)) ended at 36.4 and this completed wave 1 in higher degree.
The Index then corrected cycle from November 24 low and ended wave 2 at 34.87. Internal of wave 2 unfolded as a double three structure where wave ((w)) ended at 35.23, wave ((x)) ended at 35.81, and wave ((y)) ended at 34.87. Up from wave 2 low, wave ((i)) ended at 36.92. Expect wave ((ii)) pullback to stay above wave 2 at 34.87, but more importantly above 33.16. As far as pivot at 33.16 low stays intact, expect dips to find support in 3, 7, or 11 swing for more upside. Potential short term target higher is 100% – 123.6% Fibonacci extension from November 24 low at 38.09 – 38.86.


THE WEEK AHEAD: GDXJ/GDX, XLE, KRE, SLV, IWM/RUTEARNINGS:
No options liquid underlyings announcing earnings this week that meet my criteria for a volatility contraction play, although ORCL (24/31) and WORK (2/33) both announce and could be played in some other way.
EXCHANGE-TRADED FUNDS RANKED BY THE PERCENTAGE THE JANUARY AT-THE-MONEY SHORT STRADDLE IS PAYING AS A FUNCTION OF STOCK PRICE:
GDXJ (14/41/12.1%)
XLE (25/41/10.4%)
KRE (23/40/10.6%)
SLV (28/41/10.2%)
GDX (15/38/10.2%)
EWZ (15/39/10.0%)
BROAD MARKET EXCHANGE-TRADED FUNDS RANKED BY THE PERCENTAGE THE JANUARY AT-THE-MONEY SHORT STRADDLE IS PAYING AS A FUNCTION OF STOCK PRICE:
IWM (23/28/7.1%)
QQQ (20/27/6.3%)
DIA (15/21/5.2%)
SPY (12/20/4.8%)
EFA (17/24/4.4%)
Pictured here is a RUT January 22nd 1655/1705 short put vertical with the short option leg camped out at the 16 delta. Markets are showing wide in the off hours, but look to get at least 10% of the width of the spread out of any play, with the preference being to put something on in a down day with the accompanying rise in volatility and expansion of the "probability cone." A smaller alternative would naturally be in IWM, where I'd look to get at least .50 out of January 22nd 162.5/167.5 5-wide.
For those who like to swim naked, the IWM January 22nd 162.5 (15 delta) and was paying 1.91 as of Friday close (1.15% ROC at max as a function of notional risk; 8.93% annualized).
* * *
On the IRA/retirement account front, I'll be looking to programmatically deploy buying power in broad market over medium to long-term time frames over the next several weeks and then turn to focusing on shorter term plays, so you're likely to see some apparently oddball things in my ideas feed that won't make a ton of sense looked at in isolation and won't be for everybody not only due to buying power effect, but due to duration. I'm using SPY here, but one can certainly do something similar in another of the cheaper (a relative term) exchange-traded funds with high liquidity that will allow you to ladder out in time without giving up too much to lack of liquidity in longer duration.
Essentially, it will look like a short put ladder, but with the rungs put on over time in increasing duration in similarly delta'd strikes or in strikes which pay a certain ROC %-age relative to the strike price (e.g., the SPY February 19th 321 short put, paying 3.27; the March 19th 300 short put, paying 3.02; the April 16th 283, paying 2.87, etc.), after which the individual rungs will be separately managed.
Although this isn't particularly buying power efficient relative to defined risk spreads, I'm shooting for a setup that is relatively set and forget running into retirement where I don't necessarily have to pop my portfolio open on a daily (or even weekly) basis to manage trades, but can go for fairly lengthy periods of time without having to touch or manage rungs and with modest expectations as to ROC %-age.
As a "quasi-cash" option, I'll also continue to deploy idle buying power in things like HYG puts (See Post Below) just that I'm not earning 0% of 0 and where I'm comfortable taking on shares and selling call against. Point in fact, that is probably not a bad stand-alone setup for an extremely conservative investor who isn't keen on taking broad market bullish assumption positions at all-time-highs where a number of people are calling "bubble" week after week. That being said, even this type of setup isn't riskless, as we saw in the March "sell everything" dip. At some point, you will potentially have to take on shares ... .


Gold (AUD)- Similarity of post-2008 GFC to Post Covid-19Gold (AUD)- Similarity of post-2008 GFC to Post Covid-19
Post crisis stimulus and slashing of interest rates, provides a tail wind to Gold.

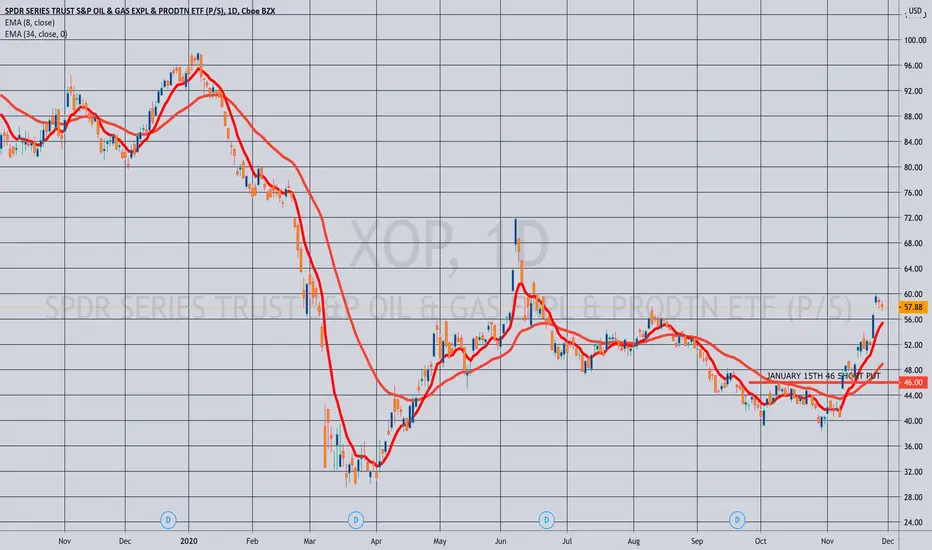
THE WEEK AHEAD: XOP/XLE, GDXJ/GDX, KRE, EWZ, IWM/RUTEARNINGS:
It's a light week for earnings announcements, which means it's an even lighter week for options liquid underlyings, none of which meet my cut-off for 30-day implied >50%.
EXCHANGE-TRADED FUNDS RANKED BY PERCENTAGE THE JANUARY AT THE MONEY SHORT STRADDLE IS PAYING AS A FUNCTION OF STOCK PRICE:
XOP (18/59/15.8%)
GDXJ (16/42/13.2%)
XLE (26/46/11.6%)
KRE (24/40/11.4%)
GDX (17/40/11.4%)
USO (7/46/11.0%)
EWZ (15/39/10.6%)
SLV (25/38/10.3%)
Honorable Mention:
GLD (23.5/18.5/5.0%)
* * *
Pictured here is an XOP January 15th 46 short put, which was paying .92 as of Friday close (2.04% ROC as a function of notional risk at max; 15.5% annualized at max). I still like bullish assumption, pandemic recovery plays in the oil space, although implied volatility has bled out quite a bit here, and the break even (45.08) would be above the 2020 lows.
GLD gets an honorable mention here due to its being nearly 15% off of its early August highs with the January 15th strike nearest the 16 delta (the 157) paying .94 as of Friday's close (.60% as a function of notional risk at max; 4.6% annualized). The ROC %-age isn't great, however, but if you're looking to establish a gold position, now might be the time to consider starting one. I'm already working one here, (See Post Below), and will consider adding once December out-of-the-money's fall off or I manage them.
Alternatively, look to establish a position in SLV, GDXJ, or the more liquid GDX, all of which are more scalable due to size and provide more bang for your buck, with the GDXJ January 15th 42 paying .70 (1.7% ROC as a function of notional risk; 12.9% annualized), the GDX January 15th 30 paying .40 (1.4% ROC at max; 10.3% annualized), and the SLV January 15th 19 paying .30 (1.6% ROC at max as a function of notional risk; 12.9% annualized at max).
For those of a defined risk bent, the GLD January 15th 153/158 short put vertical was paying .54 at the mid as of Friday close (10.8% ROC at max; 82.1% annualized).
BROAD MARKET
IWM (23/29/7.8%)
QQQ (19/25/6.9%)
DIA (16/22/5.8%)
SPY (13/21/5.3%)
EFA (16/18/4.6%)
Volatility has pissed out mightily here, and the <10% the at-the-money short straddles are paying in the January cycle are reflective of that.
The IWM January 15th 157 short put was paying .94 (.6% ROC at max as a function of notional risk; 4.6% annualized) as of Friday close, which isn't exactly great. Here, defined is more compelling from a pure ROC %-age return perspective (it usually is), with the IWM January 15th 158/163 was paying .54 as of Friday's close (10.8% ROC at max; 82.1% annualized) and its cash-settled counterpart RUT, paying 5.10 for the January 15th 1610/1660 with similar ROC %-age metrics with the short option legs camped out at the 16 delta strike. Naturally, you can be more aggressive, bringing in the setup more toward the expected move.
GOLD - WHAT IS THE DEAL WITH NOVEMBER?Gold has entered the pivot zone. The hard metal is always a hold to me personally, but it helps to study the charts to get an idea of the algorithmic driving forces and other oddities. In this case, I couldn't help but see this Nov Nov Nov trend and the math behind the madness. The pattern suggests it'll be supportive. Watch it closely the next few weeks. We need to see strength come in to confirm support and upward continuation. Do not dismiss the possibility of a deeper correction.. There's no such thing as "impossible" when in comes to financial assets.. especially in 2020-after all, we did see oil trade MINUS $37 this year. Keep an open mind while in wonderland.

AX.OZL Oz MineralsHey investors,
Gearing up for the future
Long term outlook for the company is great. technically it has a long way to appreciate from a wave perspective
regards,
Limitlesss

AX.DEG De Grey Mininghey investors
in line with the GDX position. De-grey retracement looks to be completing.
like and share our pages
regards,
limitlesss

AX.NST Northern Star ResourcesHey investors
Setup in the GDX and GLD at the moment is begging for gold miners to revert back into an upward cycle
Technically we have enough waves down to consider the formation complete and divergence is coming through stronger as the days pass
NST is one of those stocks. ASX listed
All the best. Please hit like and support the ASX listed traders on TradingView
Regards,
Limitlesss
Find us on facebook Limitlesss


When a bullish sign gets negated...Disclaimer: The above is not an investment advice. It is merely an opinion and I share it for your entertainment only. Do your own due diligence and above all, trade safely and stay safe!

GDX - gold minersThe good news is that we are approaching some serious levels
The bad news is the way we crushed the 200MA


Will it? Is it finally time?Looks like the Euro is making another attempt at breaking above trend.
Also trying to complete bull flag structure
If it breaks, will it be Armageddon? Will heads explode? Or will it be like Y2K?

GDX 45 call expiry : jan 2022 cost:2.09$ cmp:33.5 SL: below 31 GDX 45 call
expiry : jan 2022
cost:2.09$
cmp:33.5
SL: below 31
24/nov/2020
