Gold Retracement ideaXAUUSD after a huge 3500 B/O, is it finally time for a pull back? Short positions can be taken targeting lower fib levels with proper risk management. Break of ATH invalidates any further pull backs. This is only market speculation and should not be considered as financial advise
Harmonic Patterns

UBER Holding Trendline Support – Bullish Rebound SetupUber is respecting a long-term ascending trendline and has recently bounced from this key support area. RSI is also recovering from lower levels, indicating improving momentum. As long as price stays above the trendline, bullish bias remains valid; a clean break below it would invalidate this setup.

Gold prices are expected to continue rising on Monday.Gold prices are expected to continue rising on Monday.
Before analyzing gold price movements, we need to understand the following key facts:
1. 90% of global day traders are waiting for a pullback in gold prices before buying at a lower price.
2. Most central banks globally are key factors driving up gold prices.
3. Black swan events are inevitable, but their essence is often the ruthless exploitation of market blind spots for profit.
If you are currently suffering losses, or overwhelmed by the sheer number of trading strategies and mentors, how should you choose and which company's trading to follow?
In this case, you can choose to follow the trading operations in my channel. I provide real-time, transparent, and intuitive current price orders.
If you need help, I'm always here.
Below, I will briefly analyze the current basic situation of the gold market.
Last Friday, gold closed at around $4986, having touched a high of $4990 during the session, before fluctuating until the close. Clearly, Monday's opening is likely to continue the upward trend, moving towards $5,000, which is almost certainly within reach.
Therefore:
1. We should not expect a sharp, one-sided decline. We should maintain a buy-on-dips strategy.
2. The daily chart continues to show a bullish candlestick pattern with lower shadows, and has risen for five consecutive trading days. In the short term, gold prices are in a strong upward trend, and this momentum is likely to continue.
3. Geopolitical factors continue to influence the market, while major institutions continue to hold gold, which enhances the resilience of gold prices.
4. The key resistance level will remain around $5,000. This price level may act as resistance, so be wary of a short-term pullback. Avoid blindly chasing highs in the short term; patiently wait for a pullback before entering the market.
5. Once gold prices stabilize above $5,000, the next target range is $5,080 to $5,100. The target price for this week may be $5,400.
6. The key to buying on dips is buying during pullbacks. Buying after a significant drop in gold prices is the safest and most rational choice.
Last week, we achieved a profit of $21,900 per lot, with a near 100% win rate. Over the past four months, we have released nearly 200 real-time trading signals, achieving a stable overall win rate of nearly 85%.
We specialize in intraday swing trading. Such trading results are not achieved overnight. Thank you very much for your attention. If you have any trading questions, please feel free to leave me a message, and I will reply to each one.

RSI SMA Cross – BTC & ETH Multi-Timeframe TestThe RSI SMA crossover is a simple and widely used TradingView strategy, often assumed to behave consistently once “good” parameters are selected. Rather than evaluating it on a single symbol or timeframe, I tested how the same logic performs across different market environments.
For this test, I ran a parameter sweep across multiple symbols and timeframes, keeping the strategy logic fixed while varying only RSI length and SMA length within reasonable ranges. The test covered BTCUSDT and ETHUSDT across 4H, 1D, 3D, and 1W timeframes, resulting in 160 total combinations.
The goal was not to find a single optimal configuration, but to observe whether performance is driven more by indicator parameters or by the trading environment itself.
Representative Results (Risk-Adjusted)
Below are four configurations that best illustrate the results and support the overall conclusions. These were selected for balance between profitability, drawdown, and trade frequency rather than headline return alone.
1) BTCUSDT — 1D (Most Stable Overall)
RSI Length: 28
SMA Length: 50
Profit Factor: ~1.77
Trades: ~109
This configuration showed the most consistent risk-adjusted behavior across nearby parameter sets and was less sensitive to small changes than others.
2) BTCUSDT — 1D (Lower Drawdown Variant)
RSI Length: 21
SMA Length: 50
Profit Factor: ~1.70
Trades: ~121
Slightly lower profitability than the first configuration, but meaningfully lower drawdown, highlighting a trade-off between responsiveness and stability.
3) ETHUSDT — 1D (Best ETH Environment)
RSI Length: 28
SMA Length: 40
Profit Factor: ~1.55–1.60
Trades: ~110–120
ETH showed acceptable performance on the daily timeframe, but drawdowns were consistently higher than BTC under similar settings.
4) BTCUSDT — 4H (Higher Activity, Lower Stability)
RSI Length: 28
SMA Length: 40
Profit Factor: ~1.55–1.60
Trades: 400+
Lower timeframes increased trade frequency substantially but introduced significantly more drawdown and instability.
Takeaway
Across all tests, performance varied far more by symbol and timeframe than by RSI or SMA length. Small parameter changes often mattered less than the environment the strategy was applied to. Some symbol/timeframe combinations remained relatively stable, while others deteriorated quickly despite using identical logic.
The broader takeaway is that strategy performance is often environment-dependent rather than parameter-dependent. Evaluating a strategy on a single symbol or timeframe can give a misleading sense of robustness. Testing across multiple environments provides a clearer view of where a strategy holds up and where it breaks down.
I’m documenting these tests to better understand robustness, sensitivity, and how commonly used TradingView strategies behave under different market conditions.

Genius Group (GNS) looking interestingGenius Group (GNS) seems to have eeked out a low. with the court case pending and there Bitcoin holding. some good news could be on the horison. i am looking to buy at current levels with SL 0.50c with upside potential 3.00 + could even go as high as 17.00 +

BTCUSD | 30M – Range Rotation & Upside ReactionBITSTAMP:BTCUSD
After the impulsive sell-off, BTC entered consolidation and started rotating between range extremes. Recent price action shows support being defended near the lower boundary, suggesting a potential upside rotation toward the range high. This move should be treated as a range reaction, not a trend reversal.
Key Scenarios
✅ Bullish Rotation 🔄 → Reaction from range support targeting the upper range.
🎯 Target 1: 91,100
🎯 Target 2: 92,800
❌ Bearish Continuation 📉 → A decisive break and close below range support would invalidate the bullish rotation and open continuation toward lower liquidity.
Current Levels to Watch
Resistance 🔴: 91,100 – 92,800
Support 🟢: 88,600 – 88,200
⚠️ Disclaimer: This analysis is for educational purposes only. It is not financial advice. Please conduct your own research before trading.

How I Protect Capital When Trading Gold (XAUUSD)Capital First. Profit Is a Consequence.
After years of trading gold, I’ve come to a very simple conclusion:
Most traders don’t lose because their analysis is bad —
they lose because they fail to protect their capital.
Gold is a high-volatility market. It reacts aggressively to news, liquidity, and sentiment.
If risk is not controlled, one wrong trade can erase weeks of solid performance.
Below are the core principles I personally follow when trading XAUUSD.
1. Capital Protection Is the Strategy
I don’t treat risk management as a secondary task.
For me, it is the strategy.
Before every trade, the first question I ask is not:
- “How far can price go?”
But:
- “If this trade is wrong, what happens to my account?”
If the answer makes me uncomfortable, I simply don’t take the trade.
2. Small Risk Means You Can Stay in the Game
Gold often moves in the right direction —
but it can also move deeply against you before continuing.
That’s why I always:
- Keep risk per trade small
- Accept missing opportunities rather than oversizing positions
There is no such thing as a guaranteed setup.
As long as you protect your capital, opportunities will always return.
3. Stop Loss Is Non-Negotiable
I never trade gold without a stop loss.
Not because I lack confidence,
but because I understand one thing clearly:
The market owes me nothing.
A stop loss doesn’t prevent losses —
it ensures losses stay small, controlled, and survivable.
4. I Don’t Trade Every Market Condition
Not every movement is an opportunity.
I avoid trading when:
- The market is noisy and lacks structure
- Price action becomes unstable ahead of major news
- My psychological state is not optimal
Choosing not to trade is also a professional decision.
5. Psychology Protects Capital Before Any Strategy
Most drawdowns don’t come from bad systems.
They come from:
- Holding losses out of ego
- Revenge trading
- Overtrading during emotional highs
When discipline and mindset are stable,
capital protection becomes automatic.
Conclusion
Trading gold is not a race to get rich quickly.
It’s a long-term game of discipline, patience, and risk control.
My priority is simple: protect capital first.
If I do that well, profits will take care of themselves.
📌 If this post adds value, feel free to like, comment, or follow for more XAUUSD insights.
📈 Stay disciplined. Trade the process.

QCLS- Succesful bottom catchupQCLS
.
Succesful bottom catchup.
60% profit from the first plan, and the chance is still ahead.
.
US STOCKS- WALL STREET DREAM- LET'S THE MARKET SPEAK!

Gold Price Movement Analysis and Trading Strategies for Next WeeCore Support for the Bulls: Three Key Factors Solidify the Foundation for Medium- to Long-Term Rise
1.95% of Central Banks Collectively Purchase Gold, Forming Rigid Bottom Support: A recent survey by the World Gold Council on January 24th showed that 95% of over 100 central banks worldwide plan to continue increasing their gold holdings in the coming year, a near-decade high. Poland's plan to purchase 150 tons of gold, the People's Bank of China's 14 consecutive months of reserve increases, and Brazil's cumulative 43-ton increase in three months, all demonstrate this. Central banks' average monthly gold purchases of 60-70 tons are four times the normal level, and their purchasing behavior remains unchanged regardless of short-term gold price fluctuations. This creates non-price-elastic buying below 4850, acting as a "ballast" for gold price corrections.
2.Weakening Dollar Credit + Normalization of Geopolitical Games, Continued Demand for Safe-Haven Assets: The dollar's share of global foreign exchange reserves has fallen below 60%, a multi-decade low. The Greenland sovereignty dispute and tariff standoff between the US and Europe remain unresolved, and Danish pension funds are even planning to liquidate their US Treasury holdings. Market concerns about the creditworthiness of dollar assets are rising. Gold has surpassed US Treasury bonds to become the world's largest reserve asset for central banks. Its absence of sovereign credit risk makes it the optimal choice for hedging geopolitical and currency risks, attracting a continuous influx of safe-haven funds.
3.Expectations of a Fed rate cut have not completely subsided, and holding costs are low: Despite hawkish rhetoric, dovish leader Bowman emphasized the fragility of the labor market, and core inflation near the 2% target leaves room for further easing. The market still prices in a 50 basis point rate cut in 2026. CME Group tools show that although the first rate cut has been delayed until June, it has not disappeared. The opportunity cost of holding gold remains at a historically low level, supporting long-term allocation.
Gold trading strategies
buy:4950-4960
tp:4980-5000-5050

Short selling to lock in the downside potential within the rangeKey Bearish Factors (Bearish Logic)
1.Escalating Geopolitical Tariff Risks: With Trump's proposed 10% tariffs on the EU imminent, global risk appetite remains under pressure. The total market capitalization of the crypto market is shrinking, and Bitcoin, as a risk asset, is also suppressed. The Fear & Greed Index has fallen to 24, indicating extreme fear in market sentiment.
2.Accelerated ETF Outflows: Bitcoin spot ETFs have experienced a period of net outflows. Institutional investors are cautious in their entry, and insufficient new funds are making it difficult to support a price breakthrough above the key $90,000 level.
3.Heavy Selling Pressure at the $90,000 Level: $90,000 is a psychological watershed for the market and also a previous area of concentrated consolidation. When the price rebounds to this range, short-term profit-taking and short-term selling pressure surges, making a significant breakout difficult without sufficient volume.
4.Bearish sentiment in the derivatives market: The Bitcoin long/short ratio on major exchanges has fallen back to around 1.64, indicating a rise in short-term bearish sentiment in the market. Open interest in options has increased, volatility has rebounded, and the divergence between bulls and bears has widened, but bears have the upper hand.
Bitcoin trading strategy
sell:89000-90000
tp:88000-87000

TSLA BEFORE EARNIGSTSLA (1D) printed a clear rejection into the 500 area, with heavy sell-side supply flagged around ~497 (distribution). Price is now pivoting back above the 435 weekly support, suggesting buyers are absorbing dips while the trendline support remains intact.
Institutional read (flow/volume):
~497–500: supply/distribution zone (notable sell print).
~435: weekly support acting as absorption; holding this keeps the upside scenario active.
~400: daily support + open gap area; if 435 breaks, this becomes the first magnet.
Targets
Target (up): 500 first. Clean reclaim/acceptance above 500 opens 580.
Target (down): Loss of 435 targets 400 (gap/daily support). Below 400 = 350, then 330–300 demand.

#Bitcoin Sunday Update $BTC is currently trading around 89k. #Bitcoin Sunday Update
CRYPTOCAP:BTC is currently trading around 89k. It has been nearly five months since I flipped bearish, and my view remains unchanged. I am continuing to hold my short positions.
Why?
Geopolitical Tensions: I expect global instability to rise again, which will likely cause the stock market to drop while Gold and Silver continue their pump.
FOMC Meeting: All eyes are on the Federal Reserve this week. We’re seeing "insiders" selling non-stop at these levels. 😂
Right now, BTC is holding the 1W99EMA (around 86,400) quite strongly. However, once we get a candle close below that level, my next target is the 72k region. I have already added to my shorts at 97k and will look to add more if the market provides higher entries as you can see in the chart.

XAUUSDHello Traders! 👋
What are your thoughts on GOLD?
Gold has experienced a fast and impulsive rally over the past weeks, reaching the psychological $5,000 level. While this move highlights strong bullish momentum, buying at these levels carries elevated risk.
From a technical perspective, the overall trend remains bullish, with price still trading within a well-defined ascending channel. However, as price approaches the upper boundary of the channel, a corrective move (pullback) is increasingly likely.
Probable Scenario:
After this sharp rally, price is expected to correct toward the key support zone. This area could provide a more favorable low-risk buying opportunity in line with the dominant trend. A bullish reaction from this support may pave the way for new all-time highs.
In the short term, this week’s FOMC meeting could have a significant impact on gold’s price action and may increase volatility.
The bullish trend remains intact, but chasing price at current levels is not recommended. Waiting for a pullback and confirmation around support levels would be the smarter strategy..
Don’t forget to like and share your thoughts in the comments! ❤️

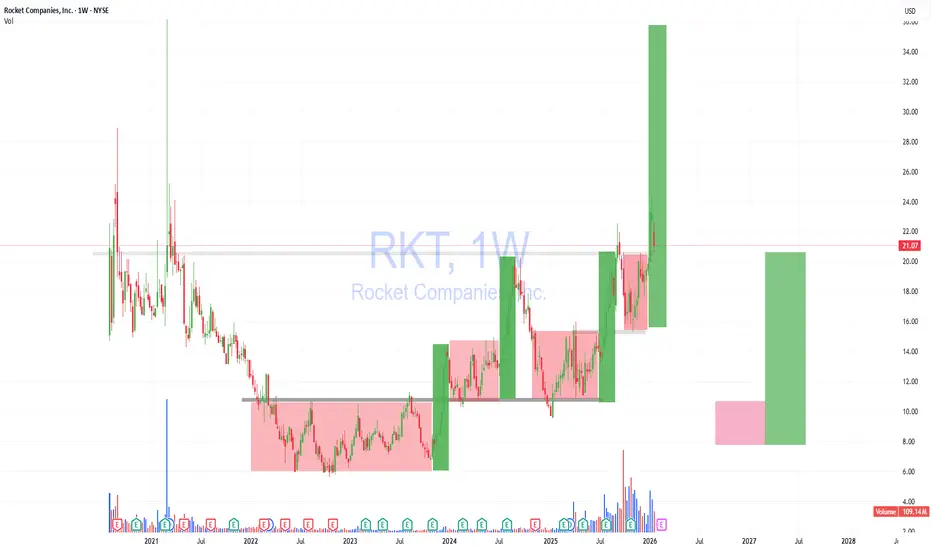
RKT: What are you seeing?
RKT
.
Instead of overcomplicating technical analysis, the market is really just a few candlestick patterns like these.
.
US STOCKS- WALL STREET DREAM- LET'S THE MARKET SPEAK!
MSFT AFTER EARNINGSMSFT is still trading inside a corrective structure after a clear rejection into the 554–555 supply zone (noted as heavy sell-side distribution). Price is now reacting off the 450–440 demand band, where bids are absorbing sell pressure and defending structure.
Institutional flow read
Distribution/supply: 554–555 (major sell-side inventory overhead).
Absorption/demand: 450–440 (buyers defending; if this fails, liquidity likely flushes into the lower imbalance).
Key levels
Support: 450–440 (pivot demand)
Breakdown trigger: < 440
Resistances: 480, then 500–510 (key reclaim area)
Upper imbalance: ~520–530 (gap zone)
Major supply cap: 554–555
Targets
Upside target (if 480 reclaims and holds): 500–510 first, then 520–530 (gap fill), extension to 554–555 (supply)
Downside target (if 440 breaks): 420–390 (gap magnet), then 343 area as the next larger support

GE AFTER EARNINGSGE (1D) is in a clear uptrend, but price just got rejected from the 306–333 supply band, signaling active distribution overhead. The sell impulse back into 290–280 puts the spotlight on whether this is a controlled pullback (absorption) or the start of a deeper reset.
Key structure
Major rejection/supply: 306–333 (failed acceptance above 306 and sharp rotation lower).
Near-term decision zone (demand/absorption): 290–280.
Next support (if 280 fails): 271, then 265–255 (larger demand pocket).
Open downside magnet if momentum accelerates: 200 (gap), then 193–195 (heavy distribution marker).
Institutional read (distribution vs absorption)
The 306–333 area behaves like an inventory unload zone: repeated pushes higher were sold and price could not hold the highs, followed by a decisive drop.
290–280 is the first place where you want to see absorption: tighter candles, failed breakdowns, and quick reclaim above 295. If buyers are real, they defend 280 and force price back into the 295–306 range.
A clean daily close below 280 suggests sellers still control liquidity and are likely driving price toward 271 and the 265–255 pocket to reload.
Scenarios & targets
Bull scenario (pullback holds / absorption confirmed)
Trigger: reclaim and hold 295–296 after defending 290–280 (ideally with a strong close back above 295).
Upside targets:
295–306 (first re-test / resistance reclaim zone)
333–335 (major supply re-test)
Extension if trend resumes: 345+ (only after acceptance above 333)
Bear scenario (support breaks / distribution continues)
Trigger: daily close below 280 (failed reclaim) = sellers keep control.
Downside targets:
271 (first stop/liquidity)
265–255 (next demand pocket; expect reaction here)
200 (gap fill magnet if 255 fails)
193–195 (deeper distribution marker)
Invalidation / risk framework
For longs: 280 is the line in the sand. Below 280 on a daily closing basis, the probability shifts to a move toward 271 → 265–255.
For shorts: 306 is the key reclaim level. Acceptance back above 306 weakens the bearish thesis and increases odds of a 333 retest.

TheGrove | GBPUSD SELL | Day Trading AnalysisYou can expect a reaction in the direction of selling from the specified Breakout zone
GBPUSD moving higher as it tests the strong resistance area..
We expect a bearish move from the confluence zone.
Hello Traders, here is the full analysis.
I think we can soon see more fall from this range! GOOD LUCK! Great SELL opportunity GBPUSD
I still did my best and this is the most likely count for me at the moment.
-------------------
Traders, if you liked this idea or if you have your own opinion about it, write in the comments. I will be glad 🤝

XAUUSD (Gold Spot) 15-Min Chart – Bullish Continuation SetupGold is trending bullish within an ascending channel after a clear break of structure (BOS) and multiple change of character (CHoCH) confirmations. Price is currently holding above key support around 4930–4922, with upside targets near 4987 and 5098. Fair Value Gap (FVG) below suggests a possible retracement zone before continuation higher. Overall bias remains bullish unless price breaks below the highlighted support.

7203Aggressive Long (Break & Hold)
Entry: Above 825 (3H close + retest hold)
SL: < 780
TP1: 845
TP2: 880
TP3: 950

Grab Holdings Ltd (GRAB) – Macro Reversal Setup (3D Timeframe)hi traders
This technical analysis evaluates the 3-day (3D) chart of GRAB, identifying a potential long-term trend reversal following a significant period of accumulation at historical lows.
1. Technical Setup: The Structural Bottom
Since its peak, GRAB has undergone a massive correction and has spent the last several years carving out a definitive floor.
Ascending Support: The chart shows a well-defined ascending trendline that has been supporting the price since mid-2022. Every touch of this line has resulted in higher lows, indicating steady accumulation by long-term buyers.
The Breakout Pivot: Price is currently pushing through a local consolidation zone around the $4.58 level. A decisive close above the recent local highs confirms that the momentum has shifted from bearish/sideways to bullish.
Momentum (RSI): The RSI (14) is trending upward, currently sitting around 45.41. There is ample "room to run" before the stock reaches overbought territory on this macro timeframe.
2. Fibonacci Profit-Taking Targets
Based on the Fibonacci retracement levels plotted from the $18.00 high to the $2.27 low, we have identified the following key targets for this recovery cycle:
Target 1 (0.786 Fib): $5.64 – Initial major resistance and a psychological level.
Target 2 (0.618 Fib): $8.29 – The "Golden Pocket" target, indicated by the red arrow on the chart. This is a high-probability zone for a significant trend test.
Target 3 (0.500 Fib): $10.15 – A critical mid-point target marked with a flag, representing a return to double-digit pricing.
Target 4 (0.382 Fib): $12.02 – Major structural resistance level.
Target 5 (0.236 Fib): $14.32 – Final major target before a potential retest of the all-time highs.
3. Fundamental Context
Grab continues to strengthen its position as the leading "super-app" in Southeast Asia. With the company reaching sustained profitability and showing strong growth in both its deliveries and mobility segments, the fundamental floor is now firmly established. This technical breakout aligns with the market's shifting perception of GRAB as a mature, profitable growth entity rather than a speculative startup.
Conclusion
The 3-Day setup on GRAB presents a classic "rounding bottom" or "ascending triangle" breakout. With the stock successfully holding its macro trendline and beginning to clear local resistance, the path of least resistance points toward the $8.29 and $10.15 Fibonacci levels in the coming quarters.

TheGrove | USDJPY Buy | Idea Trading AnalysisUSDJPY is falling towards a support level which is a pullback support and could bounce from this level to our take profit.
We expect a decline in the channel after testing the current level which suggests that the price will continue to rise
Hello Traders, here is the full analysis.
I think we can soon see more fall from this range! GOOD LUCK! Great BUY opportunity USDJPY
I still did my best and this is the most likely count for me at the moment.
-------------------
Traders, if you liked this idea or if you have your own opinion about it, write in the comments. I will be glad 🤝

Copper (HG) – The Macro Breakout (Weekly Timeframe)hi traders
If you missed GOLD and SILVER, don't miss on COPPER.
This analysis evaluates the long-term price action of Copper, identifying a historic breakout that aligns with a broader commodities supercycle.
1. Market Context: The Metals Bull Run
The commodities sector is currently experiencing a powerful synchronized rally. We expect Copper to follow the lead of the Gold and Silver bull markets. As investors seek hedges against monetary debasement and industrial demand for the "green energy transition" intensifies, Copper is positioned to be a primary beneficiary of this capital rotation.
2. Technical Setup: Decades of Consolidation
The chart shows that Copper has spent nearly 15 years (2011–2025) consolidating within a massive structural base.
The Breakout: Price has decisively cleared the critical $5.92 resistance (marked as the '1' level on the Fibonacci chart).
Support Confirmation: We are currently seeing a "breakout and hold" formation. This transition from a decade-long resistance to new support is one of the most powerful bullish signals in technical analysis.
Volume: The volume profile indicates significant institutional accumulation over the last several years, providing the "fuel" for the projected upward move.
3. Fibonacci Extension Targets (Next 2-5 Years)
Based on the Fibonacci extensions applied to the macro structure, we have identified several high-conviction targets for the coming years. Every level shown is a strategic profit-taking zone:
Target 1 (1.618 Fib): $8.39 - The initial objective for the first major leg of the breakout.
Target 2 (2.618 Fib): $12.37 - A major structural target where the bull market enters its parabolic phase.
Target 3 (3.618 Fib): $16.36 - Long-term value objective.
Target 4 (4.236 Fib): $18.82 - The ultimate target for this secular cycle.
4. Fundamental Drivers
Supply Deficit: Global copper inventories remain at historical lows while new mining projects face significant lead times.
Monetary Correlation: High correlation with precious metals (Gold/Silver) suggests that as long as the broader "hard assets" theme continues, Copper will likely outperform equities.
Conclusion
Copper is currently "breaking the chains" of a 15-year range. With a confirmed breakout above $5.92 and a supportive macro environment for metals, the path of least resistance is significantly higher. Investors should view the Fibonacci levels up to $18.82 as the roadmap for the next several years of growth.

Bitcoin harmonic theory and pathThere's a lot going on in the chart, for now this is my theory. Right now I see an anti Gartley on the chart, we run down into the B area and then bounce, the bounce could take us up into the mid $90Ks which would then close the small CME gap between $92,940 and $93,045 which then forms a Head and shoulders with B being the neckline.
As I said above, this is a theory of mine right now, we could also just keep running it down into the D point of the harmonic, but nothing goes up and down in a straight line. My previous post on btc hit on the button and is now closed for me at this point.
This isn't financial advice, stay safe.....
