Is it Bear flag on weeklyHello Everyone, All I am seeing strong Bear flag pattern, it can be a fake out but higher chances that it may break downwards and touch around 67-69 area. I am still opened to either side but leaning towards bearish side currently. Let's see how does it go.
Harmonic Patterns

Oracle: A Deep-Value Contrarian Play in the AI BuildoutOracle Corporation (NYSE: ORCL), a legacy tech giant undergoing a radical transformation, finds itself at a critical juncture. Its shares have been under intense pressure, trading down approximately 43% from their September 2025 all-time high. This sell-off reflects a palpable investor anxiety: skepticism over the company's ability to convert an unprecedented wave of capital expenditure into near-term profits, and concern over the burgeoning debt required to fund its ambitious artificial intelligence (AI) infrastructure buildout. However, a closer examination reveals a company with unparalleled forward revenue visibility, a disciplined and margin-focused growth strategy, and a valuation that may have excessively priced in worst-case scenarios. This combination creates a compelling, albeit high-stakes, investment opportunity for patient capital.
The Crown Jewel: Unprecedented Multiyear Revenue Visibility
The most formidable pillar of the bull case is Oracle's staggering backlog, officially termed Remaining Performance Obligations (RPO). As of Q2 FY2026, this figure stands at $523 billion—a 433% year-over-year increase. This is not merely a speculative pipeline; it represents signed, long-term cloud infrastructure contracts with the world's most demanding technology companies, including Nvidia and Meta Platforms.
The scale of this backlog is almost surreal, dwarfing even the company's own elevated FY2026 revenue guidance of $67 billion. It provides exceptional multiyear visibility and de-risks the top-line trajectory in a way few public companies can claim. Critically, the near-term conversion is already accelerating: the portion of RPO expected to be recognized within the next 12 months grew 40% year-over-year, up from 25% in the prior quarter. Management has quantified this, anticipating $4 billion of incremental revenue in FY2027 from the new contracts added in the latest quarter alone. This isn't hope; it's contracted future revenue waiting for data center capacity to come online.
Disciplined Execution: Pursuing Growth with Margin Guardrails
Contrary to the narrative of reckless spending, Oracle is demonstrating notable capital discipline. The company is not pursuing "growth at any cost." It strategically signs massive contracts only when key operational prerequisites are locked in: secured land and power availability, favorable supply economics for critical components like GPUs, and confirmed engineering capacity to build and manage the infrastructure.
Furthermore, Oracle has provided a clear profitability target for its AI endeavor: gross profit margins of 30% to 40% for its AI data centers. This focus on unit economics is crucial. It signals that Oracle intends for its cloud infrastructure business (OCI) to be a high-margin engine, not a loss-leading scale play. This margin framework provides a future lens through which to model the immense earnings potential as the $523 billion RPO gradually converts.
Navigating the Capital Challenge: Innovative Financing and Debt Concerns
The elephant in the room is funding. Building a global AI cloud network requires monumental capital expenditure. While debt has increased, Oracle's management is proactively exploring innovative, off-balance-sheet funding structures to limit borrowing and preserve financial flexibility. These include arrangements like customer-owned chips and supplier-leased chips, which would significantly reduce Oracle's upfront cash outlays. This creative approach to financing a capex super-cycle is a critical differentiator and helps mitigate one of the market's primary fears.
Nevertheless, risks persist. The debt load is substantial, and investor concerns are compounded by uncertainties surrounding key clients like OpenAI and their ability to fund their own massive compute bills. The specter of an "AI bubble" burst that could leave Oracle with stranded, underutilized assets is a valid macro risk that cannot be dismissed.
Valuation & Technical Analysis: Mapping the Risk/Reward
From both a fundamental and technical perspective, the current price appears to discount an excessive amount of pessimism.
Fundamental Valuation: At approximately 24-29x forward earnings, Oracle's multiple is reasonable for a company with its growth profile and unparalleled contracted backlog. It sits at a discount to many pure-play cloud and AI peers, especially considering the revenue certainty its RPO provides.
Technical Perspective & Key Levels:
The steep decline has brought the stock into a zone where long-term value and technical support converge, defining a clear risk/reward framework:
Initial Support & Rally Point at ~$169.63 (0.618 Fibonacci): This level represents a key Fibonacci retracement zone and a logical area for the stock to stabilize and attempt a reversal. Holding here would suggest the recent sell-off was a deep but healthy correction within a longer-term uptrend.
Major Support & Strategic Value Zone at ~$121.76 (0.786 Fibonacci): This deeper level represents a more extreme bear-case scenario. A decline to this area would likely coincide with peak fears of an AI downturn or a significant execution stumble. For long-term believers, this zone would represent a potentially historic buying opportunity, as it would price in catastrophic assumptions about contract cancellations and margin collapse.
Take-Profit Target at ~$236.87 (0.382 Fibonacci Retracement of the Fall): A return to this area represents the first major technical hurdle and a logical profit-taking zone for a recovery trade. Achieving this target would imply a regaining of market confidence, supported by concrete quarterly evidence of RPO conversion and margin progress. It frames a significant upside potential from current levels.
Final Assessment: A High-Conviction, High-Stakes Recovery Bet
Oracle presents a classic contrarian opportunity. The market is fixated on the near-term costs and risks of its AI odyssey, overlooking the sheer magnitude and quality of its secured future revenue stream. The company is not building on speculation; it is building to fulfill already-signed contracts with industry titans.
While execution risks around debt, client concentration, and macro AI cycles are real, the current valuation and technical setup suggest these risks are overwhelmingly reflected in the price. The path forward will be volatile, likely oscillating between the $169 support and the $237 target as quarterly results provide proof points of execution.
For investors with a multi-year horizon and the fortitude to withstand volatility, Oracle at these levels offers a compelling bet on a foundational player in the AI infrastructure layer. It is a wager that the company's unmatched backlog, disciplined margin targets, and innovative financing will ultimately translate into a powerful earnings growth story that the market is currently unwilling to see.

XAUUSD | GOLD BUY SETUP ACTIVE XAUUSD | GOLD BUY SETUP ACTIVE
🔓 Entry: 4510 – 4505
❌ Stop Loss: 4488
🎯 Target: 4538
Gold is holding above a strong demand zone with bullish market structure intact. The pullback looks corrective, and buyers are stepping in, indicating continuation toward higher levels. As long as price respects the support and stays above the stop, bullish momentum is expected to drive price toward the target.
📌 Gold buy setup active
⚠️ Educational purpose only. Trade with proper risk management.

AVAXUSDT Forming Falling WedgeAVAXUSDT is forming a clear falling wedge pattern, a classic bullish reversal signal that often indicates an upcoming breakout. The price has been consolidating within a narrowing range, suggesting that selling pressure is weakening while buyers are beginning to regain control. With consistent volume confirming accumulation at lower levels, the setup hints at a potential bullish breakout soon. The projected move could lead to an impressive gain of around 70% to 80% once the price breaks above the wedge resistance.
This falling wedge pattern is typically seen at the end of downtrends or corrective phases, and it represents a potential shift in market sentiment from bearish to bullish. Traders closely watching AVAXUSDT are noting the strengthening momentum as it nears a breakout zone. The good trading volume adds confidence to this pattern, showing that market participants are positioning early in anticipation of a reversal.
Investors’ growing interest in AVAXUSDT reflects rising confidence in the project’s long-term fundamentals and current technical strength. If the breakout confirms with sustained volume, this could mark the start of a fresh bullish leg. Traders might find this a valuable setup for medium-term gains, especially as the wedge pattern completes and buying momentum accelerates.
✅ Show your support by hitting the like button and
✅ Leaving a comment below! (What is your opinion about this Coin?)
Your feedback and engagement keep me inspired to share more insightful market analysis with you!

Possible XAUUSD Pre NY moveswe eiter will take byuys side liquidity first which have more chances then winn retarace to the opening gap of today

NOMUSDT Forming Falling WedgeNOMUSDT is forming a clear falling wedge pattern, a classic bullish reversal signal that often indicates an upcoming breakout. The price has been consolidating within a narrowing range, suggesting that selling pressure is weakening while buyers are beginning to regain control. With consistent volume confirming accumulation at lower levels, the setup hints at a potential bullish breakout soon. The projected move could lead to an impressive gain of around 140% to 150% once the price breaks above the wedge resistance.
This falling wedge pattern is typically seen at the end of downtrends or corrective phases, and it represents a potential shift in market sentiment from bearish to bullish. Traders closely watching NOMUSDT are noting the strengthening momentum as it nears a breakout zone. The good trading volume adds confidence to this pattern, showing that market participants are positioning early in anticipation of a reversal.
Investors’ growing interest in NOMUSDT reflects rising confidence in the project’s long-term fundamentals and current technical strength. If the breakout confirms with sustained volume, this could mark the start of a fresh bullish leg. Traders might find this a valuable setup for medium-term gains, especially as the wedge pattern completes and buying momentum accelerates.
✅ Show your support by hitting the like button and
✅ Leaving a comment below! (What is your opinion about this Coin?)
Your feedback and engagement keep me inspired to share more insightful market analysis with you!

AVAXUSDT UPDATEAVAX
UPDATE
AVAX Technical Setup
Pattern: Falling Wedge Pattern
Current Price: $12.45
Target Price: $36.00
Target % Gain: 189.16%
Technical Analysis: AVAX is showing signs of breaking out of a falling wedge pattern on the 1D chart, indicating bullish potential if price can sustain above the wedge resistance. The current price action has held above key support levels, and a confirmed breakout with rising volume could validate continuation toward the $36.00 target zone measured from the wedge.
Time Frame: 1D
Risk Management Tip: Always use proper risk management.

NOMUSDT UPDATENOM
UPDATE
NOM Technical Setup
Pattern: Falling Wedge Pattern
Current Price: $0.00787
Target Price: $0.02500
Target % Gain: 218.21%
Technical Analysis: NOM is breaking out of a falling wedge pattern on the 1D chart, indicating bullish potential. The price has recently surged above the resistance trendline, supported by renewed buying interest. This breakout setup suggests the possibility of continuation toward the projected target zone near $0.02500, assuming the breakout holds and momentum sustains.
Time Frame: 1D
Risk Management Tip: Always use proper risk management.

BERAUSDT UPDATEBERA
UPDATE
BERA Technical Setup
Pattern: Falling Wedge Pattern
Current Price: $0.60 USDT
Target Price: $1.02 USDT
Target % Gain: 69.80%
Technical Analysis: BERA is showing signs of breaking out of a falling wedge pattern on the 1D chart, indicating bullish potential. The price has recently climbed toward the resistance trendline, suggesting buyers are stepping in after a period of compression. A successful breakout above the wedge’s descending resistance could validate a continuation toward higher resistance levels near the projected target zone.
Time Frame: 1D
Risk Management Tip: Always use proper risk management.

$IWM — Macro Catalyst + VolanX Framework📊 AMEX:IWM — Macro Catalyst + VolanX Framework
Macro Context
Small caps remain high-beta beneficiaries of:
Anticipated rate cuts / easing expectations
Liquidity rotation from mega-cap concentration into risk-on assets
Improving financial conditions index (FCI) → easing credit stress
Russell 2000 historically outperforms late-cycle when liquidity turns positive before earnings inflect.
VolanX Macro Thesis
Market is transitioning from distribution → re-accumulation
Volatility compression + range acceptance = energy storage phase
This is where asymmetric upside typically initiates, not at breakout highs
🔬 Technical Structure (15m / HTF confluence)
Key demand zone: 250.9 – 251.2
Prior value acceptance + fib cluster
Price holding above range equilibrium
VolanX DSS shows:
No bearish displacement
Higher-lows forming inside value
Expansion target aligns with HTF liquidity pocket
🎯 VolanX Projection
Continuation scenario favored while above demand
Upside liquidity objective: 258+
Invalidated only on sustained loss of equilibrium (not wicks)
🧠 VolanX Insight
Breakouts are loud.
Re-accumulation is quiet.
Capital is positioned before narratives become consensus.
This is structure-first, not headline-driven.
⚠️ Not financial advice.
Built & analyzed using VolanX Protocol
WaverVanir International LLC
#IWM #Russell2000 #Macro #Liquidity #SmallCaps #VolanX #MarketStructure #TradingView #WaverVanir

ETHEREUM AT CRITICAL LEVELS The instrument ETHUSDT is at critical levels seeing the inverted Cup & Handle formation and the trend based FIB projections.... the ETH dominance chart is also indicating a movement towards strong support level that will define the move forward for the ETHEREUM.
What are your views ????

Elise | BTCUSD | 30M – Sell-Side Sweep → Bullish ReversalBITSTAMP:BTCUSD
BTC swept sell-side liquidity around the 86,800–87,000 zone, triggering stop losses before aggressively reversing upward. This impulsive move signals institutional accumulation, not retail buying. The current pullback is corrective in nature, and as long as price holds above the swept low, continuation toward buy-side liquidity remains the primary expectation.
Key Scenarios
✅ Bullish Case 🚀
If price holds above 88,400–88,600, continuation toward buy-side liquidity is likely.
🎯 Target 1: 89,800
🎯 Target 2: 90,200 – 90,400 (Buy-Side Liquidity Pool)
❌ Bearish Case 📉
A 30M close below 87,000 invalidates the bullish setup and signals failed displacement.
Current Levels to Watch
Resistance 🔴: 89,800 → 90,400
Support 🟢: 88,400 / 87,000
⚠️ Disclaimer: This analysis is for educational purposes only. Not financial advice.

SLV DIC 2025SLV (1D) is in a strong impulsive leg, but price is now pressing into the higher supply pocket below the 70 area. The 70 level is the primary rejection zone on this structure; any push into 70 that fails to hold should be treated as distribution unless SLV can accept above it and build value.
Key structure:
70 = major resistance / potential blow-off supply.
62–58 = the “decision” zone. The 62 and 58 gaps matter: as long as price holds above them, dips are more likely absorption and continuation.
58 = first major support. Losing 58 shifts the tape from trend to correction.
50 = major institutional pivot (heavy distribution previously seen around this area). If the market revisits 50, expect two-way trade: either absorption for a higher low, or continuation lower if 50 fails.
45–40 = deeper support band. The 45 gap becomes a magnet if 50 breaks.
Institutional read (flow logic):
Above 58, pullbacks are likely being absorbed (buyers defending prior breakout/gap structure).
A sharp rejection near 70, especially with expanding range, would signal late-cycle distribution (profit-taking / supply hitting bids).
A controlled drift down into 62–58 followed by stabilization would be the cleaner “re-accumulation” look.
Targets:
Upside target: 70 (major supply). If acceptance above 70 occurs, extension targets can open above that level, but 70 is the first objective.
Downside target: 50 (institutional pivot). If 50 fails, next downside target is 45, then 40.
Execution framework:
Bullish scenario: As long as SLV holds 58, look for continuation setups with 70 as the primary target. Best continuation is a pullback that holds 62–58 and reclaims momentum.
Bearish scenario: A rejection at/near 70 followed by a break below 58 increases odds of a deeper mean reversion into 50. If price loses 50 with acceptance, expect the 45 gap to start pulling price lower toward 45–40.
Invalidation cues:
Bulls lose edge on a clean daily acceptance below 58.
Bears lose edge if SLV accepts above 70 and holds that level as support on retests.

WTI OIL on its 1D MA50 again. Sell signal.Last week (December 17, see chart below) we gave a strong Buy Signal on WTI Crude Oil (USOIL) after it hit and rebounded on the 8-month Support.
The resulting rally easily hit our $58.50 Target and today the price tests the 1D MA50 (blue trend-line) for the first time since the previous Lower High of the 5-month Channel Down. This is an automatic technical Sell Signal as at the same time the 1D RSI is reversing near its 4-month Resistance Zone.
Our short-term Target is again the $55.20 Support.
---
** Please LIKE 👍, FOLLOW ✅, SHARE 🙌 and COMMENT ✍ if you enjoy this idea! Also share your ideas and charts in the comments section below! This is best way to keep it relevant, support us, keep the content here free and allow the idea to reach as many people as possible. **
---
💸💸💸💸💸💸
👇 👇 👇 👇 👇 👇

26/12/2025 $BTC - $DXY -$SPX - $NDX - $GOLD forecastPositive energy across all indexes except CRYPTOCAP:BTC which will see a negative inflexion starting 9:00 am utc to fully develop after the post 12:00 utc session

26 Dec 2025 — BTR Report- No Trading Day📌 BTR Indicator did NOT generate any signal today in BSE LTD.
➡️ That means Today is a NO Trading Day.
➡️ No Signal = No Trade.
➡️ No Trade = No Loss.
This is exactly how professional trading discipline looks.
We don’t chase trades.
We don’t force entries.
We simply follow the system.
🔑 Key Reminder
The strength of BTR is clarity.
Some days we book profits.
Some days we protect capital by doing nothing.
In trading, doing nothing is also a trade — the right one.
🚫 No Emotion • No FOMO • Only Rules
BTR Indicator is designed for:
✔ Intraday Traders
✔ Options Traders
✔ Rule-Based Discipline
❌ No Noise
❌ No Overtrading
📍Where to Find BTR
👉 Open my TradingView Profile → Scripts
👉 Add BTR Indicator to your charts
👉 Trade with confidence, not guesses
Follow BTR.
Follow Discipline.
Trade Smart. 📈
NSE:BSE

EthereumETHUSD
- Bearish Channel as an corrective pattern in Long Time Frame
- RSI - Divergence
- Break of Structure
- Symmetrical Triangle in Short Time Frame
- Change of Characteristics

Nifty Harmonic Bull Cycle: Channel Breakout Targets Ahead✅ 1. Price Structure & Trend Channel Analysis
Long-Term Rising Channel
Nifty continues to respect the multi-month rising channel.
Current price trades near the midline of that channel — typically a zone where continuation moves often launch toward the upper boundary (your TG2/TG3 zone).
Second Phase Bull Formation
Your harmonic sequence (X-A-B-C-D) shows a completed retracement and re-entry into bullish swing.
The upward symmetry of Phase 1 and Phase 2 suggests a mirrored target projection — exactly where TG2 & TG3 sit.
Critical Trend Line
The diagonal corrective trend line is being tested repeatedly.
As long as candles do not close below this, bullish continuation probability remains strong.
📈 2. Indicator-Based Probabilities (Derived From Price Behavior)
A. Momentum Structure
After the recent retracement, the bullish impulse candles remain larger than the bearish pullback candles → continuation bias.
B. Volume & Volatility Behavior
Pullback volume looks weaker while bullish legs show expansion → accumulation phase still active.
C. Multi-Timeframe Confluence
H4 + Daily both align with higher-high, higher-low swing construction.
Daily close above 25,950–26,020 zone will trigger a momentum breakout.
🎯 3. Target Timing Projection (Your Requested Part)
Based purely on the chart price action:
⏳ Reaching TG2 – 26325
High probability within the current month, due to:
Compression against trendline → breakout behavior typical
Strong harmonic leg projection
No major resistance until 26,300 zone
December seasonality historically favors bullish continuation
Probability: ~70–75% based on price structure alone
⏳ Reaching TG3 – 26474
Most likely around mid-next month, because:
TG3 lies near the upper channel boundary
Markets often consolidate after reaching TG2
Break to TG3 usually needs:
Follow-through buying
A fresh momentum push (often seen early next month)
Probability: ~60% based on extension leg geometry
📌 4. Key Levels to Watch
Immediate Supports
25,780 / 25,650 (trendline retest)
25,400 (swing invalidation level)
Breakout Confirmation
Daily candle close above 26,020
Upside Targets
TG1 – 26089 → Done/Very near
TG2 – 26325 → Likely this month
TG3 – 26474 → Likely mid-next month
📝 5. Summary
Structure remains strongly bullish inside a rising channel.
Harmonic pattern suggests another upward impulse is pending.
TG2 this month: High chance
TG3 mid-next month: Moderate-High chance
As long as Nifty holds above the critical diagonal trendline, the bullish roadmap remains intact.
⚠️ Disclaimer
I am not a SEBI-registered analyst. This study is for educational purposes only. The chart analysis is my own perspective; ChatGPT only helped refine the wording and format. Please do your own analysis before trading.

SiLVER: $75| Building a Short Positiona Billionaire once said that
when you see something parabolic
coupled with coordinated news releases
in major networks
thats the time to BOOK YOUR GAiNS on the way up
or eyeball the mylti year channel to Size in Your SHORTS
for Contrarian Speculators only
as when you see it on Social Media and Prints
you are probable late to the PARTY
Risk OFF Silver time to upsize on BiTCOiN

HUDCO Swing Trade Setup📊 Price Action & Trend Analysis
Analyzing market trends using price action, key support/resistance levels, and candlestick patterns to identify high-probability trade setups.
Always follow the trend and manage risk wisely!
Price Action Analysis Interprets Market Movements Using Patterns And Trends On Price Charts.
👉👉👉Follow us for Live Market Views/Trades/Analysis/News Updates.

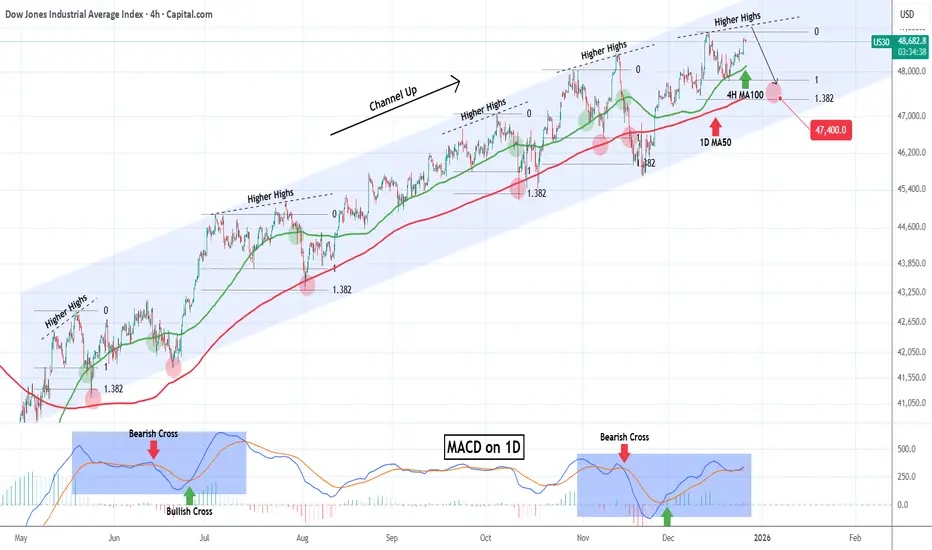
DOW JONES headed towards a rejection.Dow Jones (DJI) has been trading within a nearly 8-month Channel Up and is close to its All Time High (ATH) after rebounding last week on its 4H MA100 (green trend-line).
This pattern is cyclical and every time the latter support broke after a medium-term rally from its 1D MA50 (blue trend-line), the index got rejected on a Higher Highs trend-line and corrected back to the 1D MA50. Even the 1D MACD is printing a sequence similar to June - July.
As a result, we expect the new year to find Dow on its 1.382 Fibonacci extension at 47400 at least, which is the Fib level that every such correction pulled back to.
---
** Please LIKE 👍, FOLLOW ✅, SHARE 🙌 and COMMENT ✍ if you enjoy this idea! Also share your ideas and charts in the comments section below! This is best way to keep it relevant, support us, keep the content here free and allow the idea to reach as many people as possible. **
---
💸💸💸💸💸💸
👇 👇 👇 👇 👇 👇
Gold Trade Plan 24/12/2025Dear Traders,
XAUUSD (Gold) Technical Analysis – 30-Minute Timeframe
📅 December 24, 2025
Market Structure
The short-term trend is bullish.
Price is moving inside a well-defined ascending channel (blue lines).
A rising trendline (black) is acting as a dynamic support.
Key Levels
Major Support Zone:
Highlighted blue box around 4450 – 4460
This zone represents:
Lower boundary of the ascending channel
Strong horizontal support
Previous reaction area
Resistance Levels:
Minor resistance: 4500 – 4510
Major resistance: 4550 – 4560 (upper boundary of the channel)
Possible Scenarios
🔹 Bullish Scenario (Primary Scenario)
Price pulls back toward the 4450–4460 support zone
Support holds and a bullish reversal candle forms (Pin bar / Engulfing)
Price resumes upward movement toward:
Target 1: 4510
Target 2: 4550 – 4560 (channel high)
📌 This scenario aligns with the overall bullish market structure and has a higher probability.
🔹 Deeper Correction Scenario (Less Likely)
A strong breakdown below 4460 with candle close
Price exits the ascending channel
Further downside correction (not confirmed yet)
Trading Summary
Market Bias: Buy on dips
Best opportunities:
Long entries near channel support
Short positions only if:
Support breaks clearly, or
Strong rejection appears at channel resistance with confirmation
Regards,
Alireza!

GOLD - The market may update its ATH after a correction...FX:XAUUSD bounces off 4475 and updates its local maximum in the distribution phase to 4519.4. Against the backdrop of low liquidity associated with the end of the calendar year, movements may be sharp and unpredictable...
The fundamental background remains unchanged, supporting gold: a weak dollar, tense geopolitical situation, mixed data from the US. However, the main problem at the moment is low liquidity due to the holidays.
The Asian market bought up the supply and drove up the price. After such a strong movement, the market may enter a consolidation or correction phase, during which it may test 4508-4500 before rising.
Resistance levels: 4519, 4526, 4550
Support levels: 4508, 4500
A low-liquidity market is easier to manage (in terms of manipulation). Accordingly, use strong setups and short targets for trading, as movements can be sharp and unpredictable.
I expect the bull market to continue after the correction.
Best regards, R. Linda!
