Elise | XAUUSD – 30M – Bullish Continuation SetupOANDA:XAUUSD
After the impulsive sell-off, XAUUSD shifted into a recovery phase with steady bullish candles. The current pullback into demand is corrective, not impulsive, which supports the idea of continuation higher. Buyers are defending this zone aggressively, and a bullish reaction here opens the path toward higher liquidity and previous highs.
Key Scenarios
✅ Bullish Case 🚀 →
Sustained support above 4,880–4,920 keeps bullish momentum intact.
🎯 Target 1: 5,150 – 5,200
🎯 Target 2: 5,400 – 5,450 (Major Resistance / Liquidity Zone)
❌ Bearish Case 📉 →
A clean breakdown and close below 4,880 would weaken the bullish structure.
🎯 Downside Target: 4,750 – 4,700
Current Levels to Watch
Resistance 🔴: 5,150 / 5,450
Support 🟢: 4,920 – 4,880
⚠️ Disclaimer: This analysis is for educational purposes only. Not financial advice.
Harmonic Patterns

BTC - Ultimate Swing Short Update - Next Stop 8,000Update on my BTC Ultimate Swing Short Plan:
Take Profits 1, 2 hit
Take Profit 3 approaching
Next Movement:
Straight to 8,000
No longer anticipating 3 wave corrective pattern
Happy Trading
- DD

Is the Rally Just for Selling? A Bearish Scenario for XAGUSDXAGUSD is currently showing that a short-term bearish trend is clearly dominating, as both news-driven factors and technical structure fail to support a sustainable bullish reversal. The broader macro backdrop continues to favor the U.S. dollar, with U.S. Treasury yields remaining elevated and expectations that the Fed will not ease policy anytime soon , keeping capital flows cautious toward precious metals such as silver.
On the H4 timeframe, after a sharp sell-off that decisively broke the prior bullish structure , the current price action appears to be nothing more than a technical rebound. XAGUSD remains below the Ichimoku cloud, signaling that short- to medium-term control is still firmly in the hands of sellers , and that the recovery lacks the strength required to shift overall market conditions.
The 98.0–98.5 zone is now acting as a key resistance area. This zone previously served as support and has since flipped into resistance, reinforcing its technical significance. Repeated rejection from this area would further validate the bearish continuation scenario.
If XAGUSD fails to break and hold above this resistance , the higher-probability outcome is a renewed move lower, with an initial target near 80, followed by a deeper decline toward the 75.6 support zone. In the current environment, the most rational strategy remains selling rallies in line with the trend , rather than attempting to catch bottoms against prevailing momentum.

Gold Rejected at Resistance: A Signal for Further Decline?XAUUSD is currently trading in a clearly defined bearish trend , as each recovery attempt has been repeatedly rejected at the descending trendline and overhead resistance zone. The current price structure suggests the market is not ready for a true reversal , but is instead forming technical pullbacks within a dominant downtrend.
From a fundamental perspective, the US dollar remains strong amid expectations that the Fed will maintain a cautious stance on interest rates , with no convincing signals of an early easing cycle. This increases the opportunity cost of holding gold and continues to place downward pressure on prices in the short term . At the same time, temporarily easing geopolitical tensions have reduced the urgency for safe-haven demand, making gold’s rebounds less sustainable.
On the chart, price is reacting strongly around the 4,960 – 4,982 zone, which aligns with horizontal resistance and the edge of the Ichimoku cloud. The repeated rejection from this area clearly indicates that sellers remain in control of the trend. As long as price stays below this resistance zone, any upward move should be viewed only as a selling opportunity in line with the primary bearish trend.
The preferred short-term scenario remains “rally to sell” . If price fails to hold above 4,982 and shows signs of weakness, XAUUSD is likely to revisit recent lows, with the potential for a deeper extension toward the 4,360 target zone.

TheGrove | USDJPY Buy | Idea Trading AnalysisEURJPY is moving on Resistance AREA..
The chart is above the support area, which has already become a reversal point twice.
We expect a decline in the channel after testing the current level and moving to resistance line
We expect a decline in the channel after testing the current level
Hello Traders, here is the full analysis.
I think we can soon see more fall from this range! GOOD LUCK! Great BUY opportunity USDJPY
I still did my best and this is the most likely count for me at the moment.
-------------------
Traders, if you liked this idea or if you have your own opinion about it, write in the comments. I will be glad ⚜️

Oracle - The worst drawdown ever!💣Oracle ( NYSE:ORCL ) will ends its bearmarket soon:
🔎Analysis summary:
Over the past five months, Oracle has been correcting more than -60%. And while we can clearly witness a major selloff, Oracle is also approaching a major support area. And if we see bullish confirmation in the near future, Oracle might even create new all time highs.
📝Levels to watch:
$125
SwingTraderPhil
SwingTrading.Simplified. | Investing.Simplified. | #LONGTERMVISION

XAUUSDHello Traders! 👋
What are your thoughts on GOLD?
Gold printed a new all-time high before facing a sharp bearish rejection from the highlighted resistance zone. Following this strong sell-off, price dropped aggressively toward the 4400 support area, where buyers stepped in and prevented further downside.
After reacting positively to this key support, Gold rebounded and is now trading around the 4900 level. Based on the current price structure and Fibonacci retracement levels, we expect this recovery to extend toward the upper resistance zone near the 0.618 Fibonacci level.
However, this resistance area is considered a high-probability rejection zone, and from there, a bearish reaction could occur, potentially pushing price back toward the trendline support and lower Fibonacci targets.
Don’t forget to like and share your thoughts in the comments! ❤️

XAUUSD – Uptrend stalls, deeper correction riskAfter a strong and sustained rally, gold prices have encountered significant resistance around the 4,980–5,000 USD zone. The current upside momentum is showing clear signs of fading, as subsequent rebounds have failed to print new highs. Instead, a sequence of lower highs has emerged — a classic signal that selling pressure is returning to the market.
Notably, recent recovery attempts have been consistently rejected at the upper resistance area, indicating that buyers no longer have sufficient strength to sustain the short-term uptrend. As price loses its previous bullish structure and slips below key support levels, the outlook increasingly points toward a deeper corrective phase, rather than a simple short-lived pullback.
If the 4,980–5,000 USD resistance zone continues to hold, I expect the market to remain under downside pressure, with a potential move toward the 4,700–4,670 USD support zone — an area where price may react and attract dip-buying interest. The combination of lower highs, weak rebounds, and repeated rejections at resistance is laying the groundwork for a more structured short-term decline.
➡️ Primary scenario: Price is rejected around 4,980–5,000 USD → continues correcting toward the 4,700–4,670 USD support zone.
⚠️ Risk scenario: A decisive breakout and sustained move above 5,100 USD would invalidate the bearish setup, potentially opening the door for an upside extension toward 5,180–5,200 USD.
If this perspective resonates with you, or if you are tracking an alternative scenario for XAUUSD, feel free to share your thoughts in the comments below. I look forward to the discussion.

Silver Is Trapped Between Supply and DemandOn the H1 timeframe, Silver is currently trading inside a well-defined range, bounded by a clear resistance zone above and a strong support zone below. The prior sell-off into support was impulsive, signaling liquidation rather than a gradual trend change. However, the sharp reaction from the support zone shows that buyers are actively defending this area, preventing further downside expansion.
From a price action standpoint, the recovery off support has been constructive but overlapping. Price failed to reclaim the resistance zone and was rejected again near the EMA cluster, confirming that sellers remain active at higher levels. This behavior suggests range rotation rather than a new impulsive trend the market is oscillating between supply and demand, not trending.
The primary scenario is continued rotation within the range. As long as the support zone holds, price may attempt another push higher toward resistance. A clean breakout and acceptance above the resistance zone would be required to shift the structure bullish and open the door for trend continuation.
The alternative scenario activates if price breaks below the support zone with strong momentum and acceptance. Such a move would invalidate the range structure and likely lead to a deeper bearish continuation toward lower demand levels.
In summary, Silver is in a decision phase. Buyers are defending support, but sellers are still firmly in control at resistance. Until one side clearly wins, patience is key and trades should respect the range boundaries rather than anticipate a breakout.

USDCAD: AB=CD pattern forming, price is expected to drop heavy!The USDCAD pair has two key areas where the price could reject. These areas hold potential and could serve as order blocs. The first entry is expected to be more accurate and likely to occur. However, if it doesn’t respect our level and breaks through the region, the price is likely to head towards the second zone of reversal. Focus on both areas rather than just the first, as we need to consider all market possibilities. Good luck and trade safely.
Like and comment for more. Thanks.
Team Setupsfx_

Bitcoin’s Critical Fortress: 1-Day Swing Analysis | TraderTilki Greetings my friends,
I analyzed Bitcoin for you on the 1-day timeframe.
Yesterday, many of my followers asked me to do a Bitcoin analysis because a lot of people got liquidated. I was truly sorry for their losses. You know, each of my followers is important to me. You are my valuable followers, I cannot ignore you.
Friends, right now Bitcoin’s key support fortress is at the $80,000 level. If Bitcoin falls below $80,000, it will first drop to $75,000 and then quickly to $70,000.
However, if it holds at $80,000, it can reach $90,000–$95,000 levels.
The most critical point here is the $80,000 level.
Please stay safe, improve your risk management and psychological control. Technical analysis accounts for only 10% of success. It is not the most important factor — the key is trading experience, risk management, and psychological discipline.
My friends, I share these analyses thanks to every single like I receive from you. I sincerely thank all my friends who support me with their likes.
Respect and love

05.02.26 Daily ForecastPairs on Watch -
FX:EURUSD
FX:GBPUSD
FX:NZDUSD
A short overview of the instruments I am looking at for today, multi-timeframe analysis down to what I will be looking at for an entry. Enjoy!

GBPUSD H4: Correction Before the Next Bullish ExpansionHi!
GBPUSD is currently transitioning into a short-term corrective phase after showing signs of trend exhaustion near the upper boundary of the ascending channel. Following the strong impulsive rally, price failed to sustain momentum at the channel top and has since reacted lower, signaling that buyers are stepping back temporarily.
The recent decline has brought price back below the internal trendline and short-term structure, with prior support now acting as near-term resistance. This shift suggests that any rebound toward the 1.3650–1.3700 area is more likely to be sold into, rather than developing into a fresh impulsive move higher.
From a structural perspective, the broader trend remains bullish, but the current price action favors further downside testing first. I expect GBPUSD to continue correcting toward the 1.3550–1.3600 demand zone, where previous accumulation and channel support converge. This area is key to watch for signs of stabilization or bullish reaction.
As long as price holds above the lower boundary of the ascending channel, this pullback should be viewed as a healthy retracement within a broader uptrend, not a reversal. A successful defense of support could open the door for the next bullish leg, targeting 1.3750 initially, and potentially extending higher as momentum rebuilds.
In summary, short-term bias is corrective to bearish, while medium-term structure remains constructive. I’m treating rallies as corrective until price reclaims broken structure — patience around support will be critical for the next directional move.

PayPal ($PYPL) – Macro Double Bottom (Monthly Timeframe)hi traders
This technical analysis evaluates the long-term price action of PayPal ( NASDAQ:PYPL ), identifying a high-conviction reversal setup as the stock tests historical support levels.
1. Technical Setup: The Double Bottom
The most significant development on the monthly chart is the formation of a massive Double Bottom structure at the $51.36 support level.
First Bottom: Established in late 2023, where the price found significant buying interest after a historic decline from the $300+ range.
Second Bottom (Current): The price has returned to the $51-$53 zone in early 2026. Successfully defending this floor for a second time validates the strength of the support and suggests a shift in the supply/demand balance.
Descending Resistance: A long-term red descending trendline has capped the price for over four years. A breakout above this line is the primary confirmation needed for a sustained trend reversal.
2. Moving Averages & Momentum
EMA Alignment: The stock is currently trading well below its 20, 50, 100, and 200-period EMAs. This indicates extreme vertical exhaustion. As the price begins to stabilize, these moving averages will act as "magnets" for a mean-reversion move.
Consolidation: The narrow range of the recent monthly candles suggests that selling pressure has dried up, and a period of accumulation is underway.
3. Recovery Roadmap & Targets
Based on the structural flags and measurement boxes indicated on the chart, we have identified two primary recovery objectives:
Target 1: ~$82.12 (+58.04%)
This target aligns with the previous structural peak and the primary descending resistance line. A move to this level would represent a significant relief rally and a test of the macro trend change.
Target 2: ~$135.53 (+44.29% from Target 1)
This is the long-term recovery objective. It aligns with a major historical breakdown point and the 100-period EMA. Reaching this target would signify a full "V-shaped" or "U-shaped" macro recovery for the stock.
4. Fundamental Context
PayPal remains a dominant force in global fintech. Despite facing increased competition, its massive user base and consistent cash flow generation provide a strong fundamental "floor." The current technical bottoming process suggests that the market has finally priced in the competitive headwinds, transitioning the stock from a "growth-at-any-price" asset to a "deep value" recovery play.
Conclusion
The Monthly setup on PYPL is a textbook example of a macro value reversal. With a confirmed double bottom at $51.36, the risk-to-reward ratio for long-term investors is exceptionally favorable, targeting a multi-stage recovery toward the $82 and $135 levels over the coming years.

BTCUSDT Forming Bullish MomentumBTCUSDT is forming a clear bullish momentum pattern, a classic bullish reversal signal that often indicates an upcoming breakout. The price has been consolidating within a narrowing range, suggesting that selling pressure is weakening while buyers are beginning to regain control. With consistent volume confirming accumulation at lower levels, the setup hints at a potential bullish breakout soon. The projected move could lead to an impressive gain of around 70% to 75% once the price breaks above the wedge resistance.
This bullish momentum pattern is typically seen at the end of downtrends or corrective phases, and it represents a potential shift in market sentiment from bearish to bullish. Traders closely watching BTCUSDT are noting the strengthening momentum as it nears a breakout zone. The good trading volume adds confidence to this pattern, showing that market participants are positioning early in anticipation of a reversal.
Investors’ growing interest in BTCUSDT reflects rising confidence in Bitcoin’s long-term fundamentals and current technical strength. If the breakout confirms with sustained volume, this could mark the start of a fresh bullish leg. Traders might find this a valuable setup for medium-term gains, especially as the pattern completes and buying momentum accelerates.
✅ Show your support by hitting the like button and
✅ Leaving a comment below! (What is your opinion about this Coin?)
Your feedback and engagement keep me inspired to share more insightful market analysis with you!

EURUSD Outlook: Bearish Momentum Below 1.1835EUR/USD Technical Analysis
📅 Date: February 4, 2026
💵 Current Price: 1.1815 (Approx.)
📍 Pivot Point: 1.1835
📉 Bearish Scenario (Main Trend)
The price is currently trading below the pivot level of 1.1835. As long as it remains under this zone, the bearish momentum is expected to continue:
Target 1: Support level at 1.1790.
Target 2: If the price breaks 1.1790 and stabilizes below it with a 1-hour or 4-hour candle close, the downtrend will strengthen towards 1.1745.
📈 Bullish Scenario (Alternative Case)
If the price manages to break above the pivot level of 1.1835 and stabilizes:
Target: The trend will shift to bullish, aiming for 1.1900.
📍 Key Technical Levels
Resistance (Upside): 1.1900 | 1.1930
Support (Downside): 1.1790 | 1.1745
💡 Market Sentiment: The EUR/USD pair is facing pressure due to the recent strengthening of the US Dollar, influenced by expectations of a more hawkish Fed policy. Traders should watch for a confirmation close below 1.1790 to confirm the next leg of the sell-off.

BTC - More Confluence Points to 7,000 Bottom Watch Bitcoin to hold the level of 66,800-67,400 as resistance
If this occurs and we begin dropping at extreme speed - our ultimate bottom
Is 6,900 to 7,800 range
Be cautious today - it’s very possible, as I’ve been saying for months now.
- Dick Dandy

GOLD (XAUUSD)CAPITALCOM:GOLD
Gold is currently showing bearish price action, with rejection from higher levels and weakness in short-term market structure. Price remains below key resistance, indicating continued selling pressure.
Unless gold can reclaim and hold above these resistance zones, downside continuation toward lower support areas remains possible. Overall bias stays bearish while price trades below these levels.
This outlook is based on technical observations only and represents a personal market view.
Disclaimer:
This analysis is for educational and informational purposes only.
It is not financial advice. Market conditions may change at any time.
Always apply proper risk management and perform your own analysis.

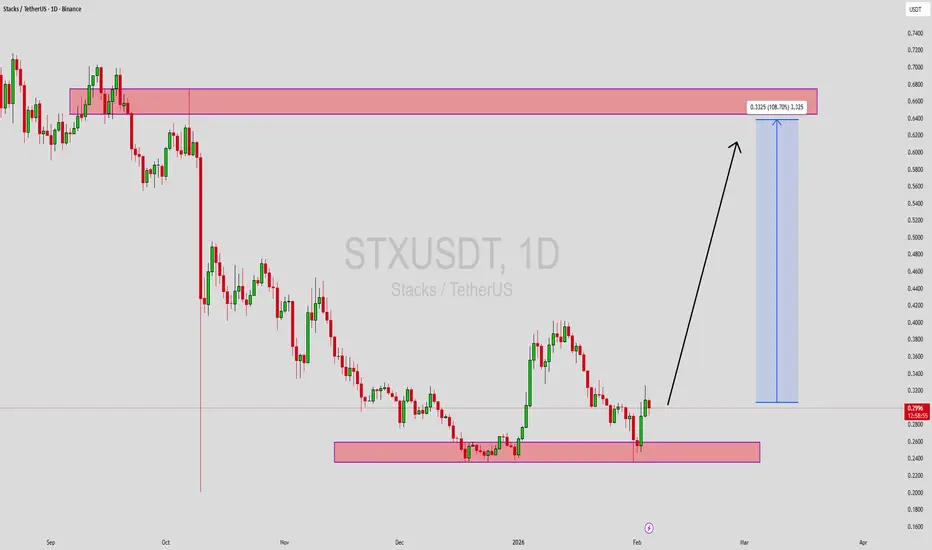
STXUSDT Forming Bullish MomentumSTXUSDT is forming a clear bullish momentum pattern, a classic bullish reversal signal that often indicates an upcoming breakout. The price has been consolidating within a narrowing range, suggesting that selling pressure is weakening while buyers are beginning to regain control. With consistent volume confirming accumulation at lower levels, the setup hints at a potential bullish breakout soon. The projected move could lead to an impressive gain of around 90% to 100% once the price breaks above the wedge resistance.
This bullish momentum pattern is typically seen at the end of downtrends or corrective phases, and it represents a potential shift in market sentiment from bearish to bullish. Traders closely watching STXUSDT are noting the strengthening momentum as it nears a breakout zone. The good trading volume adds confidence to this pattern, showing that market participants are positioning early in anticipation of a reversal.
Investors’ growing interest in STXUSDT reflects rising confidence in the project’s long-term fundamentals and current technical strength. If the breakout confirms with sustained volume, this could mark the start of a fresh bullish leg. Traders might find this a valuable setup for medium-term gains, especially as the pattern completes and buying momentum accelerates.
✅ Show your support by hitting the like button and
✅ Leaving a comment below! (What is your opinion about this Coin?)
Your feedback and engagement keep me inspired to share more insightful market analysis with you!
XAUUSD – H2 Technical OutlookXAUUSD – H2 Technical Outlook: Bullish Structure Rebuild as Precious Metals Surge | Lana ✨
Precious metals are back in focus as silver surges sharply, adding momentum to the broader metals complex. In this context, gold is showing signs of structure rebuilding after a healthy correction, setting the stage for potential continuation.
📈 Market Structure & Technical Context
After a strong impulsive drop, gold successfully defended the 4,420–4,450 strong support zone, where buyers stepped in decisively. Since then, price has been forming higher lows along an ascending trendline, signalling a shift from distribution into recovery.
The current price action suggests this move is corrective-to-bullish, not just a short-lived bounce.
🔍 Key Levels to Watch
Strong Support: 4,420 – 4,450
This zone remains the structural base. As long as price holds above it, bullish scenarios stay valid.
Mid Resistance / Reaction Zone: ~5,050 – 5,080
Price is currently consolidating here, absorbing supply after the rebound.
Next Resistance: ~5,135
A clean break and acceptance above this level would confirm continuation strength.
Upper Targets: ~5,300 – 5,350
Aligned with Fibonacci extensions and prior supply zones.
Higher Objective: ~5,580
Only in play if bullish momentum accelerates across the metals market.
🎯 Bullish Scenarios
If gold continues to respect the upper trendline and holds above the 5,000 psychological level:
A brief pullback into 5,000–5,050 could offer structure for continuation.
Acceptance above 5,135 opens the path toward 5,300+.
Strong momentum, supported by silver’s breakout, could extend moves toward 5,580.
Any pullbacks toward support are currently viewed as constructive corrections, not weakness.
🌍 Intermarket Insight
Silver’s sharp rally highlights renewed demand across precious metals, often acting as a leading signal for broader sector strength. This backdrop supports the idea that gold’s recent correction was a reset, not a reversal.
🧠 Lana’s View
Gold is rebuilding its bullish structure step by step. The focus is not on chasing price, but on how price reacts at key levels. As long as structure and momentum remain aligned, the broader trend stays constructive.
✨ Stay patient, respect the zones, and let the market confirm the next expansion.

DOW JONES giving a strong Sell Signal at the top.Dow Jones (DJI) has been consolidating for exactly the past 1 month, ranging within Resistance 1 and the Support Zone, with the current rebound coming off its 1D MA50 (grey trend-line) as well.
The 4H RSI is testing its Lower Highs trend-line and every time the index touched it, we had a strong Sell Signal. As a result, we turn bearish here yet again on the short-term, targeting 48400.
---
** Please LIKE 👍, FOLLOW ✅, SHARE 🙌 and COMMENT ✍ if you enjoy this idea! Also share your ideas and charts in the comments section below! This is best way to keep it relevant, support us, keep the content here free and allow the idea to reach as many people as possible. **
---
💸💸💸💸💸💸
👇 👇 👇 👇 👇 👇

TheGrove | AUDUSD SELL | Day Trading AnalysisAUDUSD is moving on support area..We expect a bearish move from the confluence zone.
We expect a decline in the channel after testing the current level
Hello Traders, here is the full analysis.
I think we can soon see more fall from this range! GOOD LUCK! Great SELL opportunity AUDUSD
I still did my best and this is the most likely count for me at the moment.
-------------------
Traders, if you liked this idea or if you have your own opinion about it, write in the comments. I will be glad ⚜️

ETHEREUM Channel Down got oversold but this isn't the bottom!Ethereum (ETHUSD) is extending its losses as, following the January 14 rejection on its 1D MA100 (green trend-line), it made a Lower High on its 4-month Channel Down that kick-started the new Bearish Leg.
The 1D RSI turned oversold (below 30.00) for the first time since November 21 2025 but besides a (potential) short-term dead-cat-bounce towards the 0.382 Fibonacci retracement like on November 10 2025, it should bottom lower, at least at $1900 making a -44.80% decline (at least), similar to the previous Bearish Leg, before any meaningful longer term relief rally.
Technically, the strongest pressure zone (demand at this point) is the 1385 Support of the April 09 2025 Low.
---
** Please LIKE 👍, FOLLOW ✅, SHARE 🙌 and COMMENT ✍ if you enjoy this idea! Also share your ideas and charts in the comments section below! This is best way to keep it relevant, support us, keep the content here free and allow the idea to reach as many people as possible. **
---
💸💸💸💸💸💸
👇 👇 👇 👇 👇 👇
