Bearish drop off?Aussie (AUD/USD) is reacting off the pivot and could drop to the overlap support that aligns with the 61.8% Fibonacci retracement.
Pivot: 0.6718
1st Support: 0.6666
1st Resistance: 0.6752
Disclaimer:
The opinions given above constitute general market commentary and do not constitute the opinion or advice of IC Markets or any form of personal or investment advice.
Any opinions, news, research, analyses, prices, other information, or links to third-party sites contained on this website are provided on an "as-is" basis, are intended to be informative only, and are not advice, a recommendation, research, a record of our trading prices, an offer of, or solicitation for, a transaction in any financial instrument and thus should not be treated as such. The information provided does not involve any specific investment objectives, financial situation, or needs of any specific person who may receive it. Please be aware that past performance is not a reliable indicator of future performance and/or results. Past performance or forward-looking scenarios based upon the reasonable beliefs of the third-party provider are not a guarantee of future performance. Actual results may differ materially from those anticipated in forward-looking or past performance statements. IC Markets makes no representation or warranty and assumes no liability as to the accuracy or completeness of the information provided, nor any loss arising from any investment based on a recommendation, forecast, or any information supplied by any third party
Harmonic Patterns

Potential bullish rise?Loonie (USD/CAD) has bounced off the pivot and could rise to the overlap resistance.
Pivot: 1.3810
1st Support: 1.3748
1st Resistance: 1.3975
Disclaimer:
The opinions given above constitute general market commentary and do not constitute the opinion or advice of IC Markets or any form of personal or investment advice.
Any opinions, news, research, analyses, prices, other information, or links to third-party sites contained on this website are provided on an "as-is" basis, are intended to be informative only, and are not advice, a recommendation, research, a record of our trading prices, an offer of, or solicitation for, a transaction in any financial instrument and thus should not be treated as such. The information provided does not involve any specific investment objectives, financial situation, or needs of any specific person who may receive it. Please be aware that past performance is not a reliable indicator of future performance and/or results. Past performance or forward-looking scenarios based upon the reasonable beliefs of the third-party provider are not a guarantee of future performance. Actual results may differ materially from those anticipated in forward-looking or past performance statements. IC Markets makes no representation or warranty and assumes no liability as to the accuracy or completeness of the information provided, nor any loss arising from any investment based on a recommendation, forecast, or any information supplied by any third party

Bearish reevrsal off Fib confluenceSwissie (USD/CHF) is rising towards the pivot, which is an overlap resistance and could reverse to the 1st support, which is a pullback support.
Pivot: 0.7992
1st Support: 0.7934
1st Resistance: 0.8025
Disclaimer:
The opinions given above constitute general market commentary and do not constitute the opinion or advice of IC Markets or any form of personal or investment advice.
Any opinions, news, research, analyses, prices, other information, or links to third-party sites contained on this website are provided on an "as-is" basis, are intended to be informative only, and are not advice, a recommendation, research, a record of our trading prices, an offer of, or solicitation for, a transaction in any financial instrument and thus should not be treated as such. The information provided does not involve any specific investment objectives, financial situation, or needs of any specific person who may receive it. Please be aware that past performance is not a reliable indicator of future performance and/or results. Past performance or forward-looking scenarios based upon the reasonable beliefs of the third-party provider are not a guarantee of future performance. Actual results may differ materially from those anticipated in forward-looking or past performance statements. IC Markets makes no representation or warranty and assumes no liability as to the accuracy or completeness of the information provided, nor any loss arising from any investment based on a recommendation, forecast, or any information supplied by any third party

ICP/USDT at Make-or-Break Zone - Reversal or Further Sell-Off?ICP/USDT on the Weekly (1W) timeframe is still moving within a long-term downtrend structure after failing to hold above the $20 area. Price has now moved lower and is currently testing a very strong historical demand zone at $3.215 – $2.200 (yellow box).
This zone previously acted as a major accumulation base before the strong bullish impulse in early 2024. Price reaction in this area will be a key determinant for the medium- to long-term trend direction.
---
Structure & Chart Pattern
Primary Trend: Bearish (Lower High & Lower Low still valid)
Current Phase: Major Demand Zone Test / Accumulation Area
Market Structure:
Breakdown from the previous consolidation structure
Price has returned to the lowest historical support area
Volatility Spike:
Presence of an extreme long lower wick → strong rejection from lower prices & potential smart money buying
---
Key Levels
Major Demand Zone:
🟨 $3.215 – $2.200 (critical make-or-break zone)
Step-by-Step Resistance Levels:
$4.580
$6.850
$10.950
$14.550
Major Supply / Higher Timeframe Resistance:
$18.830 – $20.985
---
Bullish Scenario
The bullish scenario becomes valid if and only if:
Price holds above the $3.215 – $2.200 demand zone
A weekly higher low or bullish weekly close is formed
Followed by a break and close above $4.580
Bullish Targets (Step-by-Step):
1. $4.580 (structure retest)
2. $6.850 (mid resistance)
3. $10.950 (major breakout confirmation)
4. $14.550 – $18.830 (bullish continuation zone)
📌 Note:
As long as price holds above the demand zone, ICP has the potential to form a long-term accumulation base for a major reversal.
---
Bearish Scenario
The bearish scenario will play out if:
Price records a strong weekly close below $2.200
The major demand zone fails to hold
Bearish Implications:
Breakdown of historical support
Increased risk of extended panic selling
Price may enter lower price discovery
Bearish structure becomes stronger and fully validated
📌 $2.200 is the final psychological and technical boundary.
---
Conclusion
ICP is currently at a critical long-term decision point.
The $3.215 – $2.200 zone represents a major decision area:
Holding the zone → potential reversal & accumulation
Breaking the zone → extreme bearish continuation
Aggressive positioning is not recommended until a clear weekly close confirmation is observed.
---
#ICP #ICPUSDT #Altcoin #CryptoAnalysis #AltcoinAnalysis #WeeklyChart #MarketStructure
#DemandZone #SupportResistance #Downtrend #PotentialReversal
#SmartMoney

Bullish bounce off overlap support?Cable (GBP/USD) is falling towards the pivot, which has been identified as an overlap support and oculd bounce to the 1st resistance.
Pivot: 1.3422
1st Support: 1.3347
1st Resistance: 1.3530
Disclaimer:
The opinions given above constitute general market commentary and do not constitute the opinion or advice of IC Markets or any form of personal or investment advice.
Any opinions, news, research, analyses, prices, other information, or links to third-party sites contained on this website are provided on an "as-is" basis, are intended to be informative only, and are not advice, a recommendation, research, a record of our trading prices, an offer of, or solicitation for, a transaction in any financial instrument and thus should not be treated as such. The information provided does not involve any specific investment objectives, financial situation, or needs of any specific person who may receive it. Please be aware that past performance is not a reliable indicator of future performance and/or results. Past performance or forward-looking scenarios based upon the reasonable beliefs of the third-party provider are not a guarantee of future performance. Actual results may differ materially from those anticipated in forward-looking or past performance statements. IC Markets makes no representation or warranty and assumes no liability as to the accuracy or completeness of the information provided, nor any loss arising from any investment based on a recommendation, forecast, or any information supplied by any third party

Buy audusdwe are monitoring audusd for a buying opportunity in this zone, audusd is trading in an uptrend and currently is in a correction phase in which it is approaching the trend at red and green support and resistance area.
Trade safe,

Dogecoin price confirming a rejection?Doge coin has seen an impulsive reaction from the $0.11 support and value area low, resulting in multiple bullish engulfing candles before rejection from the $0.15 region.
Price is now trading back below the Point of Control, indicating that bulls have lost immediate momentum.
As long as price remains below $0.15 resistance, the market favors a potential rotation lower, with the 0.618 Fibonacci level acting as the next downside target where price may fill inefficiencies and look for a bounce.
From a market structure perspective, Dogecoin is currently at resistance, and a short-term corrective move remains the likely scenario unless buyers reclaim higher ground

Demand Broken — Is Gold Entering a Deeper Corrective Phase?Gold has transitioned from a bullish impulse into a clear structural shift on H1. After failing to sustain acceptance above the recent highs, price has rolled over and broken below a key demand zone, signaling that bullish control has weakened materially.
The latest downside move is impulsive in nature, not corrective. This confirms that the prior bullish structure has been disrupted, and the market is now operating in a bearish-to-corrective transition phase, with sellers regaining short-term control.
The former demand zone around the 4,430 area has now been cleanly broken and accepted below, turning it into a potential resistance on any retest. Price is also trading decisively below the EMA 50, which has started to flatten and roll over a classic sign of momentum shift rather than a shallow pullback.
Overhead, the supply zone near 4,465–4,480 remains intact and untested, reinforcing the bearish bias as long as price stays below that region.
Resistance (Supply):
4,450–4,470 (former demand → supply flip)
4,465–4,480 (major supply zone)
Support:
4,390 (next structural downside target)
Below 4,390 opens room for deeper continuation
EMA / Dynamic Level:
EMA 50 around 4,450 (bearish dynamic resistance)
➡️ Primary Scenario:
Price retests the broken 4,430–4,450 zone from below and shows rejection. This would confirm a classic break-and-retest continuation, opening the path toward the 4,390 level as the next downside objective.
⚠️ Risk Scenario:
If price reclaims and accepts back above the broken demand zone, the bearish continuation would be delayed. In that case, a deeper recovery toward the 4,465–4,480 supply zone could develop before sellers re-engage.

Silver (XAGUSD) New All Time Highs?Silver has staged an impressive rally, pushing back toward the $80 region before seeing a low-timeframe correction, with price now retesting the value area high, which previously flipped into support.
As long as price continues to hold this level on a closing basis, it keeps the bullish structure intact and opens the probability for continued upside.
From a technical and market-structure perspective, Silver remains bullish and positioned for continuation.
A sustained hold above this key support could fuel a further rotational move higher, keeping new highs and extended upside potential firmly in play as momentum remains in buyers’ favour

EUR/USD – Losing Momentum, Downside Risk BuildsAfter a rather unconvincing rebound , EUR/USD is now showing clear signs of slowing down . Bullish momentum is no longer sustained, while selling pressure appears more consistently each time price moves into higher levels. This behavior reflects a market that is gradually shifting into a defensive stance.
From a broader perspective, the U.S. dollar continues to retain support as expectations for monetary easing remain restrained, while the euro lacks sufficiently strong catalysts to spark a fresh upside move. This divergence in policy expectations makes it difficult for EUR/USD to sustain any meaningful rally.
On the technical front, the pair has been repeatedly rejected at the descending trendline and the upper Ichimoku cloud , with rebounds capped around 1.1700–1.1720 before quickly rolling over. This price action clearly indicates that sellers remain in control of the market’s primary direction.
On the downside, 1.1640 stands as the nearest key support. Should this level fail to hold, EUR/USD is likely to extend its decline toward the lower support zone near 1.1600, where the market may attempt to establish a new equilibrium.

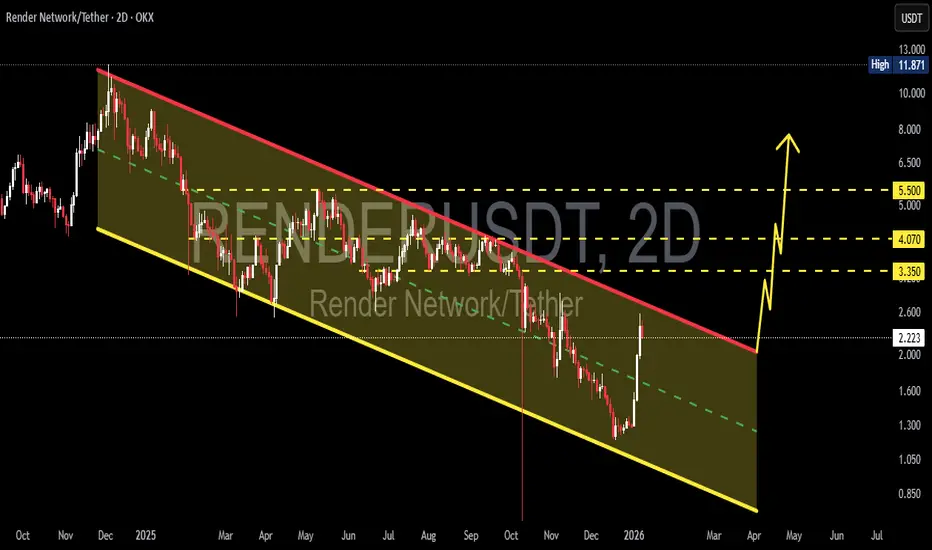
RNDR/USDT Analysis: Relief Rally or Early Breakout Signal?On the 2D timeframe, RNDR/USDT is still moving within a clear medium-term downtrend. Price action remains confined inside a Descending Channel, characterized by consistent lower highs and lower lows since the previous peak. The recent strong rebound from the lower boundary shows buying interest, but the overall market structure has not yet shifted to bullish.
---
Pattern Explanation – Descending Channel
The Descending Channel is a bearish continuation pattern, where:
The upper trendline (red) acts as dynamic resistance
The lower trendline (yellow) acts as dynamic support
Price tends to oscillate within the channel until a breakout or breakdown occurs
The current rebound originates from the lower boundary, but price is still below the channel midpoint and major resistance, meaning the downtrend structure remains intact.
---
Key Levels
Resistance Levels:
2.20 – 2.30 USDT → minor resistance / current reaction zone
3.35 USDT → key resistance inside the channel
4.07 USDT → major resistance / supply zone
5.50 USDT → upper resistance and strong distribution area
Support Levels:
1.30 – 1.20 USDT → lower channel support
0.85 – 0.90 USDT → extreme support in case of breakdown
---
Bullish Scenario
The bullish scenario becomes valid if:
Price breaks and closes strongly above the upper Descending Channel
Supported by increasing volume
Potential bullish targets:
3.35 USDT
4.07 USDT
5.50 USDT
A confirmed breakout would serve as an early trend reversal signal, indicating a potential shift from bearish to bullish market structure.
---
Bearish Scenario
The bearish scenario remains dominant if:
Price fails to break the upper channel
Rejection occurs around the 2.20 – 3.35 USDT resistance area
Downside targets:
1.30 USDT
0.90 USDT
As long as price stays inside the Descending Channel, any upward move should be considered a corrective bounce or pullback rather than a confirmed trend reversal.
---
Conclusion
RNDR/USDT is currently experiencing a technical rebound within a Descending Channel. Despite the strong bounce from the lower boundary, the primary trend remains bearish until a confirmed breakout above channel resistance occurs. Traders are advised to wait for clear breakout confirmation before shifting to a bullish bias.
---
#RNDR #RNDRUSDT #RenderNetwork #CryptoAnalysis #TechnicalAnalysis #DescendingChannel #BearishTrend #AltcoinAnalysis #CryptoTrading
GOLD XAUUSD4396-4392 LOOKING FOR DEMANDFLOOR.
4442-4446 IS LOOKING FOR SELL RETEST,HOPEFULLY NEWYORK TIME ,A TECHNICAL BREAK OF A SUPPORT FLOOR ON 4HR
GOLD setup on the new year on bullish pedestal amidst geopolitical tension in Iran and Venezuela.
if the trend buyers resumes then we could retest the current all time high.
what is GOLD XAUUSD ??
Gold (Au) is a chemical element and dense, malleable transition metal prized for its lustrous yellow hue, exceptional conductivity, and resistance to corrosion.
History as Store of Value
Gold has served as a store of value for over 6,000 years, from ancient Egyptian tombs (c. 4000 BCE) symbolizing immortality to Lydian coins (600 BCE) enabling standardized trade across empires like Rome (aureus) and Byzantium (solidus, stable 700+ years). The 19th-century gold standard anchored global currencies until 20th-century abandonments, yet gold retains purchasing power
Tier 1 Status Clarification
Gold classifies as a Tier 1 asset under Basel III banking rules , with 0% risk weighting for physical bullion, equivalent to cash for capital reserves, enhancing bank balance sheets amid fiat volatility. This elevates it from prior Tier 3 status, affirming its role as "money again."
#GOLD

$OMER - FDA approval of its first commercial productBased on a comprehensive technical analysis of Omeros Corporation's (OMER) stock following the transformative FDA approval of its first commercial product, YARTEMLEA, several key Fibonacci retracement levels have emerged as critical support zones. These levels are essential for investors to monitor as the stock consolidates its extraordinary gains and transitions into its new commercial phase.
Detailed Technical Support Zones:
The stock's meteoric rise of over 423% in the past six months, fueled by regulatory anticipation, necessitates an analysis of potential retracement levels where buyer interest may resurface. Using Fibonacci retracement tools on the relevant price swing, three primary support zones are identified:
The Primary Support Zone (0.382 Fibonacci Level at $12.03):
This represents the first and most immediate level of potential support. A retracement to this zone would be considered a shallow and healthy consolidation within the context of the powerful long-term uptrend. Holding above this level would indicate strong underlying momentum and conviction among investors regarding the company's newly validated commercial prospects. It serves as a crucial line of defense for the bullish thesis in the near term.
The Secondary or Core Support Zone (0.5 Fibonacci Level at $10.30):
This mid-level retracement point at $10.30 is often viewed by technical analysts as a pivotal area where the trend may seek equilibrium. A pullback to this zone would represent a more significant correction but would still maintain the integrity of the majority of the prior upward move. This level is likely to attract considerable attention from longer-term investors who may have missed the initial breakout, viewing it as a strategic entry point aligned with the company's fundamental shift toward revenue generation.
The Deep Support or Last Defense Zone (0.618 Fibonacci Level at $8.57):
The $8.57 level, corresponding to the 0.618 Fibonacci retracement, is traditionally considered the "golden ratio" support. A decline to this depth would indicate a more pronounced correction, potentially triggered by broader market volatility or profit-taking pressures. However, holding this level is critical for maintaining the overall bullish structure. A sustained breach below $8.57 would signal a potential failure of the post-approval momentum and could lead to a test of lower price territories, necessitating a re-evaluation of the near-term technical outlook.
Fundamental Context and Confluence:
These technical support levels must be interpreted in conjunction with the company's groundbreaking fundamental achievements. The FDA approval of YARTEMLEA has fundamentally re-rated Omeros, transforming it from a clinical-stage biotech into a commercial entity with:
A first-mover advantage in the orphan TA-TMA market.
Established billing and reimbursement codes facilitating rapid commercial uptake.
A validated platform (lectin pathway inhibition) bolstering pipeline credibility.
A strengthened balance sheet following the Novo Nordisk partnership on OMS906.
Therefore, any movement toward these support zones may be seen not merely as a technical correction, but as a potential value opportunity by investors focusing on the long-term revenue potential from YARTEMLEA's launch and the company's broader pipeline.
Conclusion:
In summary, while Omeros's stock exhibits strong bullish momentum, the identified Fibonacci retracement levels at $12.03, $10.30, and $8.57 provide a structured framework for assessing risk and potential accumulation zones. The $10.30 (0.5) level is particularly noteworthy as a balanced retracement point. The fundamental catalyst of a first-ever drug approval provides a solid foundation, suggesting that any pullbacks to these defined support areas could encounter renewed buying interest from investors building positions in the newly commercialized Omeros story.

WULF | DailyNASDAQ:WULF — Quantum Model projection
As illustrated on the daily chart, the Q-Structures indicate a potential Triangle formation within Intermediate Wave (4), which now appears structurally more mature—reinforcing the broader bullish outlook for the mining sector and indicating the potential for the full realization of all projected Intermediate-degree extensions.
🔖 This outlook is derived from insights within my Quantum Models framework.
🔖 Notably, all projected Intermediate-degree extensions across the mining sector align with my broader bullish outlook on CRYPTOCAP:BTC , specifically the ongoing Intermediate Wave (3) of the projected Primary Wave ⓹, unfolding within the impulsive Wave III Uptrend on the BTC’s second Cycle .

$BA - US Defense Sector Policy Impact on StocksBased on the confluence of recent developments, including President Trump's proposed restrictions on defense contractors and Boeing's latest major order, a detailed technical analysis of Boeing's stock (BA) reveals several critical support and resistance levels that investors should monitor.
Technical Support Zones:
The stock has established three primary Fibonacci-based support levels, derived from its recent price action and recovery trajectory. The first and strongest support zone sits at the 0.236 Fibonacci retracement level, approximately at $215.83. This level represents initial downside cushion and aligns with recent consolidation. A breach below this point would signal weakening short-term momentum.
The secondary support zone is found at the 0.382 retracement level, around $199.21. This area would likely be tested in a broader market or sector-wide pullback, particularly if concerns over defense sector regulations intensify. The third and most critical support zone resides at the 0.5 retracement level, near $185.79. This price point is a key psychological and technical floor; a sustained break below it could invalidate the current recovery thesis and suggest a return to previous trading ranges.
Resistance and Profit-Taking Target:
On the upside, immediate resistance is encountered near the $240 mark, as highlighted by Fairlead Strategies. A decisive breakout above this barrier could pave the way for a move toward the primary profit-taking target of $250–$268. This range is significant, as the stock has struggled to surpass the $260 level consistently since the pandemic. Achieving and sustaining prices above $250 would indicate a robust fundamental and sentiment-driven recovery, potentially unlocking further gains.
Fundamental Context and Catalysts:
These technical levels are contextualized by fundamental crosscurrents. The recent $1.5 trillion defense budget proposal and restrictions on contractor capital allocation have introduced sector-wide volatility, pressuring defense stocks despite Boeing's strong commercial order flow. The record Alaska Air order for 105 737 MAX 10 jets underscores lingering demand confidence, yet the overarching narrative hinges on Boeing's execution—specifically, its ability to ramp up production profitably toward 700-800 annual deliveries by 2026-2027 and return to sustained profitability.
Conclusion:
In summary, Boeing's stock is navigating between sectoral headwinds from policy uncertainty and company-specific tailwinds from operational recovery. Investors should watch the key support at $215.83, with deeper floors at $199.21 and $185.79. The bullish scenario remains intact above these supports, targeting a breakout above $240 toward the $250–$268 resistance zone. A confluence of improving fundamentals, analyst sentiment (with an 81% Buy-rating ratio), and technical momentum will be required to overcome the significant resistance that has capped the stock's performance for years.

#Nifty Directions and Levels for Jan 8Good morning, friends! 🌞
Market Directions and Levels for Jan 8
There are no major changes in the global and our Indian markets.
Today, the market may open with a neutral to slightly gap-down start, as GIFT Nifty is trading about 55 points lower.
What to Expect Today?
The structure continues to show the same sentiment, indicating that the market is still range-bound.
Therefore, the probability favors a continuation of the range-bound movement.
A correction continuation is likely only if the market breaks the immediate support level with a strong structure.
Let’s take a look at the chart.
Current View
The current view suggests that the corrective pullback could be a three-wave structure.
So, even if the market opens on a negative note, we can expect some consolidation around the previous day’s range.
Note: In this scenario, the market does not break the previous day’s low during the initial phase.
Alternate View:
The alternate view suggests that if the market starts negatively and breaks the previous day's bottom, we can expect correction continuation.
However, note that these kinds of gradual moves will react to each and every support level—take positions a little carefully.

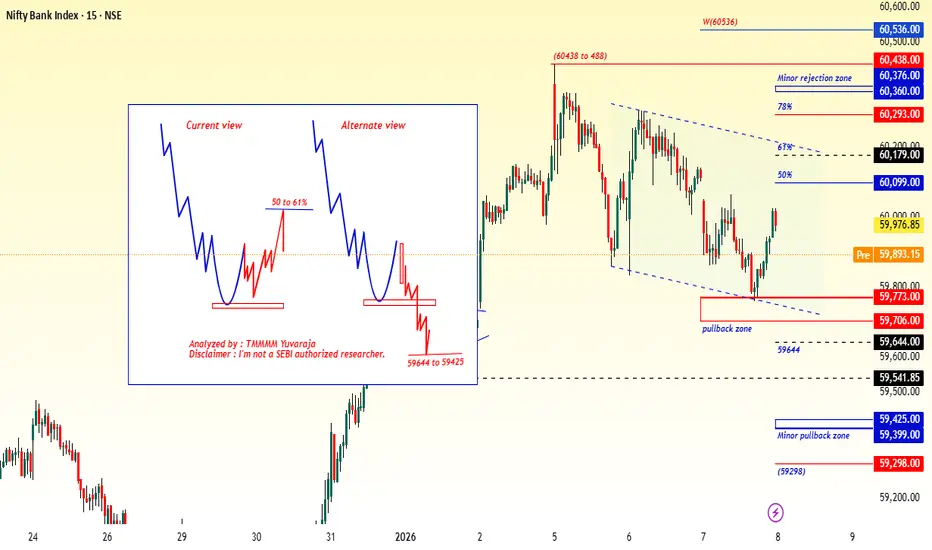
#Banknifty Directions and Levels for Jan 8Current View
The current view suggests that the corrective pullback could be a three-wave structure.
So, even if the market opens on a negative note, we can expect some consolidation around the previous day’s range.
Note: In this scenario, the market does not break the previous day’s low during the initial phase.
Alternate View:
The alternate view suggests that if the market starts negatively and breaks the previous day's bottom, we can expect correction continuation.
However, note that these kinds of gradual moves will react to each and every support level—take positions a little carefully.
OPEN- boring range swingingNASDAQ:OPEN
.
Boring range swinging.
Less supply volume at the bottom.
Wait for break and run.
ABCD or Bull Flag pattern.
.
US STOCKS- WALL STREET DREAM- LET'S THE MARKET SPEAK!

OKTA- Breaking out!NASDAQ:OKTA
.
Breaking out!
Demand volume confirmed at the bottom- good signal.
.
US STOCKS- WALL STREET DREAM- LET'S THE MARKET SPEAK!

BCHUSD H4 | Bullish ContinuationThe price is reacting off our buy entry level at 620.10, which is a pullback support that aligns with the 61.8% Fibonacci retracement.
Our stop loss is set at 592.44, which is an overlap support.
Our take profit is set at 661.06, which is a swing high resistance.
High Risk Investment Warning
Stratos Markets Limited (

#NPL NISHAT POWER Ltd. Daily Outlook for 2026Technical + Fundamental analysis of Nishat Power Limited (NPL)
Technical Analysis (Daily Chart – PSX)
Trend & Structure
NPL is in a strong bullish primary trend, confirmed by a sharp impulsive move from the 35–40 zone to above 80.
Price is forming a bullish AB=CD harmonic pattern, indicating continuation rather than exhaustion.
The recent pullback is corrective, not trend-reversing, and price is respecting higher-low structure.
Key Levels (from chart)
Buy Zone / Breakout: 80.10 – 81.00
Critical Support: 58.50 – 59.00 (structure & invalidation level)
Resistance / Targets:
TP1: 106.80 – 108.00
TP2: 144.50 – 145.00
Momentum (RSI)
RSI remains above 60, indicating bullish momentum.
No major bearish divergence; momentum cooling suggests healthy consolidation before next leg up.
Price Action Insight
Strong volume expansion on the impulsive leg confirms institutional participation.
Pullback remains above prior breakout zone → bullish retest scenario.
A daily close above 80–82 would confirm continuation toward TP1.
Technical Bias: ✅ Bullish
Trend-following setup with favorable risk–reward
Structure remains valid unless price closes below 58.50
Fundamental Analysis (Nishat Power Limited – PSX)
Business Model
Nishat Power is an IPP (Independent Power Producer) operating under long-term Power Purchase Agreements (PPAs).
Revenue is primarily capacity-based, providing predictable and stable cash flows.
Earnings & Cash Flow
Earnings visibility remains strong due to:
Guaranteed offtake
Dollar-linked capacity payments (partial hedge against PKR depreciation)
Cash flows are generally stable, supporting consistent dividend payouts.
Dividend Profile
NPL is considered a high dividend yield stock within the power sector.
Attractive for income-seeking investors, especially during falling interest-rate cycles.
Sector Outlook
Power sector remains defensive in Pakistan’s volatile macro environment.
Circular debt risk exists, but Nishat Group’s scale and track record reduce counterparty risk.
Any improvement in liquidity management or fuel cost pass-through is a positive catalyst.
Group Strength
Backed by Nishat Group, one of Pakistan’s strongest conglomerates.
Strong governance, financing access, and operational discipline.
Fundamental Bias: ✅ Stable to Positive
Best suited for dividend + trend appreciation strategy
Lower operational risk compared to cyclical sectors
🔹 Combined View (Technical + Fundamental)
Technically: Strong continuation setup with harmonic projection toward 145
Fundamentally: Stable cash flows, dividend strength, and group backing
Ideal Strategy: Buy on breakout / dips above support with medium-term holding

Potential bullish rise?US Dollar Index (DXY) has reacted off the pivot and could rise to the 1st resistance which is alightly above the 127.2% Fibonacci extension.
Pivot: 98.60
1st Support: 998.40
1st Resistance: 99.09
Disclaimer:
The opinions given above constitute general market commentary and do not constitute the opinion or advice of IC Markets or any form of personal or investment advice.
Any opinions, news, research, analyses, prices, other information, or links to third-party sites contained on this website are provided on an "as-is" basis, are intended to be informative only, and are not advice, a recommendation, research, a record of our trading prices, an offer of, or solicitation for, a transaction in any financial instrument and thus should not be treated as such. The information provided does not involve any specific investment objectives, financial situation, or needs of any specific person who may receive it. Please be aware that past performance is not a reliable indicator of future performance and/or results. Past performance or forward-looking scenarios based upon the reasonable beliefs of the third-party provider are not a guarantee of future performance. Actual results may differ materially from those anticipated in forward-looking or past performance statements. IC Markets makes no representation or warranty and assumes no liability as to the accuracy or completeness of the information provided, nor any loss arising from any investment based on a recommendation, forecast, or any information supplied by any third party

gold xauusd GOLD setup on the new year on bullish pedestal amidst geopolitical tension in Iran and Venezuela.
if the trend buyers resumes then we could retest the current all time high.
what is GOLD XAUUSD ??
Gold (Au) is a chemical element and dense, malleable transition metal prized for its lustrous yellow hue, exceptional conductivity, and resistance to corrosion.
History as Store of Value
Gold has served as a store of value for over 6,000 years, from ancient Egyptian tombs (c. 4000 BCE) symbolizing immortality to Lydian coins (600 BCE) enabling standardized trade across empires like Rome (aureus) and Byzantium (solidus, stable 700+ years). The 19th-century gold standard anchored global currencies until 20th-century abandonments, yet gold retains purchasing power
Tier 1 Status Clarification
Gold classifies as a Tier 1 asset under Basel III banking rules , with 0% risk weighting for physical bullion, equivalent to cash for capital reserves, enhancing bank balance sheets amid fiat volatility. This elevates it from prior Tier 3 status, affirming its role as "money again."
#GOLD
