AICUSDT can fall to 0.21$ ASAP some correction is needed Our technical analysis indicates the potential development of a Head and Shoulders reversal pattern on the chart. This is a classical technical formation that often signals a trend exhaustion and a potential bearish reversal.
The critical level to monitor is the pattern's neckline support. A confirmed breakdown, characterized by a decisive daily close below this neckline with accompanying volume, would validate the pattern and complete the reversal signal.
Upon a successful breakdown, the measured move target derived from the Head and Shoulders pattern projects a significant downward move toward the $0.20 level. This would represent a substantial correction from the current price and aligns with the typical price objective calculation for this formation. Traders should manage risk accordingly, as a break below the neckline often triggers accelerated selling pressure.
DISCLAIMER: ((trade based on your own decision))
<<press like👍 if you enjoy💚
Head and Shoulders

XAU/USD🪙Gold dropped over 6% on October 21 due to profit-taking and a stronger dollar, but this pullback is healthy after a 60% rally in 2025. At $4,050, the market is likely executing a liquidity grab before resuming its bullish trend toward new highs.🪙
---
📈 Gold Trade Idea – Liquidity Grab Before New Highs📈
Gold experienced a sharp correction on October 21, falling over 6% from its all-time high of $4,382 to around $4,100, marking its largest single-day drop since 2013. This move was driven by profit-taking after an extraordinary rally, alongside a stronger US dollar, improved risk sentiment, and optimism over US-China trade talks.
Despite the volatility, this pullback is not a trend reversal—it’s a healthy correction following a 60% surge in gold prices this year, fueled by economic uncertainty, central bank accumulation, and expectations of interest rate cuts.
Currently, gold is trading around $4,050, a key zone where I anticipate a liquidity grab. This level likely holds clustered stop-losses from late buyers and short-term traders. Once this liquidity is absorbed, I expect gold to resume its bullish momentum, targeting new highs above $4,400.
### 🔍 Why Gold Is Still Bullish:
- Macro uncertainty remains elevated, keeping demand for safe-haven assets strong.
- Central banks continue to accumulate gold, supporting long-term demand.
- Rate cut expectations from the Fed and other central banks reduce opportunity cost for holding gold.
- Technical structure shows a classic retracement after a parabolic move—ideal for continuation setups.
This correction is a textbook example of market mechanics: after a euphoric rally, the market shakes out weak hands before continuing higher. I’m watching for confirmation of support around $4,050 and signs of absorption before entering long.

Gold Retest of a Daily Demand and Inverse H&S on M15 TFPrice has pulled back to a daily demand zone and there is an entry confirmation pattern on the M15 TF.
As long as the demand zone holds, the bulls will take over. Your position size should be determined by your entry and SL.
Good Luck folks.

XAGUSD formed a head and shoulders patternOn the 4-hour chart, XAGUSD has formed a head-and-shoulders pattern. Currently, attention should be paid to resistance near 50.6. If a rebound encounters resistance, consider continuing to sell. Support is expected near 47.5, and if it falls below, further support is expected near 45.7. If the price of XAGUSD breaks back above 52.8, the bullish trend will resume.

ETHEREUM (ETH/USD): Comeback? Eyes on $4300 Resistance.ETHEREUM appears to be showing some bullish signals following a test of a significant daily support level.
The price formed an inverted head and shoulders pattern on that, succeeded by a bullish breakout above its neckline, which is serving as a minor resistance, thereby confirming a local change of character.
Considering these factors, there is a possibility that the price of the coin could potentially rise to the $4300 level.

THIRD POSITIION ON SCRTUSDTLet's see how my third position play out. Higher high or lower high? Market leads, I follow

CRUDE OIL "3 Heads Monster"Could this 3 Heads & Shoulders come to live ?
Built in "Close Price Line Chart" (Candle = Same formation)
Small (black) H&S Target @ 59.34
Medium (orange) H&S Target @ 44.32
Large (blue) H&S Target @ 10.29

ETHUSDT: Head And Shoulders Pattern, Price Targets! $3,676Hi everyone,
Lets grasp a sight on ETHUSDT, we can clearly notice that Ethereum have lately concluded the head and shoulders pattern setup. the price have been ranging for some few hours after touching the neckline region, presently we are expecting a breakdown below this region.
Meanwhile a confirmed breakout from the neckline region would activate a downside movement with momentum aim for $3,676.
Like and follow up,
Thanks for reading.

Buyers are likely to step into AUDNZD at this levelThis Head and shoulder pattern formed on this key level could potentially reveal the interest of buyers at this daily key level.
Let's watch and see

EURAUDGot rejected at daily resistance.
H4/H1 has given a head and shoulder with neckline broken, retest has been made with H4 rejecting with a bearish engulfing candle. Targeting daily support since we're in a daily range.

GBP/AUD: Downward movement is Expected!The 📉GBPAUD price formed a head and shoulders pattern, and its neckline was breached yesterday on a 4-hour time frame.
A retest is currently underway.
It seems highly probable that the price will continue to decline, potentially reaching the 2.0500 level in the near future.

AUDJPYDaily support zone of 97.000 help up once again. H4 & H1 are showing an inverse head and shoulder pattern. Waiting for clear breakout of neckline with possible retest to look for buys. If we get a clear break above 99.400, 100.500 could be second target. For now, we watch and wait.
(NZDJPY has a similar setting but AUDJPY shows a nice upward movement on the daily TF)

ETH USD HEAD AND SHOULDER PATTERNBear pattern on ETH
Look to retrace lower look for continuation before medium term outlook

EURUSD SELLThe EURUSD on the 2H/ 4H has created a head and shoulders and has broke the neckline
also the daily has a left head right shoulder and it looks the daily has came back to retest the neckline and all we are waiting for is the break of the AOI to go short targeting a weekly AOI. Also we see a beautiful trend line forming

XAUUSD long Gold has been on a 9 week complete bullish run
• Price dropped to a key zone where price has moved away from.
•price formed a reversal pattern in the direction favouring the overall uptrend ( inverse head & shoulders )
• expecting a slight pull back to enter a long on this trade.

Gbp/Usd - Inverse Head & Shoulders Targeting Bullish BreakoutA potential bullish reversal is forming on GBP/USD in the 15-minute chart via a classic Inverse Head and Shoulders pattern.
Pattern Details:
Left Shoulder: Formed with a minor pullback and recovery.
Head: A deeper dip indicating strong buyer absorption and bottoming.
Right Shoulder: Symmetrical pullback signaling the potential end of the bearish move.
Neckline: Marked by horizontal resistance (around 1.34395) — a confirmed breakout above this level may trigger bullish continuation.
Trade Idea:
Entry Zone: On breakout and close above neckline (~1.34400)
Target 1: Previous structural resistance (~1.34680)
Target 2: Extended move toward ~1.35070
Stop Loss: Below the right shoulder or neckline retest (~1.34186)
Analysis Notes:
This pattern suggests bullish momentum is building.
Confirmation needed via volume spike or candle close above neckline.
Risk-to-reward ratio is favorable for short-term intraday trade.

Canadian Venture index --- Inverse head & shouldersGold has reached unprecedented heights, approaching the $3000 mark—a prediction we made with precision. Now is the moment to turn our attention to silver and the mining sector.
To start, let's examine the Canadian venture index, which is displaying a promising inverse head and shoulders pattern. I am confident that the logarithmic projection will be achieved without much difficulty.

ORHD - EGX30 - Critical point , high risk EGX:ORHD - EGX30 - Timeframe 2 Hours
Prices achieved the minimum target for Head and Shoulders pattern at 21.30,
Moreover now prices Formatted a Gartley bullish pattern as follow:
- Entry: 21.45 (current price: 21.30)
- Stop loss: 21.16 (potential loss: 1.35%)
- First target: 22.41 (potential profit: 4.45%)
- Second target: 23.00 (potential profit: 7.60 %)
This is not investment advice, only my analysis based on chart data.
Consult your account manager before investing.
Thanks and good luck.

ISMQ - wait for action sen 1: 12/10/2025
Entry from 5.85 to 5.76
5.76 is a target for Head & Shoulders (H&S) on the 1-hour chart.
5.85 is an 88% Fibonacci retracement level (FIP) for harmonic patterns on the 1-hour chart.
Stop Loss (SL): 5.65 Target 1 (T1): 6.18 Target 2 (T2): 6.38
sen 2:
Re-enter when closing above 6.44 (the right shoulder) to deactivate the H&S pattern.
Stop Loss (SL): 6.37 Target (T1): 6.70
Its not an advice for investing only my vision according to the data on chart
Please consult your account manager before investing
Thanks and good luck

BTCUSDT: Bear Market, Price Persist To Drop..Hello everyone,
Lets take a view at BTCUSDT...
BTC have been falling for couple of days now, since after the last week liquidation. the price successfully broke the expected higher low zone as we can clearly spot in the structure, there by extending its drop below $99,846 as the next partial support.
However a confirmed breakout below $99,846 would trigger the price to resume its dip with a target toward $76K as following potential support.
What are your opinion on this, my fellow traders ?
Follow up,
Thanks for reading.

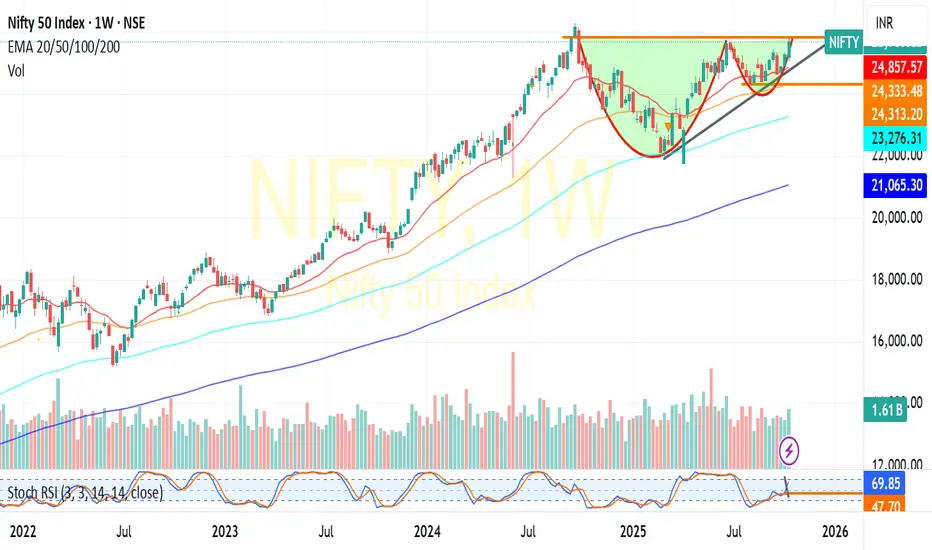
NIFTY:Cup&Handle Break Out-Bull RunNIFTY : Trading at 25700+ Levels.
Trading above all its critical moving averages even in weekly charts(20/50/100/200) showing the momentum
Has formed Cup&Handle formation in weekly chart indicating a possible upside of another 800-1000 Points .Daily chart also confirms the momentum by formation of Inverted Head &shhoulder pattern.
Seems any reasonable dip is likely to be bought .23400 shall be considered as the major support point for any trend reversal.(For educational purpose only)
Head & Shoulders XRP Potential early-stage Head and Shoulders pattern forming on XRP. Here’s the breakdown:
Structure
Left Shoulder: Formed around October 12–13, where price peaked near 2.55 before pulling back.
Head: Formed around October 14 with a higher peak near 2.62, followed by a sharp drop.
Right Shoulder: Currently developing around October 15, topping near 2.47 before showing signs of exhaustion.

Bumble - Potenial Inverse H&SLooking at Bumble now and have been accumulating shares these last days. If this stock manages to break the neckline It could easily make a quick run of 100-200%.
