NASDAQ: ADI – Third Breakout Above $240 Key Resistance?NASDAQ: ADI (Analog Devices) has been consolidating for about a year and a half since May last year. During this period, the $240 level has acted as a major psychological and structural resistance zone.
Over the past year, price has tested this level three times — yet none of the weekly candles managed to close above $240, each time retreating shortly after. This showed consistent selling pressure at that zone.
In recent months, however, the price action has started to shift.
* First Breakout (June 30): ADI closed above $240 after a three-month rally, but the move lacked a proper pullback or base formation. Price failed to hold above the breakout level afterward.
* Second Breakout (August 18): A second attempt after a month of mild consolidation also failed to sustain above $240, signaling insufficient buying momentum.
* Third Breakout (October 6): Last week’s weekly candle finally closed at $242.87, about $2.87 above the key resistance, marking a third breakout attempt — and this time, the setup looks technically healthier.
The latest two weekly candles formed a clear “break and reclaim” pattern:
1. The first candle broke below the $240 level and tested the 20-week SMA.
2. The following candle reclaimed both the SMA 20 and the $240 level in one strong move.
This indicates that the market successfully retested short-term support and regained strength quickly — completing a constructive pullback within just two weeks.
In summary:
* $240 remains the key line in the sand.
* The third breakout shows stronger technical structure (with retest + reclaim).
* If price can continue holding above $240 with increasing volume, ADI could be entering a renewed uptrend phase following its long consolidation.
Horizontalsupoort

NYSE: ADM – Uptrend Structure Intact with Strong Confluence SuppNYSE: ADM (Archer-Daniels-Midland) has been in a steady uptrend since April, forming a consistent pattern of higher highs and higher lows. After breaking above the 50-day SMA, price has remained comfortably above it — with every pullback showing healthy consolidation and renewed buying interest.
From mid-year onward, all four major simple moving averages — SMA 50, 100, 150, and 200 — have completed a bullish alignment, each sloping upward. This marks a decisive shift in market structure from a previous downtrend into a confirmed uptrend, reflecting growing institutional confidence.
Price has also respected the rising trendline (green) multiple times — around June 5, August 1, October 3, and October 15 — each time rebounding and closing back above the SMA 50, showing consistent trendline support.
Over the past two months, ADM has been consolidating near the $60 level, forming a horizontal base (red dotted line). Notably, several candles in September showed long lower wicks, signaling liquidity grabs below $60 — likely sweeping retail stop-losses before a quick recovery.
At present, price sits above multiple layers of support:
* Bullish SMA alignment (50 > 100 > 150 > 200)
* Rising trendline (green)
* $60 horizontal support zone (red dotted line)
* 50-day SMA as dynamic support
This confluence of signals reinforces ADM’s medium- and long-term bullish bias. As long as price holds above the trendline and SMA 50, the path of least resistance remains to the upside.

NYSE: FRO – Bulls Defending Key Trendline & SMA 50 SupportSince April, NYSE: FRO has been building a steady uptrend, forming a sequence of higher highs and higher lows. Each corrective wave has consistently found support along the rising trendline (GREEN), which has now been successfully tested three times.
In July, price broke above the 50-day SMA (BLUE) and has since turned it into a strong dynamic support — a sign of clear trend recognition by the market.
Most recently, on October 14, FRO printed a candle that tapped into multiple layers of confluence:
* Retest of the ascending trendline
* Touch of the rising 50-day SMA
* Stop-hunt wick sweeping below recent lows
* Reclaim of the horizontal support (RED dotted line)
This combination suggests a strong defense from buyers at this zone. While short-term volatility may persist, the overall structure remains constructive — as long as price holds above the trendline and SMA 50, the bullish momentum stays intact.

ADBE near Confluence Support - 33% ROI PossibleNASDAQ:ADBE is currently nearing a confluence support (an area where multiple support elements are combined) at around $410-$420. Nevertheless, opening a first position right now is already an option given the attractive valuation and the horizontal support (blue zone). In addition there are two big daily gaps (red zones) above the current price giving us some potential pulling factor towards $580. The trendline you can see is very weak and has only two real re-tests in October 2022. So, take that with a grain of salt and try to concentrate more on the horizontal support and the $410-$420 area (61.8 fib).
Looking at fundamentals (I know most of you are not really interested in such things, but they do help with swing trades) we can see a price-to-sales ratio of 9.xx suggesting upside of 50% when comparing it to the long-term average of 14.xx. ARR increased 23% YoY to $3.48B. In terms of AI, firefly generated more than 16 billion assets so far, and FY24 revenue increased by a little more than 11% to $21.51B. Current PE ratio is just short of 22.
So, adding here and more towards that $410 will give us a huge potential ROI over the next couple of months.
Support Zones
$440
$410-420
Targe Zones
$540
$580-600

LRCX Horizontal Line at 720s hold again for Lam Research?Horizontal line at 720s continues to work great for LRCX Lam Research. Lam Research is trading with a Forward P/E ratio of 21.75 which is discounted to its industry group Forward P/E of 25.6.

big intraday support level before big newsgold price dropped $100 in friday last week on china central banking stopped buying gold and hot nfp number which risk fed projecting 2 cuts instead of 3 and first cut after election
price now side near 2300 psychological number after big dump
price has failed to breakout big yellow support zone near $2280 in first attempt

Lets Keep Things Simple!Let's keep everything simple. Here at the levels to trade in-between!
Calculate Your Risk/Reward so you don't lose more than 1% of your account per trade.
Every day the charts provide new information. You have to adjust or get REKT.
Love it or hate it, hit that thumbs up and share your thoughts below!
This is not financial advice. This is for educational purposes only.

asian paints ready for reversalasian paints at longterm weekly trendline support and horizontal support
cmp 2981 sl 2885 target 3101 and 3224

Higher lows , Higher highs on BTC as Alts take center stageBitcoin has adapted to the zone and is carving out a space that involved an ascending channel and a fibonacci game of tag. We can clearly see that we are in the fib zones on the short frame and as we need to be focused on a pullback, nothing is really giving us the indication that it is going to happen as we have buy orders waiting on the support/resistance areas as the are defined.
What this means? I see us in a period of indecision where horizontal action as well as minor movements ladder dancing fib lines until we complete the 4th arm of the elliot wave where investors agree on funding a push to the upside. This is a wait and see. I am not entering any position until clarification

simple horizontal support levelprice showing strong rejection once again on strong horizontal support level 1.07234
before big news usa cpi

FFH is going to bounce like a basketball! H&S pattern too!It appears as though FFH is showing two alternatives, an H&S breaking down, or, sideways trading in a horizontal channel, with a breakout likely happening early 2024.
A horizontal channel is a neutral chart pattern that marks investor indecision. Buyers and sellers fight, and it is only at the exit of the horizontal channel that they agree on a direction; either there are more buyers than sellers or there are more sellers than buyers; hence the strong force of the movement at the horizontal channel’s exit.
This train has left the station.

NFLX - Expecting Strong Support @ 380Since it began trendng more than a year ago from July 2022, NFLX has a tentancy to correct back to its rising trendline every 3 to 6 months or so.
As at its close @ about 400 yesterday, it has already corrected 50% from it's recent AB swing. Whether it will find support here remains to be seen.
Another 5% downside from here would bring it to 380, which is likely to be a strong support due to a confluene of:
1. Long term trendline support (Red)
2. Horizontal Resistance turning Support (Black)
3. 61.8% fib retracement of it's AB swing
4. Gap close (minor)
All long bets are off should it break and stay below 380.
Disclaimer:
TA is about improving our odds of a successful trade (not a guarantee). This is just my own analysis and opinion for discussion and is NOT a trade advice. Kindly do your own due diligence and trade according to your own risk tolerance and don't forget that money management (ie stop loss and position sizing) is (probably the most) important!
Take care and Good Luck!

DIS - Testing Long Term Horizontal SupportDIS has tested it's long term horizontal support @ 79 and it is holding so far.
A potential bullish divergence is also seen on its monthly chart which increase its odds for some upside bias for the next 1-3 (monthly) candles.
The caveat for divergence is that it only signals a (potential) short term trend reversal, lasting on the average 2-3 candles and does not predict a longer term change.
If seen on the monthly chart, then it could mean a potential bounce for the next 2-3 months.
And of course, while the odds is good, it is not 100%.
While now could be a good time to long some DIS at relatively low prices, there is also a chance that the stock could remain ranged bound for a sometime. Some would prefer to wait till there is clearer momentum (usually above its 200 day moving averge) before establishing a long position
Disclaimer:
TA is about improving our odds of a successful trade (not a guarantee). This is just my own analysis and opinion for discussion and is NOT a trade advice. Kindly do your own due diligence and trade according to your own risk tolerance and don't forget that money management (ie stop loss and position sizing) is (probably the most) important!
Take care and Good Luck!

Xauusd long Setup we have a horizontal weekly support at 1850 currently price above it, also we see h&s pattern , different scenario if a price drop below 1846

EUR/CAD Long SetupHi Traders, the price now above support with stability above 1.44500 level as we see the price broke a middle of correction channel with 0.5 fibo, the genral trend is up we search entry , i think this a good entry

USDINR Bearish setupUSDINR: it used to trade with 97% precision in regression channel trends,
which is now decisively broken.
The current candle seems more like a temporary pullback and the Indian currency might witness strength in upcoming sessions.
only believing charts, I would be comfortable having a short stance for target 79.95

AMZN - may have come into supportAMZN came into a potentially strong support zone 79 - 84 comprising of a horizontal support area as well as the 88.6% fibonacci retracement of the major covid upswing AB. Some bullish divergence is now seen on it's weekly chart hence there is a good chance that this support of 79 will hold in the near term. However, any bounce from here must still be viewed as short term until we can see that a bottom is clearly in place (usually on hind-sight!).
A safer region to consider going long is when it could at least clear near term resistence (101 - 105). Until then.
Disclaimer: Just my 2 cents and not a trade advice. Kindly do your own due diligence and trade according to your own risk tolerance and don't forget that money management is important! Take care and Good Luck!

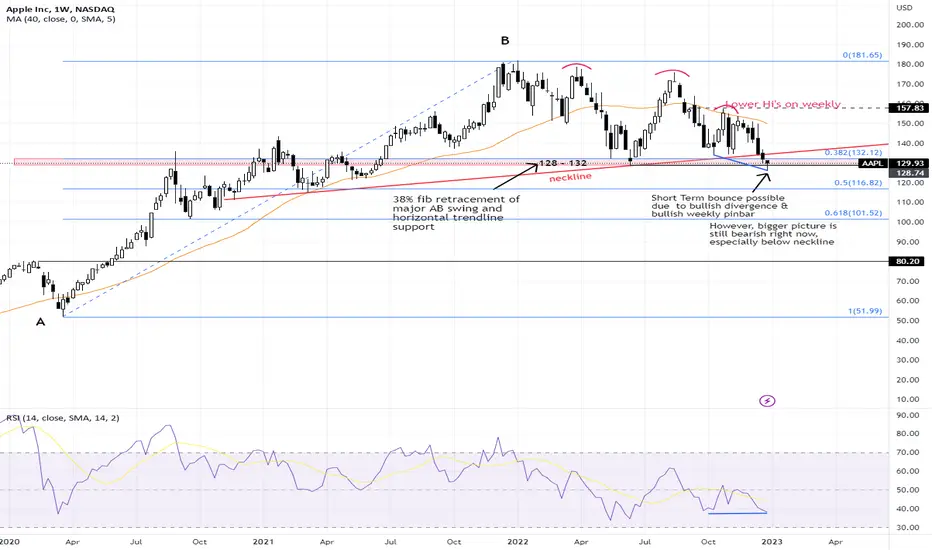
AAPL - Will support @ 128 hold?AAPL had been the most resilient among the FAANG stocks despite being in a volatile and toppish pattern for months. However it started to break below major neckline support @ 134 on 19th Dec and then an attempt to break the horizontal support @ 128.
It managed to close the month with a weekly bullish pin bar above 128 and a potential bullish divergance is also forming between price and RSI on the weekly chart. Hence a near term bounce could happen but any bounce right now is best viewed with a grain of salt until we can see change in the chart structure
Any close below 128 is potential for the bear trend to continue towards 110-115.
Disclaimer: Just my 2 cents and not a trade advice. Kindly do your own due diligence and trade according to your own risk tolerance and don't forget that money management is important! Take care and Good Luck!
TSLA Major Confluence Long Signal!Going to keep this simple. We have a touch on the bottom of the descending parallelly channel, a major horizontal support line, and the golden pocket. This is a very bullish setup for TSLA to bounce. Stops should be placed below golden pock with the right position size and risk management to protect your account incase the bears manage to push the price through this major support.
Love it or hate it, hit that thumbs up and share your thoughts below!
Every day the charts provide new information. You have to adjust or get REKT.
Don't trade with what you're not willing to lose. Safe Trading, Calculate Your Risk/Reward & Collect!
This is not financial advice. This is for educational purposes only.

Why I opened BTC short when price rejected at 17.4K. Hi everyone, in this analysis I will explain why I opened short position when BTC was rejected at 17.4K level which was upper band of rising wedge/diagonal resistance and 4h 200 EMA. Before that I noticed ABCD pattern which started forming at 15.5K swing low in 22 November/ A point/ and finished at 17256 in 01 December/ D point/. BTC rejected at the mentioned zone with liquidity hunt above D point then strong rejection with bearish engulfing candle=RSI bearish divergence + momentum losing+ rising wedge pattern breakdown. My first target will be at 0.618 fib level /16.5K/ which is horizontal+ diagonal support at the same time. If price can't hold 16.5K C point will be my 2d target for ABCD pattern and 100% projection of CD wave. I don't expect BTC to go lower. If you pay attention to the volume bars, there is no buying pressure. Let's see how BTC reacts at 16.5K support level. Don't forget to put always stop losses.
If you like my ideas and analyses, don't forget to follow me please. I will appreciate any single follow. Thanks in advance.
Don't forget to check my other analyses bellow related ideas.

TSLA - due for a bounce soonTSLA is now at a longer term horizontal support zone (168-180), after having retraced 61.8% of it's major AB upswing that had begun in March 2020(see monthly chart).
A short term bounce looks to be due as we are now seeing a bullish divergence between price and RSI on it's daily chart, but whether this is "THE" low remains to be seen as the overall trend is still down at the moment. Having said that, the chance that it is bottoming is higher should we start seeing more of the FAANG stocks pivoting.
Can only wait and see.
Disclaimer: Just my 2 cents and not a trade advice. Kindly do your own due diligence and trade according to your own risk tolerance and don't forget that money management is important! Take care and Good Luck!

TASI Tadawul All Shares Index
Since Covid Bottom Level, market has taken 135% Bullish Rally until May 2022.
It has taken correction up to 22%.
It may retrace from any fib level.
H&S formation is complete and correction may lead to it's target.
However, a strong horizontal support will be help retracement.

BTCDOM - Horizontal We are at currently a previous point of large support for BTC dom
Horizontal Support is evident
Will it act as the prior green rectangle? Lets see!
