Investment Grade VS High Yield AMEX:LQD is meeting the demand zone here. Looks like risk appetite will start to cool down from here. Flight to safety is starting to show signs.
With all the private credit out there I don´t think AI is the go to at this point in time. Gold is likely to be benefiting from this aswell as creditworthy companies.
High beta stocks is at a danger zone from my perspective.
BOJ´s rate hike could be the trigger on friday.
As always. This is not a financial advise. Always do your own research and investment decisions.
HYG

MOVE INDEX COMPLACENCE SELL SIGNAL The chart posted is the Bond market VIX . As you can see the green arrows and now we have a double green This is now setup for an I.T. SELL IN BONDS and Rates to rise and sharp and fast into spring of 2026 . I am starting Re short the Spy Smh and soon Qqq all within 48 hours or less . on 12/11 I will be 100 % short I have started to short smh and spy today . Best of trades WAVETIMER !

WAVE 5 TOPPING EXIT ANY LONGS IN SPY Today I moved back to a 50% long in the money PUTS at sp cash 6840 /6845 zone if we can breakout to above 6870 on a close I will move to 75% long in the money 2027 puts Timing in my call for the BULL market to end within 9 to 15 TD is now day 6.5 The market is setting up for a decline of 10% out of nowhere . Silver is confirming the BUBBLE I am looking for 64 plus or minus 2 $ before the Start of the reversal in ALL ASSETS
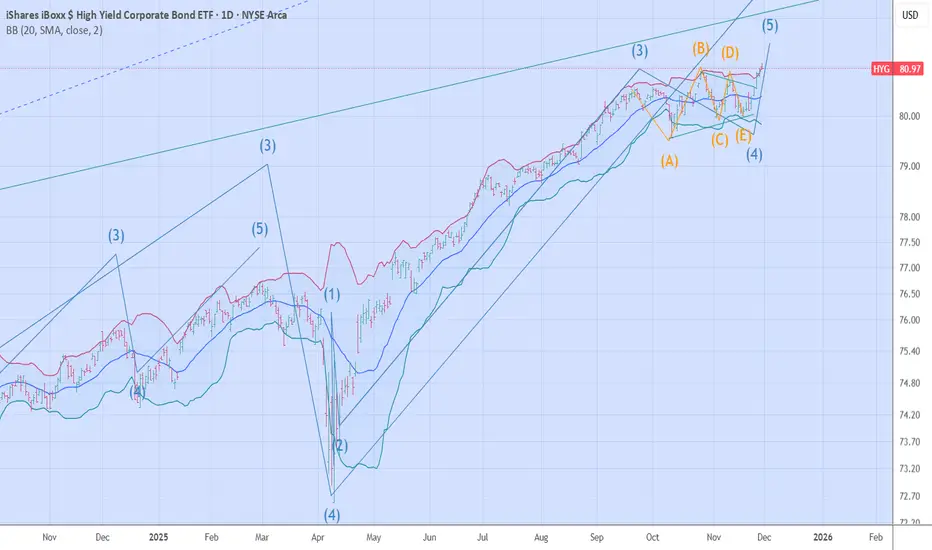
HYG THE LAST WAVE of LIQUIDITY Bubble to Burst 82Well I do think it is time to post the chart below as to provide an Early warning for what is nearing .I have stated that 2026 is a rather Negative cycle has to All markets based on the 4 year cycle . This is the wave structure I have not alt it or saw any reason the last year plus and feel that The bull market from the MARCH 23th low 2020 is nearing the end . I see interest rates in 2026 to rise and rise rather sharp Not what the street or most traders feel The market is telling me huge issues are near . the 4 yr and the 65 month cycles are Hard down similar to 2002 decline . Best of trades WAVETIMER

Bitcoin Bear market I would say BEGUN The chart posted is the work I have posted and take notice of the MATH . Cycles are negative into My OCT 10 th /20th and all abc rallies can be used to exit if you have not I was clear at 123 k last chance best of trades Wavetimer

Weekly LIQUIDITY CYCLES under Elliot WAVE The post posted is my thesis for Risk as to flow of money under my theory of Velocity of money flow !
FINAL WAVE IN LIQUIDITY CYCLE WORLD WIDE Chart posted of High yield ETF is my thesis as to the liquidity cycle in the risk assets I will post the weekly in a few mins Then the wheels come off the bus .

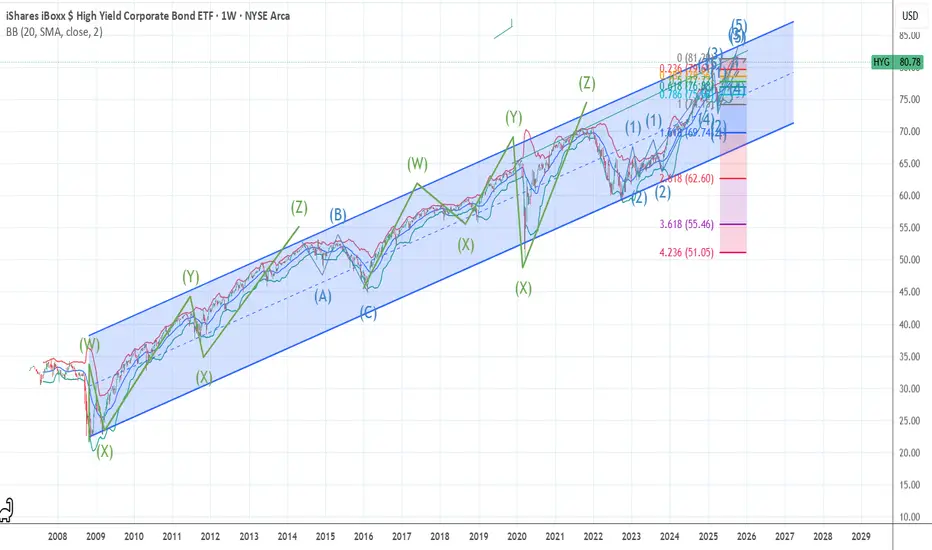
HYG =Liquidity Nearing the End of 5 Waves up from 2022 low The post posted is that of the high yield market ETF aka JUNK BONDS .As the chart posted we can see we are nearing the end of an Elliot Wave 5 waves up from oct 2022 . So if the markets are going to continue to rally aka SPY QQQ VT we will need for the Treasury to start to issue T.Bills rather soon . Best of trades WAVETIMER
Move index saw a140 level this is a Panic short term bottom ONLYThe spreads loved like a failure was near ! So the move index reached a short term bottom Only in the High yield market so now everyone things it is safe to jump back to RISK ON . This is what we see in BEAR MARKETS sharp strong up thrusts to be followed By longer declines .Best of trades WAVETIMER . NOT A NEW BULL MARKET TRADERS

Hyg and vixWell hard to argue this thing show oscylator kid behavior. I really do hope we gonna pierce dashed line. Otherwise we may have some serious discount on stocks.

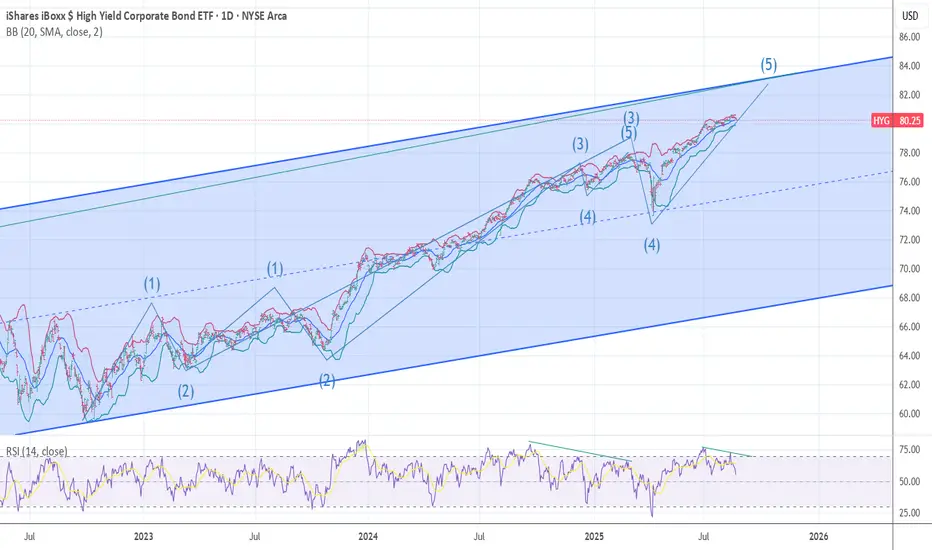
IF you are Bearish SP 500 Your EARLY The chart posted is That of High yield Market ETF HYG we have just finished of the correct in this sector and should see Liquidity coming back into assets One Last Gasp This should raise mags qqq and spy toa new record high as most other indexes struggle to rally back to .618 best of trades WAVETIMER

MOVE INDEX BONDS SET TO HAVE CRISIS The chart of the move index aka BOND VIX is showing a high level of Complacency as the bonds are in sharp decline phases The worst is yet to come as the Panic in the debt markets has not been seen. Inflation and deep recession is in my model and forecast for the next 18 plus months .

MOVE INDEX A whole lot of FEAR today !!!The chart posted is that of the move index The Vix of the Bond market As you can see to the right of the chart Today Spike Outside of the bb bands . I am Long calls in TLT 90 strike 2026

$HYG will get a boost this summer when rates are cut due to BOJI see the BOJ dumping treasuries this summer, which'll force down the USDJPY pair, and increase inflation here at home. When rates go down, borrowing money is easier, especially for junk corporations avoiding default due to decades high interest rates.
Could AMEX:HYG fall back into the box one last time? Absolutely, if the dollar ticks higher after FED hawkishness. But then, AMEX:HYG will catapult.
When HYG is ready I'll give out some options plays to capitalize on the bullish trend.

High Yield Corporate Bonds as indicator for Risk AppetiteThis is not something I would use as a trading signal by itself, but it is a good indicator on the weekly chart of how bigger players are viewing risk appetite.
High yield corporate bonds, as seen reflected in ETFs like AMEX:HYG and AMEX:JNK , are an interest data point. High yield implies that these are riskier bonds with a higher chance of default on the debts. Just like as individuals, we have credit scores and when we apply for loans, the interest rate can vary depending on how the bank rates us risk-wise on perceived ability to pay back the debt, those who have a lower score might get a higher interest loan because they are considered higher risk of default. Same basic principle applies to corporate debt.
When liquidity is flowing and the economy overall looks good, large investors/investment banks will feel better about buying riskier high-yield bonds and other debts because we're in an economy paradigm where there's a better chance that not enough of those will default to cause significant harm to the debt holders.
But, when the economy is getting pinched for whatever reason and liquidity starts to dry up, high risk, high yield debts are much less desired due to perceived increased risk of default.
Sometimes the high yield debt moves pretty close in tandem with the market, see for example the dumping that happened during the 2020 COVID panic.
Before and after that, you can often see a bearish divergence in AMEX:HYG and AMEX:JNK many weeks before the S&P finally tops out and begins its decline. The above chart, you can see the decline become more obvious as we wind down 2017 and head into 2018, then also see it again pretty obviously in the second half of 2021 before the sell off for most of 2022 started.
Both AMEX:HYG and AMEX:JNK came online around 2007-8 timeframe, just before the GFC. You can see a pretty steady decline right from the beginning there, and a rapid rebound as things find bottom.
What is interesting is how far both AMEX:HYG and AMEX:JNK came down throughout 2022, and while equities have since had a nice recovery bounce for most of 2023, the high yield bonds have not had such a recovery. It's actually instead slowly condensing price action with slightly higher lows, but also lower highs. We seem to be nearing the end of that wedge and hopefully soon we get an answer on what the risk appetite really is of risky debt, because it will be a solid signal of where equities may be headed next.
Personally, I'm already seeing some indications that as we approach the end of the year, we may see a larger dip in equities. For how long and how large, that remains to be seen. For right now, we're having a recovery rally from selling off most of August and I'm not seeing any indication it's a good time to go against that trend, but that may change in the coming weeks.

HYG and why it matters
High yield corporate bonds show a significant correlation with the risk-on/risk-off sentiment for the S&P 500 (SPX). As we can observe, the current market structure resembles a wedge, which can technically serve as both support and resistance.
To add complexity, we're currently at a channel resistance level, which also happens to be a historic trendline. This trendline has consistently been respected and traded in markets experiencing changing sentiment.
It's becoming apparent that several factors are aligning for the upcoming months when you consider these various charts. This confluence of technical indicators and historical patterns suggests that careful monitoring of these charts is essential as they could provide valuable insights into market movements in the near future.

$PEPEUSDT key support and resistance levels + weekly forecastOKX:PEPEUSDT continues its weakness relative to CRYPTOCAP:BTC and broader "risk on" signal markets such as $NQ!
This latest dip was driven by an extremely negative news event - Grifter Gensler and his band of goons at the SEC are employing some bank-collapse-contagion-red-herring tactics by suing Binance. This news allowed the bears to take control and we see the temporary decoupling from the usual tight correlation with the Nasdaq break:
In such events, traders with massive positions such as wallet 0x4614 move to protect their capital and sold huge positions to cut short term losses, as the market readjusts to lower key levels.
If this was a catastrophic sell off event, we would not have seen a bounce off key support at 0.00000095, and the last remaining support for OKX:PEPEUSDT 0.0000005 would have fallen.
The 0.0000005 level is revealed by my TA as the "last stand" support level for $PEPEUSDT. Breakdown BELOW this level would be a pivotal bearish moment and we would need a week or so to establish relatively "strong" support levels, not just daily price ranges, at lower price levels.
However, this is not what happened during Bitcoin's multi thousand dollar move down which means that short term volatility can continue.
Using a three-way outcome/decision matrix - down-neutral-up - we can prepare for three scenarios and deploy capital accordingly.
The first outcome which is down, is a breakdown below the 095 handle and a cascade towards 056 handle (red box range in title image). As OKX:PEPEUSDT is tightly correlated with CRYPTOCAP:BTC and AMEX:HYG (BBB bonds), this would likely mean those two broader markets would have continued lower. If we look at CRYPTOCAP:BTC key levels, again we're not in catastrophe scenarios at all, a nice bounce off the $25.5k level and bulls will target $25.9k as next resistance:
And AMEX:HYG levels also looking healthy, above 74.3 support with 75.3 as overhead resistance.
Secondly in the neutral outcome we find a new range in OKX:PEPEUSDT bouncing between 0.000000950 and 0.00000108. A perfectly acceptable outcome for active traders as this offers a nice 10% intra day range.
Thirdly in the OKX:PEPEUSDT bull case we need to see a breakthrough in CRYPTOCAP:BTC above $25.9k level and a move towards its next major resistance level now at $27k.

just an observation. $SPY vs $IEF / $HYGAppears we are running out of risk appetite. Put also looks like we have built a very nice base for a significant move higher. Hopefully, that's a risk on move, not a risk-off move.
Personally, I believe we have already corrected in each individual sector, it just didn't happen all at once like it normally does.
According to this, risk aversion and sentiment have been flat in a range for the past few months according to IEF/HYG.

HYG daily bullish hammer above 100 day moving averageHYG daily bullish hammer above 100 day moving average if we break above we can run into 200

$HYG setting up for a H&S breakdown? Corporate bond blowup?$HYG looks like it's about to fall.
There's a H&S pattern forming on the 4Hr timeframe and price just rejected the 200DMA.
Should price break support at $73.05, I think we'll see a quick move down to the $69 region, maybe even lower.
I've taken some puts just incase this plays out.

HYG TRIANGLE. Wave D low is NOW rally in wave E of B HYG hourly chart TIME is running OUT for the rally in SPY QQQ I have now moved back to 100 % cash sold the 75 % net long at 4144

HYG TRIANGLE. Wave D low is NOW rally in wave E of BThe chart is what I have felt is the most important chart to watch for sometime . We rallied and stopped right at the trend line . I have watching this as to it will become an issue for the sp 500 going forward . best of trades WAVETIMER

SPY QQQ HYG Divergence again I’m not sure if SPX/HYG divergence is reliable moving forward, but this indicator has proven pretty effective last year. We are currently diverging again, last 3 major divergences created pull backs of -17%,-13%, -21%
Any thoughts from my fellow analysts?
Any other divergence indicators you can share with high probability?
Good luck to all
