CADJPY LOCAL SHORT|
✅CADJPY retraces toward a premium supply level before resuming its bearish leg. Price is likely to dive lower to target liquidity beneath 108.30 as Smart Money rebalances the range. Time Frame 2H.
SHORT🔥
✅Like and subscribe to never miss a new idea!✅
Ict

DXY: Strong Growth Ahead! Long!
My dear friends,
Today we will analyse DXY together☺️
The recent price action suggests a shift in mid-term momentum. A break above the current local range around 98.869 will confirm the new direction upwards with the target being the next key level of 98.977 and a reconvened placement of a stop-loss beyond the range.
❤️Sending you lots of Love and Hugs❤️

SILVER: Will Go Up! Long!
My dear friends,
Today we will analyse SILVER together☺️
The in-trend continuation seems likely as the current long-term trend appears to be strong, and price is holding above a key level of 51.673 So a bullish continuation seems plausible, targeting the next high. We should enter on confirmation, and place a stop-loss beyond the recent swing level.
❤️Sending you lots of Love and Hugs❤️

EURUSD: The Market Is Looking Down! Short!
My dear friends,
Today we will analyse EURUSD together☺️
The market is at an inflection zone and price has now reached an area around 1.15686 where previous reversals or breakouts have occurred.And a price reaction that we are seeing on multiple timeframes here could signal the next move down so we can enter on confirmation, and target the next key level of 1.15466.Stop-loss is recommended beyond the inflection zone.
❤️Sending you lots of Love and Hugs❤️

GOLD: Strong Bearish Sentiment! Short!
My dear friends,
Today we will analyse GOLD together☺️
The price is near a wide key level
and the pair is approaching a significant decision level of 4,076.54 Therefore, a strong bearish reaction here could determine the next move down.We will watch for a confirmation candle, and then target the next key level of 4,054.10.Recommend Stop-loss is beyond the current level.
❤️Sending you lots of Love and Hugs❤️

GBP/USD UpdateNext move on the way, focus on proper risk management & stay disciplined. Wishing you successful trades..!
Key Reason:
1. Fresh demand zone.
2. Price sweep all liquidity.
3. Fresh MSS formed.
4. Bullish move expected from this demand zone.
This is not a financial advice. Confirmation is important. Let's see how it will work.

How to find algorithmic levels of support and resistanceUsing repeating pinpoint levels to form meaning of opens and closes around these levels give you an advantage in your analysis.
As price gives us clues to what levels are affecting price, we should mark the new candles that are responding to these levels by breaking and retesting these very levels.
Please let me know your thoughts! 🙏🏾

us100 turtle soupUS100 has received good liquidity on the hourly chart. If it becomes clear that it's a turtle soup at the opening, it might make sense to buy as I've shown on the chart.

GOLD (XAUUSD) – Smart Money Setup | Bullish Outlook Above 3985 Price is currently trading near a key FVG & Demand Zone (Fib 0.5–0.618), showing signs of potential bullish reversal.
If the structure holds above 3985–3970, buyers could target the Weekly High at 4059 after reclaiming the Previous Day High (4022).
Analysis Highlights:
HTF Bias: Bullish – Rejection from demand + liquidity sweep.
Key Levels:
Support: 3985 / 3970 / 3947
Resistance: 4022 / 4059
Trade Idea: Waiting for liquidity grab → bullish CHoCH → entry confirmation.
Target Zones: 4022 → 4059
Invalidation: Break and close below 3947 zone.

“Distribution? Maybe. Reversal? Nah. Just liquidity doing yoga.”Dear Goldies, ✨
Ten straight weeks — gold has climbed without looking back.
But every rally meets gravity, and this one now stands at the top of its own empire.
Above 4,000, price breathes thin air — a zone where profit-taking becomes a language, not a choice.
The macro trend remains bullish, yet momentum is stretched.
Price sits high above its 21–50 EMA band, RSI prints divergence — the signature of an overextended leg.
This isn’t weakness — it’s distribution inside strength. The first calm breath after a ten-week sprint.
🟡 Gold (XAUUSD) Structural Outlook
Macro Bias: Bullish, corrective phase
Gold trades deep within the premium range (4,050–4,180) — a historical supply.
Above 4,180 → 4,280–4,380 expansion
Below 3,720 → 3,420–3,300 re-accumulation
⚖️ The battle zone sits between 4,050–3,720, where liquidity decides control.
Weekly View:
Control Zone: 3,980–3,900
Supply: 4,050–4,130
Demand: 3,740–3,640
Soft USD = possible fake-out toward 4,185–4,260 before cooling.
H4 View: Compression → Expansion
Above 3,900: bullish rotations → 4,025 → 4,125 → 4,180
Below 3,900: correction → 3,840–3,700
H1 Intraday:
Main Supply: 4,045–4,065
Flip Zone: 4,015–4,030
Demand OB: 3,965–3,975
Sweep Zone: 3,945–3,925
Final Defense: 3,875–3,895
🎯 Tactical Paths:
🔼 Reclaim 4,030 → 4,065 → 4,105
🔽 Lose 3,975 → 3,945 → 3,875
🧭 Summary
Gold’s macro remains structurally bullish, but price is testing the top of its own range.
Expect engineered sweeps before FOMC as liquidity builds both sides.
4,050–4,180 → premium supply
3,900–3,740 → tactical demand
🦅 Patience > Prediction.
Reaction reveals intention — expansion follows timing.
Disclaimer : For Educational Purposes Only

ETHUSD: Bulls Are Winning! Long!
My dear friends,
Today we will analyse ETHUSD together☺️
The recent price action suggests a shift in mid-term momentum. A break above the current local range around 3,822.9 will confirm the new direction upwards with the target being the next key level of 3,868.2 and a reconvened placement of a stop-loss beyond the range.
❤️Sending you lots of Love and Hugs❤️

BTCUSD: Next Move Is Down! Short!
My dear friends,
Today we will analyse BTCUSD together☺️
The in-trend continuation seems likely as the current long-term trend appears to be strong, and price is holding below a key level of 11,950.98 So a bearish continuation seems plausible, targeting the next low. We should enter on confirmation, and place a stop-loss beyond the recent swing level.
❤️Sending you lots of Love and Hugs❤️

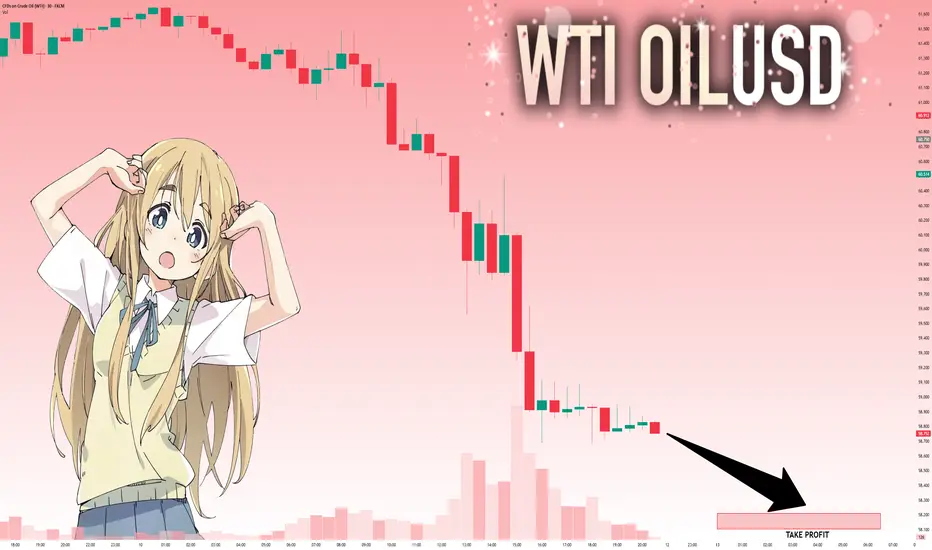
USOIL: Target Is Down! Short!
My dear friends,
Today we will analyse USOIL together☺️
The in-trend continuation seems likely as the current long-term trend appears to be strong, and price is holding below a key level of 58.752 So a bearish continuation seems plausible, targeting the next low. We should enter on confirmation, and place a stop-loss beyond the recent swing level.
❤️Sending you lots of Love and Hugs❤️
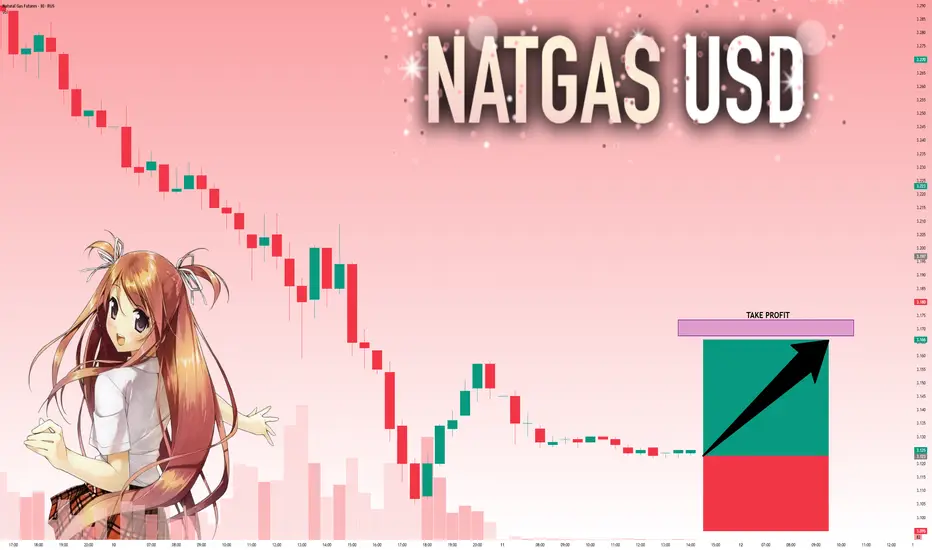
NG1!: Move Up Expected! Long!
My dear friends,
Today we will analyse NG1! together☺️
The market is at an inflection zone and price has now reached an area around 3.123 where previous reversals or breakouts have occurred.And a price reaction that we are seeing on multiple timeframes here could signal the next move up so we can enter on confirmation, and target the next key level of 3.167.Stop-loss is recommended beyond the inflection zone.
❤️Sending you lots of Love and Hugs❤️
NI225: Local Bullish Bias! Long!
My dear friends,
Today we will analyse NI225 together☺️
The price is near a wide key level
and the pair is approaching a significant decision level of 48,088.75 Therefore, a strong bullish reaction here could determine the next move up.We will watch for a confirmation candle, and then target the next key level of 48,238.47.Recommend Stop-loss is beyond the current level.
❤️Sending you lots of Love and Hugs❤️

EURCAD BULLISH BREAKOUT|LONG|
✅EURCAD shows a clean breakout above the key level, confirming a bullish shift in market structure. ICT concepts suggest a potential retest before continuation toward 1.63000 where buy-side liquidity rests. Time Frame 3H.
LONG🚀
✅Like and subscribe to never miss a new idea!✅

#ETH #ETHUSDT #ETHEREUM #Analysis #Update #Eddy#ETH #ETHUSDT #ETHEREUM #Analysis #Update #Eddy
According to the formed pattern, namely QM in the RTM style on the weekly block breaker, I expect an upward movement and a ceiling hunt and an ATH of Ethereum, and also in the ICT and liquidity styles, I expect a Fake BOS and a drop to the weekly block order to liquidate long positions and then continue the upward trend according to the analysis I did on the chart and the Path I drew. I expect the Ethereum currency to act accordingly.
So I expect an upward movement, a drop and a re-rise according to this analysis and explanation.
The important upper timeframe area for volatility has been identified and named.
These settings are based on a combination of different styles, including volume style with ict style and a combination of RTM and liquidity style.
Based on your strategy and style, get the necessary confirmations to enter the trade in these volatility settings.
Don't forget about risk and capital management.
The entry point, take profit point and stop loss point along with their values are indicated on the chart.
The responsibility for the transaction is yours and I am not responsible for any failure to comply with your risk management and capital.
🗒 Note: If, according to the analysis, the progress after the main rise begins, I expect the price of Ethereum to reach the targets of the latest analysis provided on Ethereum, which will be attached.
⚠️ Warning: Predicting market movements is a mistake and this analysis may be violated, so do not rush into your decisions and proceed to trade after obtaining the necessary confirmations. Market makers will always surprise us and predicting movements and future movements is a complex and difficult task.
Check out my previous analysis on Ethereum via the link below :

BTC USD reversal BTC showing sign of reversal entry TS on a higher time frame , but and wil be a risky trade so entering on a lower quantity

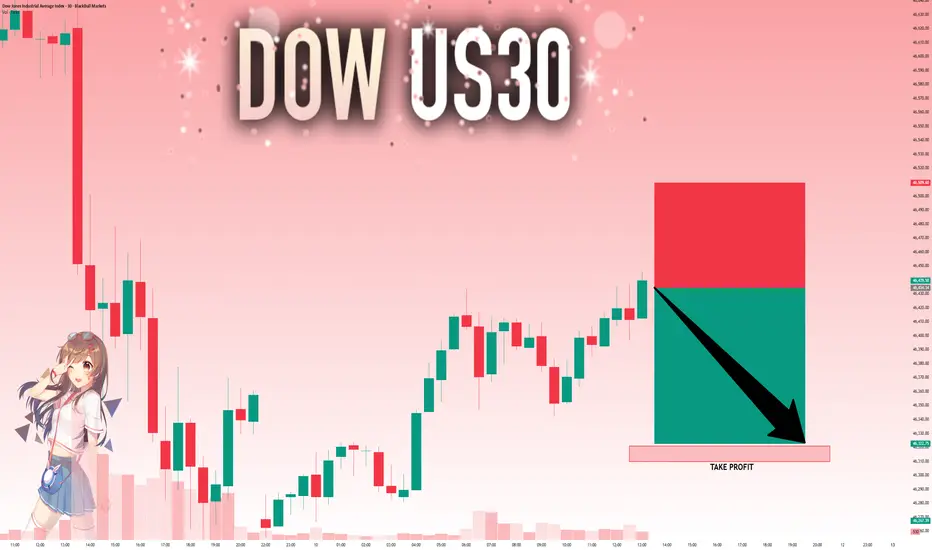
US30: Absolute Price Collapse Ahead! Short!
My dear friends,
Today we will analyse US30 together☺️
The recent price action suggests a shift in mid-term momentum. A break below the current local range around 46,434.34 will confirm the new direction downwards with the target being the next key level of 46,322.75 and a reconvened placement of a stop-loss beyond the range.
❤️Sending you lots of Love and Hugs❤️
GOLD: Will Go Up! Long!
My dear friends,
Today we will analyse GOLD together☺️
The in-trend continuation seems likely as the current long-term trend appears to be strong, and price is holding above a key level of 3,983.49 So a bullish continuation seems plausible, targeting the next high. We should enter on confirmation, and place a stop-loss beyond the recent swing level.
❤️Sending you lots of Love and Hugs❤️

SILVER: The Market Is Looking Down! Short!
My dear friends,
Today we will analyse SILVER together☺️
The market is at an inflection zone and price has now reached an area around 49.885 where previous reversals or breakouts have occurred.And a price reaction that we are seeing on multiple timeframes here could signal the next move down so we can enter on confirmation, and target the next key level of 49.478.Stop-loss is recommended beyond the inflection zone.
❤️Sending you lots of Love and Hugs❤️

EURUSD: Strong Bullish Sentiment! Long!
My dear friends,
Today we will analyse EURUSD together☺️
The price is near a wide key level
and the pair is approaching a significant decision level of 1.15720 Therefore, a strong bullish reaction here could determine the next move up.We will watch for a confirmation candle, and then target the next key level of1.15950.Recommend Stop-loss is beyond the current level.
❤️Sending you lots of Love and Hugs❤️

EURUSD BEARISH BREAKOUT|SHORT|
✅EURUSD confirms a clean breakout below the key level, showing bearish continuation as price rejects premium pricing. Liquidity has been cleared above structure, and Smart Money targets the 1.1520 zone for rebalancing. Time Frame 6H.
SHORT🔥
✅Like and subscribe to never miss a new idea!✅
