XRP - Descending Channel | Breakout or Breakdown? | Massive News
Hey TradingView community! 👋
XRP is at a make-or-break level right now. Let me break down what I'm seeing on the 45-minute chart.
The Setup
XRPUSD is trading at $2.09 inside a clear descending channel that's been in play since early January. Price has been making lower highs and lower lows, but we're now sitting right at a critical support zone around $2.10-2.18.
This is the moment of truth - either buyers step in here and we get a breakout, or we lose this level and continue lower.
Why This Level Matters
Descending channel support being tested RIGHT NOW
$2.10-2.18 zone has acted as support multiple times
Whale activity spiking to 3-month highs - smart money accumulating?
CNBC just called XRP the "new crypto darling"
Massive institutional news dropping (Ripple + BNY, FCA approval, Evernorth partnership)
The News is HUGE
Ripple just had a monster week:
BNY (Bank of New York) tapped Ripple Prime for tokenized deposits - this is massive institutional adoption
Ripple secured FCA authorization in the UK - clearing path for expansion
Evernorth + Doppler Finance partnership to boost XRP as yield-generating asset for institutions
South Korea announcing spot Bitcoin ETFs - XRP ETF momentum building
Analysts saying XRP could outperform Bitcoin on percentage gains
Key Levels I'm Watching
Resistance:
$2.18 - Upper channel resistance / breakout level
$2.32 - Major horizontal resistance
$2.50+ - Bullish target if breakout confirms
Support:
$2.10 - Current support zone (CRITICAL)
$1.90 - Lower channel support
$1.61 - 52-week low area
My Game Plan
This is a two-scenario setup:
Bullish scenario: If XRP holds above $2.10 and breaks out of the descending channel with volume, we could see a sharp move toward $2.32 and potentially $2.50+. The institutional news flow is extremely bullish - BNY partnership, FCA approval, whale accumulation. If Bitcoin pumps, XRP could explode.
Bearish scenario: If we lose $2.10 support and break below the channel, next stop is $1.90. The descending channel trend would continue until we see a clear reversal signal.
The Bottom Line
I'm cautiously bullish here. The news catalysts are incredible - Ripple is getting institutional adoption at a rapid pace. Whale activity at 3-month highs suggests smart money is accumulating. BUT the chart structure is still bearish until we break out of this descending channel.
Watch the $2.10 level closely. Hold = bullish. Break = more downside.
What's your take? Breakout or breakdown? Let me know in the comments! 👇
IDEA

Cipher Mining(CIFR) 1D: compression before expansionCipher Mining is a US-listed Bitcoin mining company with direct exposure to the BTC cycle and infrastructure scalability.
On the daily chart, price is forming a symmetrical triangle after the prior impulse. The key decision zone sits around 15, where the 0.786 Fibonacci level, diagonal support, MA100 and volume profile align. This area defines the execution zone, while direction is confirmed by higher timeframes.
Direction comes from the higher timeframes. On the weekly and monthly charts, indicators maintain a bullish configuration: moving averages are rising and positioned below price, the broader structure remains intact, and oscillators stay neutral-bullish with no reversal signals. This confirms that the current daily consolidation is occurring within a larger bullish context. The daily MA100 acts as dynamic support inside the range, strengthening the importance of the 15 level.
The base scenario assumes support holding at 15 followed by an upside breakout from the triangle. Initial targets sit near 20.5, followed by 25.5. A decisive breakdown below 15 invalidates the setup.
Fundamentally, CIFR remains a cyclical mining play. Revenue remains elevated, with the next quarterly estimate around $88M. EPS is still negative and free cash flow remains under pressure, which is typical during expansion phases. Strong financing inflows help support liquidity and ongoing infrastructure growth. The stock remains a leveraged bet on Bitcoin continuation.
In short: daily defines the entry, weekly and monthly define the direction.

SMR 1D: Small reactors. Big nerves.I am looking at NuScale Power without emotions. After a strong impulsive move, the price is in a deep correction phase and is now forming a base. The key focus is not old trendlines, but current market behavior. On the daily chart, RSI reached oversold levels and started to turn up, while price is no longer making aggressive new lows. This signals weakening selling pressure. Volume increased noticeably in the 16.50–18.00 zone, suggesting accumulation rather than panic selling. This is not a fast reversal, but a classic stabilization phase after a sharp sell off.
From a technical perspective, as long as this base holds, a recovery scenario remains valid. Initial upside levels are around 23.50, followed by 30.65. In a more optimistic scenario, the 42.00 area becomes relevant, but only if momentum and volume continue to confirm.
Fundamentally, NuScale remains a high risk but strategic story. The company continues to develop small modular nuclear reactors, targeting long term demand from energy infrastructure and data centers. As of late 2025, profitability is still negative, with Q4 2025 EPS estimated around −0.16 USD, which is already priced in by the market. Revenue remains modest, with near term estimates around 9 million USD, but the real value lies in government backed programs, long term energy contracts, and the strategic role of SMR technology in the energy transition. This is why the stock reacts sharply to any shift in sentiment around nuclear energy and infrastructure spending.
For me, this is not a place for excitement, but a zone to watch carefully. As long as RSI continues to recover and volume confirms demand, the base scenario stays constructive. If the base fails, the market will quickly remind us that future technologies still come with present day risks.
Nuclear energy promises stability. The SMR chart reminds us that the road there is anything but calm.

DOT: locally long ideaThe dot looks long, both locally and structurally. We need to eliminate the accumulated long-term liquidity, and then we can take off. That's the idea! It's not a setup. If we create this model, we're in. If we fail, we'll just skip it!
BINANCE:DOTUSDT.P

Will APT see 50% growth?Aptos plummeted 61% with no rebounds! There is a high probability of seeing a similar movement until the first short FVG on the daily chart.
I think we will see a similar movement by the end of January or early February.
There are bullish divergences and oversold conditions in the RSI. Technically, there should be a rebound after a 61% drop without rebounds.
BINANCE:APTUSDT.P

GBPUSD SELL | Day Trading AnalysisYou can expect a reaction in the direction of selling from the specified resistance zone
GBPUSD moving higher as it tests the strong resistance level..
We expect a bearish move from the confluence zone.
Hello Traders, here is the full analysis.
I think we can soon see more fall from this range! GOOD LUCK! Great SELL opportunity GBPUSD
I still did my best and this is the most likely count for me at the moment.
-------------------
Traders, if you liked this idea or if you have your own opinion about it, write in the comments. I will be glad 🤝

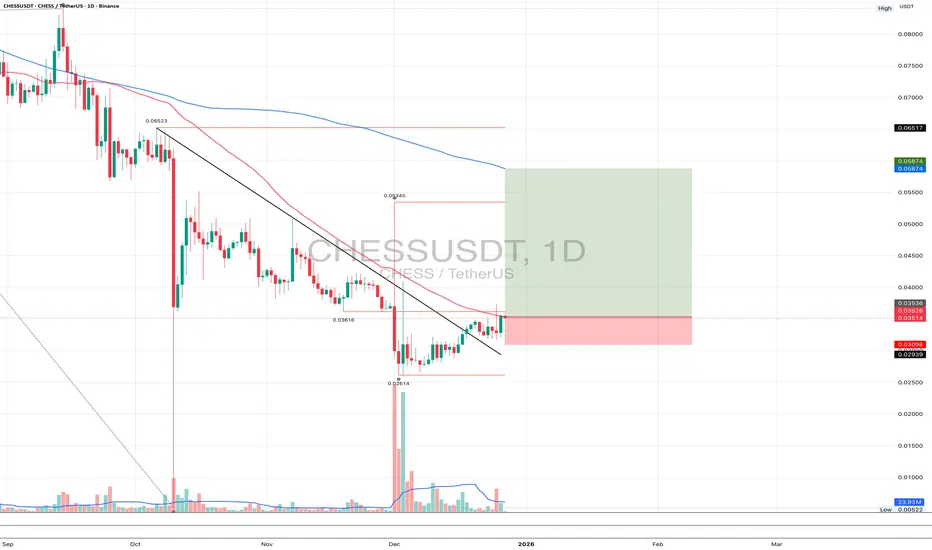
CHESSUSDT 1DShort technical update 👇
On the daily timeframe, CHESS broke its bearish structure and completed a clean retest of the breakout level. The retest held, selling pressure is fading, and higher local lows are forming. The current structure suggests a recovery phase after a prolonged decline. The base scenario is a continuation to the upside with a move toward the MA200 as the next key mid-term target.
Novo Nordisk (NVO) 1WI’m looking at the weekly NVO chart as of late December 2025, and this is no longer about fear or headlines. It’s about structure and valuation. After a powerful multi year rally from 2022 to 2024, the stock went through a deep and healthy correction. In 2025, price built a strong weekly demand base around the 50–55 USD area, where volume profile, historical support and long term buyers align. Selling pressure is fading, volatility is compressing, and price action is stabilizing.
Technically, NVO is transitioning into a post correction accumulation phase. On the weekly timeframe, RSI has recovered from oversold territory and is holding a neutral bullish range. MACD is forming a constructive reversal structure, while declining volume on down moves suggests exhaustion rather than distribution. As long as price holds the weekly base and does not break lower, the recovery scenario remains valid, with upside reference zones near 72–75 USD and later 90–92 USD if momentum confirms.
From a fundamental perspective, as of the end of 2025, Novo Nordisk remains one of the highest quality businesses in global healthcare. Revenue exceeds 39 billion USD, with the Diabetes and Obesity Care segment generating more than 85% of total sales, continuing to show resilient growth. The United States and Europe remain the core revenue drivers, while international markets continue to expand steadily.
Cash flow quality remains strong. Operating cash flow is above 18 billion USD on a TTM basis, free cash flow stays positive despite heavy investments into capacity expansion and R&D. Dividend policy remains disciplined and shareholder friendly, with TTM dividend yield around 2.3% and a payout ratio near 35–36%, leaving room for both reinvestment and future dividend growth.
What matters is that the 2025 correction did not come with any structural deterioration of the business. This was not a business breakdown, but a valuation reset after an extreme growth phase. Expectations have been normalized, multiples compressed, while fundamentals stayed intact. That’s where asymmetry begins to emerge.
Tactically, I see NVO as a long term quality compounder, where 2025 served as a reset year. As long as the weekly structure holds, the path for gradual upside remains open. This is not a short term trade, but a trend rebuilding phase driven by cash flow, market leadership and scale.
Sometimes the best opportunities appear not at peak optimism, but when the market has already done its emotional damage and the numbers are still standing.

Nebius Group N.V. (NBIS) when growth stops being randomI am looking at the weekly chart of NBIS and this is no longer about emotions, it is about structure. Price has formed a stable bullish cycle, broke out from a wide base and is now holding above key moving averages. On the weekly timeframe most indicators have already shifted into buy mode, while the market does not look overheated. RSI remains in a neutral bullish zone, momentum is intact, and pullbacks are being absorbed without aggressive selling pressure.
The 50, 100 and 200 week moving averages are starting to align into a bullish configuration, which often signals a transition into a medium term trend. Volume confirms the move. This is not an empty or purely speculative rally, but one supported by growing participation from longer term capital. Technically, this structure suggests trend continuation with potential for new highs as long as the current range is held.
From a fundamental perspective, Nebius has gone through a major transformation over recent years. Company revenue has increased multiple times compared to prior periods, while the income structure has become more diversified. The core contribution now comes from cloud solutions, infrastructure services and technology driven segments that continue to grow even in a challenging macro environment. EBITDA has returned to a positive trend in recent reporting periods, and operational metrics are improving due to cost optimization and a stronger focus on higher margin business lines.
Yes, the company is still in an investment phase and this is not a classic profit here and now story. However, revenue growth rates, business scaling and expansion of core segments provide a clear long term value setup. This is not hype. It is a bet on a technology platform that is only entering its value realization phase.
Tactically, I view NBIS as a growth stock where the market can continue higher without a deep correction as long as the current structure holds. While price remains above key weekly levels and moving averages, the bullish scenario stays valid. This is not a one day idea. It is a trend that is just beginning to form.
Sometimes the market already knows where the money is going, and in those moments it is better to listen to the chart rather than the headlines.

BTC Update: Chop, Chop, Chopping Wood. Don't get shaken out. BTC Update: Price is doing exactly what I was expecting after the prior expansion phase - chopping and grinding rather than resolving immediately. Despite the growing panic and bearish sentiment, the market has not seen a true downside flush yet. From a structural perspective, this still looks like a higher timeframe consolidation rather than a full trend breakdown.
On the weekly, BTC remains above major cycle support, and the recent weakness appears more corrective than impulsive. Historically, these types of ranges tend to resolve with one final liquidation move to reset positioning. I’m still watching for a sharp downside extension into the ~$70k region, which would represent a deeper test of higher timeframe demand and a more complete sentiment washout.
What stands out most right now is sentiment. Fear has escalated quickly relative to actual structural damage, which is typically what you see before a final flush, not after one. Until that move happens, I expect continued volatility and frustration as the market works through excess leverage.
Assuming a proper reset plays out, this would likely set the stage for a cleaner continuation higher into early next year. For now, patience is key - this phase is about letting the market finish its reset before the next sustained leg develops.

MSTR. When Bitcoin sneezes, Strategy looks for the floorMSTR is deep in a corrective phase after the rally to 543. The current decline does not signal a structural breakdown but a return to a major demand zone at 100–102, where long term support and prior accumulation align. Selling volume is fading, suggesting seller exhaustion rather than panic. As long as price holds above 100–102, the recovery scenario remains valid. Initial rebound targets sit near 230, followed by 300 if market structure stabilizes.
Fundamentally, Strategy remains the most leveraged public Bitcoin proxy. As of December 2025, the company holds over 214000 BTC, making it the largest public Bitcoin holder globally. The average acquisition price remains well below historical highs, reducing long term downside risk. In Q3 2025, the company reported an increase in digital asset value as crypto markets recovered. The core analytics software business remains stable, while debt servicing shows no liquidity stress. Strategy is no longer just a software company. It is a macro Bitcoin instrument in equity form.
When Bitcoin panics, MSTR falls harder. But it usually stands up first when the cycle turns.

Airbnb: Proof that even stocks love to traveThe analysis of Airbnb (ABNB) stock reveals an intriguing setup following the breakout and retest of a key resistance level, which previously acted as a trendline on the daily chart. After successfully breaking above this line and confirming it with a retest, the price is now showing potential for further upside — aligning with a bullish scenario that targets the $164 area, which also coincides with the 1.0 Fibonacci level (164.12).
The current structure suggests the beginning of an upward movement after a period of consolidation, with both the 50-day and 200-day moving averages (MA50 and MA200) positioned to support further growth, reinforcing the overall bullish outlook.
Notably, trading volume has increased in line with the breakout and continued price movement, adding confidence to the scenario playing out toward the higher targets. Key Fibonacci resistance levels to watch next include 0.786 (150.37) and 1.272 (181.61), with a long-term extension target at 1.618 (203.85).

LULU 1D - stretching into a comebackOn the daily chart of Lululemon Athletica (LULU), a clean AB=CD pattern is forming, signaling a potential end to the correction and the beginning of a new upward wave. The price has tested the strong buy zone between 164–167, aligned with a major daily support level and rising volume - a classic setup indicating that buyers are regaining control.
Technically , the structure is highly symmetrical, RSI shows a bullish divergence, and the 50-day moving average is starting to turn upward - all suggesting a possible trend reversal. The first upside target for this pattern is $230, followed by a second target at $340, which corresponds to the 1.272 and 1.618 Fibonacci extensions.
From a fundamental standpoint, Lululemon remains a powerhouse in the premium activewear market, maintaining strong brand loyalty even amid competition from Nike and Alo. The company continues to expand its men’s line and footwear segment, which now accounts for over 25% of total revenue. International growth remains robust, with new stores opening in South Korea, the UAE, and Germany. Lululemon’s shift toward higher-margin online sales and more efficient logistics continues to strengthen its profitability.
In the latest quarterly report (September 2025), revenue grew by 9% year-over-year, and EPS came in above Wall Street expectations. High customer retention - over 90% repeat purchase rate - and stable gross margins create a solid foundation for a mid-term recovery in the stock.
Tactical plan: watch for entries within the 164–167 buy zone, consider partial profit-taking near $230, and target $340 if momentum extends. Just like in yoga, patience and balance lead to the best results.

ESPR 1W: cholesterol therapy for patients and investors alikeEsperion Therapeutics (ESPR) has broken its long descending trendline and retested the $2.4–$2.6 support area, forming a solid triple bottom with rising volume. The stock is now holding above key moving averages, signaling accumulation. While above $2.5, the technical setup points to a move toward $6.4, aligning with major resistance and the 200-week MA.
Fundamentally, the company enters one of its strongest phases in years. Following earlier liquidity struggles, Esperion has stabilized its operations and regained investor confidence. The core growth driver is Nexletol (bempedoic acid), a non-statin cholesterol-lowering therapy for patients intolerant to statins. In 2025, combined Nexletol and Nexlizet sales jumped over 45% year-on-year, surpassing $170 million for the first nine months. Recent safety data were positive, leading to new approvals across Europe and Japan - expanding partnerships and licensing revenues. Cash position strengthened via milestone payments from Daiichi Sankyo and Viatris, reducing debt and supporting R&D without new dilution. Challenges remain: profitability is still out of reach, as marketing and development expenses stay high, though liquidity provides breathing room. The broader biotech sector’s rebound amid rate-cut expectations adds tailwind to revenue-backed small caps like Esperion.
Tactically, holding above $2.5 keeps the bullish trajectory intact toward $6.4. A weekly close below $2.3 would negate the setup and re-test lower support, though current accumulation favors the upside.
Esperion helps reduce cholesterol - ironic that its chart still raises investors’ heart rate.

SOFI 1D double checking the bill before the next moveSOFI is trading at 27.09 and may retrace toward 25.00, which is a strong demand area combining the 0.786 retracement level, a major VWAP node and a visible volume cluster. Since September 25 the price has been moving inside a broadening channel, signalling liquidity expansion. The 25.00 level remains a balance zone with proven buyers. The pullback from 32.73 looks like a structural retest.
Fundamentally SOFI stays strong as of December 11 2025. The company reports more than 8.2 million members and around 2.5 billion USD in annual revenue. The lending segment generates over 1.3 billion USD, and the banking division adds about 0.85 billion USD. Operating cash flow is positive. Recent news includes an expanded partnership with Mastercard, a new corporate credit platform and full Technisys integration.
As long as the price holds above 25.00, the bullish structure remains valid. A rebound from demand opens the path toward 29.20, 34.51 and 41.48. VWAP and volume behavior confirm buyer interest.
Fintech never avoids a plot twist. SOFI seems to be preparing one more dip before the next act.

EURCHF 1D EURCHF shows a clean technical structure that rarely deceives a focused trader. After a strong impulse price reacted precisely at the 0.786 Fibonacci level at 0.93884 confirming strong demand near the upper boundary of the range. The current setup suggests a pullback toward the 0.5 Fibonacci level at 0.93123 which forms the optimal continuation zone. As long as price maintains this area the trend remains bullish and limits the risk of a deeper correction. Once the market stabilises above the Fibonacci cluster the first target stands at 0.94419. The second target at 0.96107 reflects the natural extension of the current impulse. Volume supports buyers and creates favourable conditions for a sustained move higher. The logic here is simple the market pauses only to regain strength for the next leg.

LONG USD/CADAs we seek last week, the sharp decline that happened in last Friday which was affected by strong jobs 53 k versus-1.5k , this decline was a trap for loonie then the fed will cut rates with 25 basis points with 90 % confirmation and central bank of Canada will hold rates this week , so the fed rate is still higher and more attractive than CAD after cut off with 1.5% increase for USD ( 3.75% for US 2.25 % for CAD) so still more good for USD to be bullish in the next week

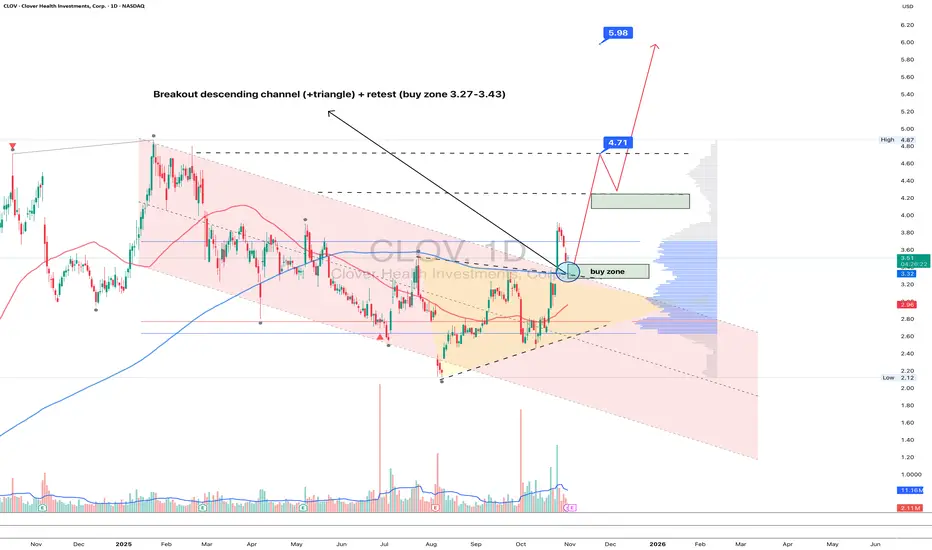
CLOV 1D - Health Is Back in TrendOn the daily chart, Clover Health (CLOV) has broken out of its descending channel and triangle, now pulling back for a retest near 3.27–3.43 - a key buy zone aligned with the MA50. Buyers are clearly regaining control, and the setup looks ready for continuation.
Technically:
– first clean breakout of the downtrend since January 2025;
– volume expansion on bullish candles, suggesting institutional accumulation;
– holding above the former resistance turned support.
Upside targets: $4.71 (local volume peak) and $5.98, offering +70% potential upside if momentum sustains.
From a fundamental perspective, Clover Health is stabilizing its business:
– a leading player in Medicare Advantage, with an expanding senior member base;
– Q3 results show 40% reduction in net loss and +18% YoY revenue growth;
– leveraging AI-driven healthcare analytics to improve efficiency and patient outcomes;
– with high short interest, a confirmed breakout above $4.70 could ignite a short squeeze.
Tactical plan: accumulation near 3.27–3.43, add above 4.70, targets 4.71 → 5.98. Sometimes the healthiest trend is the bullish one.
WLFI/USDT Analysis — Long Setup
Below the current price, strong seller volumes were accumulated. When price returns to the $0.157–$0.154 zone, it is reasonable to expect those positions to be closed at breakeven.
We consider a long setup if a clear bullish reaction occurs from this zone, with a target at $0.17.
This publication is not financial advice.

BITCOIN - PRESSURE BUILDING - SHORT SQUEEZE INCOMING?Traders,
Bitcoin might be preparing a short squeeze. Let’s walk through the flow, structure, math, and correlations step-by-step so you understand what is happening and why it matters.
1. What Happened
Bitcoin dumped from 96k → 80.6k last week. Price then bounced and is now trading around 87k.
Under the surface:
Stablecoin-Margined Futures (USDT-M)
Since 27 Oct:
OI increased from 225k → 280k contracts
That’s +55k contracts (~24% increase)
CVD went down, not up
Meaning:
These new positions were mostly shorts
The market added leveraged short exposure during the dump
Interpretation:
USDT-M traders attacked the move lower aggressively. Increasing OI + dropping CVD = new sellers dominating, not buyers.
Coin-Margined Futures (BTC-M)
Since 27 Oct:
OI and CVD both dropped from 7.41B → 5.90B
BTC-M is usually “higher conviction” demand
A drop in BTC-M CVD means
Longs closing
Capitulation
Reduced bullish positioning
Interpretation:
Native BTC longs stepped aside. Short-term leverage traders pressed the downside.
Spot + Futures CVD (27 Oct → 21 Nov)
Spot CVD ↓
Futures CVD ↓
Price ↓
All making lower lows and lower highs
This was a clean, correlated downtrend.
2. The First Major Shift: Spot CVD Divergence
Since 21 November:
Spot CVD:
Higher highs
Higher lows
Rising together with price
Indicates real demand stepping in
Stablecoin Futures (USDT-M):
Still making lower lows
Still pressing shorts
Still fighting the spot buyers
This is the key:
Spot = real money
Futures = leveraged speculation
Rising spot CVD vs falling futures CVD = absorption pattern
Meaning:
Strong hands buy
Weak shorts keep selling
Price rises anyway
The pressure builds
Shorts eventually run out
The squeeze begins
This is one of the cleanest pre-squeeze structures you can get.
3. The Math: Fibonacci Rotation Logic
Let’s break down the structure.
(A → B → C Structure)
A = 116k (27 Oct)
B = 98.710
C = 107.403 (retracement)
The retrace sits at 0.5.
The reciprocal extension is 2.0
The 2.0 extension lands exactly at the 21 Nov wick (~81k)
This is a perfect harmonic rotation.
(X → Z → A Extension)
X = 06 Oct high
Z = 18 Oct low
A = 27 Oct high
Fibonacci extension from X → Z → A:
1.618 extension = 80.544
It matches the 2.0 from the ABC structure
It matches the 0.886 retracement on the HTF
Three independent mathematical signals hitting the same level. This is extremely rare and confirms the 81k zone as a rotation completion.
4. Structure Break
Since the 10 Nov low:
4H is making higher highs & higher lows
The descending trendline from 11 Nov is broken
Trend shifted from controlled downtrend → early reversal
Structure now favors continuation upwards as long as higher lows hold
Interpretation:
Sellers who relied on the trendline no longer have control.
4.5 Intermarket Correlation: Why Bitcoin Dumped When ES Dumped
Another important factor:
Bitcoin dumped because ES dumped.
From 12 Nov → 21 Nov:
S&P500 (ES)
Dropped from 6900 → 6525
–5.43% correction
Bitcoin:
Dropped from 107k → 80.5k
–24.77% correction
BTC acted as a ~4.5× levered version of ES.
BTC acted as a ~4.5× levered version of ES.
Correlation Data:
Rolling BTC/ES correlation increased from 0.38 → 0.74
Meaning BTC traded almost in sync with equities during the selloff
Why?
Risk-Off Mechanics
When ES sells off:
Equity funds de-risk
Macro algos rotate out of high beta
Volatility spikes
Systematic funds reduce exposure
Crypto is treated as “high beta tech”
BTC amplifies the move by a factor of 3–5×
Bitcoin didn’t dump because crypto was weak — It dumped because macro markets were risk-off.
Why this matters now
ES has stabilized
BTC stopped following ES lower
Spot demand started rising
BTC/ES correlation is dropping again (from 0.78 → ~0.55)
USDT-M shorts didn’t adjust
This is exactly when short squeezes start on BTC:
Macro stabilizes
Crypto regains independence
Shorts remain positioned for risk-off
Spot buyers take control
Price accelerates upward
This is a classic intermarket correlation unwind.
5. USDT Dominance (USDT.D) Confirms Risk Rotation
USDT dominance has turned down, which means:
Traders are deploying capital
Less stablecoin sitting idle
More risk-on appetite
Historically aligns with BTC beginning new legs up after HTF rotations
When USDT.D falls at the same time spot CVD rises, the market is shifting capital into crypto.
6. Targets: 118.5k → 124k
These are the next liquidity magnets.
Target #1: 118.5k
Confluences with:
1.141 extension of the 11 Nov → 12 Nov move
First major liquidity pool
First real “decision point” for the market
Target #2: 124k
Confluences with:
A weak high that will be swept
1.618 extension of the same 11→12 Nov move
Natural squeeze exhaustion zone
Perfect location for a Swing Fail Pattern
Rotation Logic
Shallow retraces → larger extensions (1.618 → 2.0)
Deep retraces → smaller extensions (1.272 → 1.414)
BTC currently fits the shallow retrace profile → favors strong extension
7. Other Pivot Points
Marked on the chart:
Minor LVNs
Minor-imbalances
CME Gaps
Expect reaction at each point.
8. Invalidation & Bearish Pathway
My invalidation is clear:
Trading below 80k invalidates the squeeze setup.
Below 80k, the absorption breaks.
If 80k is lost, the downside extension levels become:
74k
70k
64k
These levels are:
The natural downside extension pathways from the 11 Nov → 21 Nov swing
They form the mirrored rotation of the bullish structure
Final View
We dumped because macro went risk-off
Bitcoin amplified the ES selloff
Shorts loaded heavily into the move
Spot buyers stepped in first
A clean absorption pattern formed
Mathematical rotation completed at ~81k
Structure flipped
Risk metrics like USDT.D turned down
Correlation with ES is now unwinding
If Bitcoin continues to hold above 80k and spot keeps leading, the squeeze toward 118.5k → 124k becomes the most likely path.
Abbreviation List
BTC – Bitcoin
ES – S&P500 E-Mini Futures
OI – Open Interest
CVD – Cumulative Volume Delta
USDT-M – Stablecoin-Margined Futures
BTC-M – Coin-Margined Futures
HTF – Higher Timeframe
LVN – Low Volume Node
AVWAP – Anchored Volume-Weighted Average Price
PRZ – Potential Reversal Zone
SFP – Swing Fail Pattern
Fib – Fibonacci
CTA – Commodity Trading Advisor (systematic trend-following funds)
VIX – Volatility Index
Beta – Sensitivity of an asset’s movement relative to a benchmark
Risk-Off – Market environment where investors reduce exposure to risky assets
Risk-On – Market environment where investors increase exposure to risky assets
-----
If you enjoy this type of deep, data-driven breakdown—spot vs futures, CVD flow, intermarket correlation, and rotation math—drop a like and leave a comment. It helps me see whether these higher-level analyses bring value, and it motivates me to keep sharing them for free.

FUBO 1D is testing investor patienceFUBO is testing investor patience, yet it looks like a recovery candidate
FUBO is once again testing the major daily support zone between 2.90 and 3.00. This area is confirmed by rising volumes on pullbacks, consistent buyer reactions and a developing bullish divergence on oscillators. Recent price behavior suggests stabilization and the early phase of accumulation. The first confirmation of strength will appear after a breakout and close above 3.72. This level is the nearest structural resistance. Once price holds above it, the targets at 4.39 and 4.72 become active. As long as price stays above the support between 2.90 and 3.00, the primary scenario remains bullish.
FuboTV operates in the sports streaming segment. Recent results show revenue growth, rising average revenue per user and strengthening subscriber retention. The company continues to optimize expenses and expand partnerships across the sports broadcast ecosystem. Demand for live sports content remains strong which supports long term fundamentals.
As long as the support holds, the idea of a reversal base remains valid. A breakdown below 2.90 and 3.00 would open the door to deeper correction, yet the combination of volume and divergence signals increases the probability of a recovery.
Markets often whisper before they shout. The reaction at this support suggests that buyers are already preparing their voice.

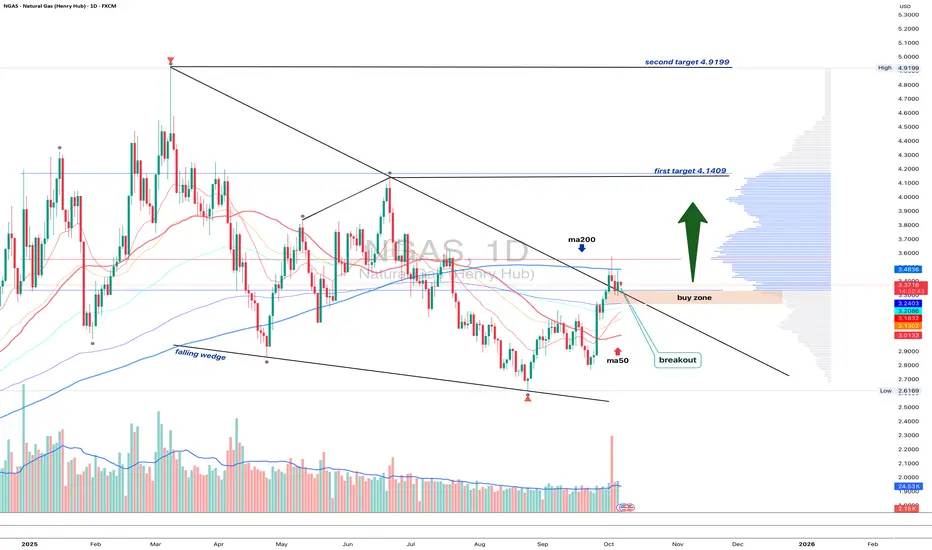
NGAS 1D - bulls waiting for the green lightOn the daily chart, Natural Gas has broken out of a falling wedge, but price remains below the MA200, while EMA still hovers above it - a mixed signal showing short-term hesitation within a longer-term downtrend.
The 3.10–3.20 buy zone remains key - that’s where the retest area aligns with short-term support. If buyers can reclaim the EMA and push above the MA200, the next upside targets are 4.14 and then 4.92.
Volume on the breakout supports growing bullish interest, while fundamentals - like rising seasonal demand - may soon add more fuel to the move.
Tactically , watch how price behaves near MA200. Once EMA flips back on top, momentum could accelerate fast. Until then, the market’s like a gas burner waiting for that click - ignition pending