Top 10 Technical Indicators for Successful TradingTop 10 technical indicators for successful trading
Introduction:
Technical indicators are essential tools for traders to analyze market trends, identify potential trading opportunities, and manage risk. These indicators are mathematical calculations based on past price and volume data that can help traders make informed decisions about buying or selling assets. In this article, we'll discuss the top technical indicators that traders can use to enhance their trading strategies.
Moving Average:
A moving average is a widely used technical indicator that helps traders identify market trends. A moving average is calculated by averaging the price of an asset over a specific period, such as 10 days or 50 days. This indicator smooths out the price data and makes it easier for traders to identify the direction of the trend. When the price is above the moving average, it's considered a bullish trend, and when the price is below the moving average, it's considered a bearish trend.
Relative Strength Index (RSI):
The Relative Strength Index (RSI) is a momentum oscillator that measures the strength of a price trend. The RSI is calculated by comparing the average gains and losses over a specific period, typically 14 days. The RSI value ranges from 0 to 100, with values above 70 indicating an overbought market, and values below 30 indicating an oversold market. Traders can use the RSI to identify potential trend reversals and overbought or oversold conditions in the market.
Bollinger Bands:
Bollinger Bands are another widely used technical indicator that helps traders identify potential trend reversals and price volatility. Bollinger Bands consist of three lines: a moving average in the center, and two outer bands that represent the standard deviation of the price data. When the price is within the bands, it's considered normal market volatility. However, when the price reaches the outer bands, it's considered an overbought or oversold condition, and a potential reversal may be imminent.
MACD (Moving Average Convergence Divergence):
The Moving Average Convergence Divergence (MACD) is a trend-following momentum indicator that helps traders identify changes in momentum and trend reversals. The MACD is calculated by subtracting the 26-day exponential moving average (EMA) from the 12-day EMA. A signal line, which is a 9-day EMA of the MACD, is also plotted on the chart. Traders can use the MACD to identify potential buy and sell signals, as well as divergences between the MACD and the price of the asset.
Fibonacci Retracements:
Fibonacci Retracements are a popular technical indicator that helps traders identify potential support and resistance levels. Fibonacci Retracements are based on the idea that prices tend to retrace a predictable portion of a move, after which they may continue in the original direction. Traders can use Fibonacci retracements to identify potential entry and exit points, as well as stop-loss levels.
Stochastic Oscillator:
The Stochastic Oscillator is another momentum oscillator that helps traders identify overbought and oversold conditions in the market. The Stochastic Oscillator is calculated by comparing the closing price of an asset to its price range over a specific period. The Stochastic Oscillator value ranges from 0 to 100, with values above 80 indicating an overbought market, and values below 20 indicating an oversold market. Traders can use the Stochastic Oscillator to identify potential trend reversals and overbought or oversold conditions in the market.
Average True Range (ATR):
Average True Range (ATR) is a technical indicator that measures the volatility of a stock or currency. Developed by J. Welles Wilder Jr., ATR calculates the average range of price movements over a specific period, taking into account gaps in price movements. ATR is typically calculated over a period of 14 days, but traders can adjust this period to fit their specific trading strategy.
To calculate ATR, traders first calculate the true range (TR), which is the greatest of the following:
Current high minus the current low
Absolute value of the current high minus the previous close
Absolute value of the current low minus the previous close
Once the true range is calculated, traders can calculate the ATR by taking an average of the true range over a specific period.
ATR can be used to measure volatility in the market, helping traders to identify potential trading opportunities. When ATR is high, it indicates that there is a lot of volatility in the market, which can present opportunities for traders to profit. Conversely, when ATR is low, it indicates that the market is relatively stable, and traders may want to avoid entering trades at that time.
Ichimoku Cloud:
The Ichimoku Cloud, also known as Ichimoku Kinko Hyo, is a technical indicator that provides a comprehensive view of potential support and resistance levels, trend direction, and momentum. The indicator was developed by Japanese journalist Goichi Hosoda in the late 1930s and has gained popularity among traders in recent years.
The Ichimoku Cloud consists of five lines, each providing a different view of the market:
Tenkan-Sen: This line represents the average of the highest high and the lowest low over the past nine periods.
Kijun-Sen: This line represents the average of the highest high and the lowest low over the past 26 periods.
Chikou Span: This line represents the current closing price shifted back 26 periods.
Senkou Span A: This line represents the average of the Tenkan-Sen and Kijun-Sen, shifted forward 26 periods.
Senkou Span B: This line represents the average of the highest high and the lowest low over the past 52 periods, shifted forward 26 periods.
The area between Senkou Span A and Senkou Span B is referred to as the "cloud" and is used to identify potential support and resistance levels. When the price is above the cloud, it indicates a bullish trend, and when the price is below the cloud, it indicates a bearish trend.
Traders can also use the Tenkan-Sen and Kijun-Sen lines to identify potential entry and exit points, with a bullish crossover of the Tenkan-Sen above the Kijun-Sen indicating a potential buying opportunity, and a bearish crossover of the Tenkan-Sen below the Kijun-Sen indicating a potential selling opportunity.
Conclusion:
In conclusion, technical indicators are valuable tools for traders in the financial markets. The Average True Range (ATR) can be used to measure volatility in the market, while the Ichimoku Cloud provides a comprehensive view of potential support and resistance levels, trend direction, and momentum. By using these indicators in combination with other technical analysis tools and market knowledge, traders can make informed trading decisions and improve their chances of success. It's important for traders to experiment with different indicators and find the ones that work best for their trading strategy.
Indicators

Perfect BBands Strateg. w/ Indic. SetupThis one is for anybody looking to try a new consistently solid strategy with multiple intuitive indicators setup that is not automated - yet.
But, since the strategy part of this setup relies mostly on a simple but effective BBands strategy (I've found best results with 15m), it shouldn't be that hard to get automation setup.
As it is now, the indicators included in this setup work perfectly together to give even beginner traders a rather good idea of where the trend is going and when to enter/exit their trades.
This is a great setup for those using a free TV account since it combines certain indicators together by making use of the Pine Editor. So technically, only 3 indicators/strategies are used. In this case, 2 indicators and 1 strategy.
All features of the indicators combined in terms of being able to adjust settings for each can still be fine tuned and have not been negatively impacted by the merging of multiple indicators.
If you like this setup or have any suggestions to improve it, please let me know and if you consider testing this out with automation - send me a private message and let's discuss it.

✔️Confluence Trading📍What is “confluence trading”?
“Confluence trading” is when you combine more than one trading technique or analysis to increase your odds of a winning trade.
You use multiple trading indicators that all give the same “reading”, as a way to confirm the validity of a potential buy or sell signal.
Confluence refers to any circumstance where you see multiple trade signals lining up on your charts and telling you to take a trade.
Here are some indicators, chart patterns and candlestick patterns you can use for confirmation of your trade.
🔹Indicators
Moving Average (MA)
Relative Strength Index (RSI)
Bollinger Bands
Fibonacci retracement
Stochastic Oscillator
MACD
Average Directional Index (ADX)
Ichimoku Kinko Hyo
Parabolic SAR
Williams %R
🔹Chart Patterns
Head and Shoulders
Double Top and Double Bottom
Triple Top and Triple Bottom
Flag and Pennant
Cup and Handle
Wedge
Rectangle
Symmetrical Triangle
Ascending Triangle
Descending Triangle
🔹Candlestick patterns
Doji
Hammer
Hanging Man
Shooting Star
Inverted Hammer
Bullish Engulfing Pattern
Bearish Engulfing Pattern
Piercing Pattern
Dark Cloud Cover
Morning Star and Evening Star
👤 @AlgoBuddy
📅 Daily Ideas about market update, psychology & indicators
❤️ If you appreciate our work, please like, comment and follow ❤️

How to Trade the Markets - Step 2 - Develop the Mega TrendHello,
In this video series i will be walking you through my new approach on how i am currently trading the markets.
Step 2 - Develop the Mega Trend
Once you have entered your position and set your stop loss, you will then want to align the Trend Meters with your current lifeline candle. Ultimately we want to see the next day candle break below the previous day of support and start to create space from our position. We align the 7,14 and 21 Trend Meters to confirm the development for a Mega Trend winning position. Let it run and work for you!
We will exit and rotate the position once we have a confirmation from the Trend Meters.
Follow up videos will come in the future to show you how this has performed for the year.
Simplicity is key. Tight stops are key. Mega Trend is WINNING.
Take care.

Mastering the Art of Technical Analysis (Part 6)Advantages of Technical Analysis
- Easy to Use: Technical analysis is easy to use and understand, making it accessible to traders of all levels of experience.
- Objective: Technical analysis is objective, as it relies on data and mathematical calculations rather than subjective opinions.
- Helps Identify Trends: Technical analysis helps traders identify trends, which can be used to make informed trading decisions.
- Provides Entry and Exit Points: Technical analysis can help traders determine entry and exit points for trades, allowing them to make profitable trades.
- Can be Used with Any Asset Class: Technical analysis can be used with any asset class, including stocks, commodities, and forex.
Disadvantages of Technical Analysis
- Past Performance Doesn't Guarantee Future Results: While technical analysis is based on historical data, it does not guarantee future results.
- Can be Subjective: Technical analysis can be subjective, as traders may interpret the same data differently.
- Not Suitable for All Market Conditions: Technical analysis may not be suitable for all market conditions, as some markets may be too volatile or have limited historical data.
- Overreliance on Indicators: Some traders may over rely on technical indicators, which can lead to false signals and poor trading decisions.
- Requires Constant Monitoring: Technical analysis requires constant monitoring of market data and indicators, which can be time-consuming.
Mastering the Art of Technical Analysis (Part 3)Technical indicators are mathematical calculations that are applied to price and volume data to identify potential trading opportunities. They are based on the belief that certain patterns or trends in price and volume data can provide insights into market trends and potential price movements. Technical indicators can be used to confirm trends, identify potential entry and exit points for trades, and to provide signals for when to buy or sell.
Moving Averages
Moving averages are one of the most common technical indicators used by traders. They are used to smooth out the price data and provide a clearer picture of the overall trend. Moving averages can be calculated using different time periods, such as 50-day moving average or a 200-day moving average. A crossover between a shorter-term moving average and a longer-term moving average is often used as a signal for when to buy or sell.
Relative Strength Index (RSI)
The Relative Strength Index (RSI) is a momentum oscillator that measures the speed and change of price movements. The RSI ranges from 0 to 100, with readings above 70 considered overbought and readings below 30 considered oversold. Traders often use the RSI to identify potential trend reversals or to confirm trends.
Bollinger Bands
Bollinger Bands are a technical indicator that is used to measure volatility. They consist of three lines - a simple moving average (SMA) in the middle, and two outer bands that are two standard deviations away from the SMA. The outer bands represent the upper and lower price ranges, and the width of the bands changes based on the volatility of the asset. Traders often use Bollinger Bands to identify potential entry and exit points for trades.
Moving Average Convergence Divergence (MACD)
The Moving Average Convergence Divergence (MACD) is a trend-following momentum indicator that uses two moving averages of different lengths to identify potential entry and exit points for trades. The MACD line is calculated by subtracting the 26-day exponential moving average (EMA) from the 12-day EMA. A signal line, which is a 9-day EMA, is then plotted on top of the MACD line. Traders often use the MACD to identify potential trend reversals or to confirm trends.
Fibonacci Retracement
The Fibonacci retracement is a technical indicator that is used to identify potential support and resistance levels based on the Fibonacci sequence. The Fibonacci sequence is a mathematical sequence of numbers, in which each number is the sum of the two preceding numbers. The retracement levels are calculated based on the high and low points of a particular price movement, and they are used to identify potential entry and exit points for trades.

How to Trade With Relative Strength Index (RSI) Indicator
Hey traders,
Relative strength index is a classic technical indicator.
It is frequently applied to spot a market reversal.
RSI divergence is considered to be a quite reliable signal of a coming trend violation and change.
Though newbie traders think that the application of the divergence is quite complicated, in practice, you can easily identify it with the following tips:
💠First of all, let's start with the settings.
For the input, we will take 7/close.
For the levels, we will take 80/20.
Then about the preconditions:
1️⃣ Firstly, the market must trade in a trend ( bullish or bearish )
with a sequence of lower lows / lower highs ( bearish trend ) or higher highs / higher lows ( bullish trend ).
2️⃣ Secondly, RSI must reach the overbought/oversold condition (80/20 levels) with one of the higher highs/higher lows.
3️⃣ Thirdly, with a consequent market higher high / lower low, RSI must show the lower high / higher low instead.
➡️ Once all these conditions are met, you spotted RSI Divergence.
A strong counter-trend movement will be expected.
Also, I should say something about a time frame selection.
Personally, I prefer to apply it on a daily time frame, however, I know that scalpers apply divergence on intraday time frames as well.
❗️Remember, that it is preferable to trade the divergence in a combination with some price action pattern or some other reversal signal.
Let me know, traders, what do you want to learn in the next educational post?

Strategy Coding 04: Strategies vs IndicatorsIn this episode we cover some key differences about strategies and indicators including how alerting is different.
We also review my latest library that can simulate a position in an indicator.

🔥TOP FIVE INDICATORS FOR BEGINNERS🔥
📊ON-BALANCE VOLUME(OVB) IS:
On-balance volume (OBV) is a technical trading momentum indicator that uses volume flow to predict changes in the price.The theory behind OBV is based on the distinction between smart money – namely, institutional investors – and less sophisticated retail investors. As mutual funds and pension funds begin to buy into an issue that retail investors are selling, volume may increase even as the price remains relatively level. Eventually, volume drives the price upward. At that point, larger investors begin to sell, and smaller investors begin buying.
📊MOVING AVERAGE IS:
A moving average helps cut down the amount of noise on a price chart. Look at the direction of the moving average to get a basic idea of which way the price is moving. If it is angled up, the price is moving up (or was recently) overall; angled down, and the price is moving down overall; moving sideways, and the price is likely in a range.A moving average can also act as support or resistance
📊RELATIVE STRENGTH INDEX IS:
The relative strength index (RSI) is a momentum indicator used in technical analysis. RSI measures the speed and magnitude of the pair’s recent price changes to evaluate overvalued or undervalued conditions in the price of that pair. It can also indicate pairs that may be primed for a trend reversal or corrective pullback in price. It can signal when to buy and sell. The RSI is displayed as an oscillator (a line graph) on a scale of zero to 100Traditionally, an RSI reading of 70 or above indicates an overbought situation. A reading of 30 or below indicates an oversold condition.
📊BOLLINGER BANDS ARE:
Bollinger Bands are a form of technical analysis that traders use to plot trend lines that are two standard deviations away from the simple moving average price of a security. The goal is to help a trader know when to enter or exit a position by identifying when an asset has been overbought or oversold. Bollinger Bands were designed by John Bollinger. Bollinger Bands help by signaling changes in volatility. For generally steady ranges of a security, such as many currency pairs, Bollinger Bands act as relatively clear signals for buying and selling
📊MOVING AVERAGE CONVERGENCE DIVERGENCE(MACD) IS:
The concept behind the MACD is fairly straightforward. Essentially, it calculates the difference between an instrument's 26-day and 12-day exponential moving averages (EMA). In calculating their values, both moving averages use the closing prices of whatever period is measured. On the MACD chart, a nine-period EMA of the MACD itself is also plotted. This line is called the signal line, which acts as a trigger for buy and sell decisions. The MACD is considered the "faster" line because the points plotted move more than the signal line, which is regarded as the "slower" line.
I Hope you guys learned something new today✅
Wish you all Best Of Luck👍
😇And may the odds be always in your favor😇
Do you like this post? Do you want more articles like that?

Educational (divergence + volume)Hi guys, in order to spot a divergence you should be careful which timeframe you're looking at. for example in the left picture, the daily timeframe is showing higher highs in price (at each candle) and lower highs in RSI (at each candle). but note that these are not highs and lows and as long as you can't find signs of accumulation and distribution in highs and lows (as long as there's no valid consolidation) you can't name them as highs and lows. so there's no divergence. but in the lower time frame (what is shown is 4h) you can see it more clearer that for every candle in the daily time frame, you have a specific trend in the 4H timeframe. so you can name them as highs and lows and yes, there is a divergence now.
also, keep in mind that in the lower timeframe. every time you're making a new high in rsi, you should expect it to be more volatile and be more sensitive in a way that in the next new rsi high, you have less time spent in the overbought area.
The next part is about the volume profile. you have less resistance in front of the price movement where there is less volume traded in the past. BUT NOT ALWAYS!
less trades made in the past in an area means two things:
1- you can expect the price to move faster and sharper and take less time in that area
2- if the price wants to make a low or high or a pattern, it's less predictable and there's more chance of wrong analysis and fake patterns.
Feel free to leave any comments and ask questions!

Why you should only think about charts when looking at chartsHello?
Traders, welcome.
If you "Follow", you can always get new information quickly.
Please also click "Boost".
Have a nice day.
-------------------------------------
When looking at the investment market, the first thing to do is to analyze the chart, and I wanted to say that the most important thing is how to create a trading strategy that suits your investment style with that chart.
-------------------------------------------------
Most people try to predict the movement of the investment market by looking at the announcement of various economic indicators and the contents of global issues (war, corona, etc.).
A big issue must be something that can cause great volatility in the investment market, but it is also clear that when such an issue accumulates, it can no longer create volatility.
So, you should be careful that trying to predict the movement of the investment market with such issues can make a wrong prediction.
Sudden big issues For example, in the case of a global shock due to an issue such as the 9/11 terrorist attack, it may cause great volatility without time to respond.
Other than these issues, most of the chart's price movement will react first.
In order to see this pre-reflection in advance, you need to look at the chart without reflecting factors that can change your psychological state, such as the announcement of various economic indicators or global issues.
I don't think this kind of work is a big deal, but it is a very important factor that occupies a fairly important part of investing.
We need to think a lot about how to figure out the trend only with the movement of the chart, away from the announcement of various economic indicators and thoughts about global issues.
As it rises above the indicator called Low, which was created on June 19, 2022, we can see that it is splitting the flow of the chart in half.
A change in the -100 indicator has always completed a low.
Although it is currently showing a different look than before, it will form a low as long as the -100 indicator is created.
The +100 indicator is an indicator that starts generating when a high is formed.
Therefore, a rise above the +100 indicator means that the uptrend to break the high is likely.
Therefore, in order to show a full-fledged uptrend from the current price position, it must rise above 38K.
The high point has been holding for a long time now.
However, the low point has not yet formed a clear point due to the change of the -100 indicator.
However, as the -100 point is moved near the current price range, the possibility of forming a low is very high.
This shows that we are facing a new trend.
Keeping the price above 17941.69 is most important from a short-term perspective to create this new trend.
The next most important thing is to keep the price above 20552.75.
Then, it completes the appearance of a trough (a phenomenon in which the price drops more before making a bigger rise) before showing an uptrend.
The StochRSI indicator is showing a fairly rapid decline.
We will verify what we said above by looking at where the Stoch RSI indicator finds support and resistance when it turns upside down.
This change in support and resistance points can tell you which direction the movement of the current chart is about to head.
You may think my explanation is inconclusive, but the conclusion has already been drawn.
We live in a flood of information.
It is quite difficult to infer an objective conclusion by synthesizing such a large amount of information.
Therefore, it is necessary to objectify all information using objectified tools and indicators.
Many celebrities' chart analysis methods and trading methods are introduced on the Internet or in books.
In order to make the contents of these people my own, it can only be acquired through numerous transactions and numerous experiences.
Over time, trends change and all patterns change and evolve.
In order to read the chart in line with these changes, I think it is better to use a simpler and faster way to analyze.
This is because you can keep up with the ever-changing trends.
It is more important to make your own mental state stable due to volatility by investing more time in the trading strategy than the time used for analysis.
What do you guys think?
-------------------------------------------------- -------------------------------------------
** All descriptions are for reference only and do not guarantee profit or loss in investment.
** If you share this chart, you can use the indicators normally.
** The MRHAB-T indicator includes indicators that indicate points of support and resistance.
** Check the formulas for the MS-Signal, HA-Low, and HA-High indicators at ().
** SR_R_C indicators are displayed as StochRSI (line), RSI (columns), and CCI (bgcolor).
** The CCI indicator is displayed in the overbought section (CCI > +100) and oversold section (CCI < -100).
(Short-term Stop Loss can be said to be a point where profit or loss can be preserved or additional entry can be made by split trading. This is a short-term investment perspective.)
---------------------------------

How to trade markets in both directions using true SMC conceptsHello Traders, in this post we aim to explain how we can trade the markets in both directions. Since this comes under the concept of liquidity, it is very logical to trade in both the directions of the market. Please pay attention to the annotations made on the chart.
Happy Trading
Team Lamda

How to Choose the Right Indicator?Many traders, especially when starting out find themselves in a constant search of the best trading strategy.
A quick Google search is enough to scare anyone starting out, as the number of indicators and strategies to use under different market conditions is overwhelming.
🗒In this article, we will discuss *1* indicators nature and the correct way to use it, *2* how to choose the right indicator, and most importantly *3* how to know if the indicator is reliable or not.
---------------------------------------------------------------------------------------------------------------------
📌 First, what are indicators? Origin and Nature
Indicators are statistical tools that digest price data, OHLC of each candle, add a formula to it, and then convert it into visual information such as graphs or oscillators. Indicators provide information about the strength of a trend, momentum, and possible reversals.
When it comes to indicators, we can divide them into four classes: Momentum indicators, Trend indicators, Volatility indicators, Volume Indicators.
Knowing which one belongs to which category can help you make much better trading decisions. On the other hand, combining indicators in a wrong way can lead to a lot of confusion, wrong price interpretation, and, subsequently, to wrong trading decisions.
📌 The correct way to use indicators. Indicators don’t provide signals.
Most traders never look at the indicators they are using and even less have ever tried to understand the formula the indicator uses to analyze price. They then use their indicators in the wrong context and wonder why nothing works.
🗒Indicators don’t tell you when to buy or when to sell. They don’t even tell you when something is overbought or oversold.
Indicators are great tools if a trader understands their true purpose. Indicators provide information about price, how the price has moved, how candles have shaped, and how recent price action compares to historical price action. Again, not a direct signal to buy or sell.
Thus, the job of a trader is to interpret the information on their indicators in a meaningful way and turn it into a story about price action and buying/selling pressure.
Who is in control right now? Is the market ranging or trending? Is price losing strength or gaining momentum?
📌 How to choose the right indicator? That suits your trading style and personality
-----------------------------------------------------------------------------
📕 * Meaningful: Represents important information.
-----------------------------------------------------------------------------
Your indicator choice should match your trading style. The purpose of indicators/strategies is to offer a way to identify clues and to provide a framework for traders to work in. Our main job, as traders, is to collect clues and combine them in a meaningful way to have an edge over the market.
🗒 Only add indicators that help you put the odds in your favor. -- If it doesn’t, you don’t need it.
-----------------------------------------------------------------------------------------------------------
📕 * Objective: Has a clear operational definition of what is being measured.
-----------------------------------------------------------------------------------------------------------
Indicators are ideal for rule-based trading as indicators take out the guesswork by providing information that is totally objective especially for newbies who are struggling with discipline.
The most successful strategies/indicators are those where not a lot of individual interpretation is required.
🗒 Only use indicators that help you make objective decisions. -- If it doesn’t, you don’t need it.
-----------------------------------------------------------------------------------
📕 * Understandable: Easy to comprehend and interpret.
-----------------------------------------------------------------------------------
Indicators are great tools especially for amateurs who do not know how to relate price data into meaningful relationships.
Indicators' main purpose is to make your life easier, not more sophisticated.
🗒 Remember: K.I.S.S. Keep it simple stupid! -- If it is complicated, you don’t need it.
📕 Last but not least, less is more:
The problem with indicator redundancy is that when a trader picks multiple indicators that show the same information, he/she ends up giving too much weight to the information provided by the indicators.
🗒 “All Strategies / Indicators are good; if managed properly.”
~ Richard Nasr
---------------------------------------------------------------------------------------------------------------------
📌 How to know if the indicator is reliable? Cheat Sheet Checklist
📕 * Does it repaint, disappear or recalculate?
We have all been there. An indicator looking good /profitable on the chart, but perform horribly under live market conditions. Most indicators are designed to only show/keep winning signals. Do not, ever, include an indicator in your trading plan before testing it on a demo account.
🗒 Here is a simple step by step guide on how to test indicators:
- Attach your indicator to any chart.
- Keep your trading platform running for a while for the indicator to plot a couple of signals.
- Take a screenshot of the chart.
- Refresh by switching between the timeframes.
- Compare your chart with the screenshot
If the indicator’s signals /drawings change location or disappear, then it is a red flag. Such indicators are not reliable and shouldn’t be used in any way.
📕 * Does it lag?
In general, indicators are lagging, but so is price action. An indicator can only analyze what has happened already. Just as a candlestick or chart pattern only includes past price data.
Nothing to worry about so far, as we mentioned above, indicators only provide information and do not offer signals.
However, some indicators are too lagging. This kind of indicators looks good on historical data but appear too late under live market conditions.
🗒 Pro Tip: Always take into consideration when, where, and how does the signal appear.
📕 * Is it TradingView friendly?
90% of custom indicators do not work on TradingView, because PineScript does not allow recalculation. Thus, the signal/drawing can’t be modified once it is generated by the indicator.
Therefore, indicators that are available on TradingView stand out from the crowd, and they are considered more reliable.
---------------------------------------------------------------------------------------------------------------------
📌 In brief, indicators are very famous tools and used by millions of traders. However, often traders don’t really know what their indicators are doing or how to use them.
Always be aware of the objectives of your trading style and what you are trying to accomplish with the indicators. Then, adjust accordingly. Once a trader can stop using indicators as signal-tools, he will be able to transform his trading to new heights.
Happy trading!
Always follow your trading plan regarding entry, risk management, and trade management.
~Rich

🔳TOP 7 INDICATORS TO USE🔳
◻️MACD(Moving Average Convergence/Divergence)
Traders use MACD to identify changes in the direction or strength of the asset’s price trend. MACD can seem complicated at first glance, because it relies on additional statistical concepts such as the exponential moving average (EMA). But fundamentally, MACD helps traders detect when the recent momentum in an asset’s price may signal a change in its underlying trend. This can help traders decide when to enter, add to, or exit a position.MACD is a lagging indicator. After all, all the data used in MACD is based on the historical price action of the asset. Because it is based on historical data, it must necessarily lag the price. However, some traders use MACD histograms to predict when a change in trend will occur.
◻️VWAP(Volume-Weighted Average Price)
The volume-weighted average price (VWAP) is a measurement that shows the average price of a security, adjusted for its volume. It is calculated during a specific trading session by taking the total dollar value of trading in the security and dividing it by the volume of trades. The formula for calculating VWAP is cumulative typical price x volume divided by cumulative volume. VWAP gives traders a smoothed-out indication of a security’s price (adjusted for volume) over time. It is used by institutional traders to ensure that their trades do not move the price of the security they are trying to buy or sell too extremely.
◻️EMA(Exponential Moving Average)
An exponential moving average (EMA) is a type of moving average (MA) that places a greater weight and significance on the most recent data points. The exponential moving average is also referred to as the exponentially weighted moving average. An exponentially weighted moving average reacts more significantly to recent price changes than a simple moving average simple moving average (SMA), which applies an equal weight to all observations in the period.
◻️THE FOUR TYPES OF EMA:
▪️9-EMA is use for short term trading
▪️21-EMA is used for day trading
▪️50-EMA is used for analysis
▪️200-EMA is used for long term view
◻️RSI(Relative Strength Index)
The relative strength index (RSI) is a momentum indicator used in technical analysis. RSI measures the speed and magnitude of a security's recent price changes to evaluate overvalued or undervalued conditions in the price of that security. The RSI is displayed as an oscillator (a line graph) on a scale of zero to 100.Generally, when the RSI indicator crosses 30 on the RSI chart, it is a bullish sign and when it crosses 70, it is a bearish sign. Put another way, one can interpret that RSI values of 70 or above indicate that a security is becoming overbought or overvalued. It may be primed for a trend reversal or corrective price pullback. An RSI reading of 30 or below indicates an oversold or undervalued condition. Overbought refers to a security that trades at a price level above its true (or intrinsic) value. That means that it's priced above where it should be, according to practitioners of either technical analysis or fundamental analysis. Traders who see indications that a security is overbought may expect a price correction or trend reversal. Therefore, they may sell the security.
Thanks for reading bro, you are the best☺️
✅Gimme a like and the Gods of Trading will favour you this week👍
Dear followers, let me know, what topic interests you for new educational posts?

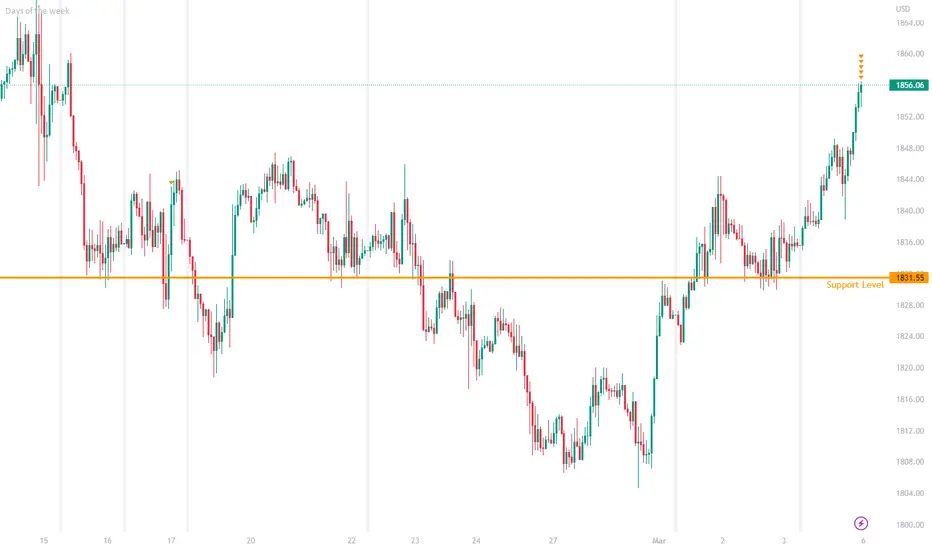
How Bollinger Bands work and their best parametersJust a reminder...
A Bollinger Band resembles a moving cylinder with three lines.
A top, middle and bottom line.
These three lines are plotted on any chart and you’ll see the price of the markets moving in-between these levels.
When the price crossed above the middle line, the trend is up.
When price moves and stays below the middle line, the trend is down.
There are three parts to the Bollinger Bands. Upper, Middle and Lower Bollinger Band.
Here are my parameters…
The length (20) , shows you the Moving Average of the Middle Bollinger Band. Which in this case is 20 MA and is shown in the chart as the orange line…
The Source tells us we are using closing prices in the chart…
That means, when the JSE All Share Index closes for the day – that is the closing price that will be used for the BB.
StdDev is 2… Bollinger Bands are envelopes that base a Standard Deviation above and below a simple moving average of the price.
Because the distance of the bands is based on standard deviation, that’s why we are able to see a symmetrical envelope around the price…
Most Bollinger Bands parameters are set to 20MA and 2 Standard Deviations on most charting platforms.
But now you know what to set it to, to maximise your usage...
If you have any questions about indicators feel free to ask. I've been in the markets since 2003 and enjoy sharing information...
Trade well, live free.
Timon
MATI Trader

Markets Using the Insync IndicatorInsync Trading: Analysis of the Markets Using the Insync Indicator
Insync Trading is a system that uses the Insync Indicator to help traders analyze the markets. The Insync Indicator is designed to help traders keep track of price trends and volatility. The indicator can be used to help traders make informed trading decisions.
image.png
What is the Insync Trading indicator and how does it work?
The Insync Trading indicator is a technical analysis tool that is used to identify potential buying and selling opportunities in the market. It is based on the idea that price and volume are interconnected, and that when there is a large volume of trade at a certain price level, it is likely that the market has reached a point of equilibrium. The Insync Trading indicator can be used to identify these equilibrium points, and to generate trading signals accordingly.
How can the Insync Trading indicator be used to analyze the markets?
The Insync Trading indicator can be used to analyze the markets in a few different ways. Firstly, it can be used to identify when the market is in a trend. Secondly, it can be used to identify when the market is in a consolidation phase. Finally, it can be used to identify when the market is in a ranging phase.
What are the benefits of using the Insync Trading indicator for trading?
The Insync Trading indicator is designed to help traders make better trading decisions. It does this by providing information about the current market conditions, and by indicating when a trade is likely to be profitable.
The Insync Trading indicator has a number of benefits:
It is easy to use. The indicator is simple to understand and easy to apply t0 your trading strategy.
It is accurate. The indicator has been tested and proven to be accurate.
It is reliable. The indicator is reliable and consistent, giving you accurate information every time you use it.
It is updated regularly. The indicator is updated regularly, ensuring that you have access to the latest information about the market.
It is affordable. The Insync Trading indicator is affordable, and it is a valuable tool for traders of all levels of experience.
It is flexible. The indicator can be used for a variety of trading strategies, giving you the flexibility to adapt it to your own trading style.
It is the best indicator for trading. The Insync Trading indicator is the best indicator for trading, and it can help you to make more profitable trades.
The Insync Trading system is a great way to keep track of price trends and volatility. The Insync Indicator is designed to help traders make informed trading decisions.

👑 THE UNCROWNED BEST INDICATORS PT.1That's the Part.1 of my collection of Uncrowned best indicators for trading.
I choose to call this post " uncrowned " because these indicators are firstly free resources and second well utilized and combined are much better than most of the paid indicators.
Often the best indicators are forgotten just because seem too basic or have no marketing behind them.
I can assure you, the top perform algorithm traders at least use for sure one of these 5 indicators. ( or more.. )
Making a great algorithm requires time to find the right combination of indicators and patience in backtesting.
If you don't know some of these indicators, I suggest you have a look, you can find them for free here in Tradingview.
N.1 AROON
The Aroon indicator is a technical indicator that is used to identify trend changes in the price of an asset, as well as the strength of that trend. In essence, the indicator measures the time between highs and the time between lows over a time period. The idea is that strong uptrends will regularly see new highs, and strong downtrends will regularly see new lows. The indicator signals when this is happening, and when it isn't.
The indicator consists of the "Aroon up" line, which measures the strength of the uptrend, and the "Aroon down" line, which measures the strength of the downtrend.
The Aroon indicator was developed by Tushar Chande in 1995.
Here is an Idea of how to use it, very basic. You can combine this indicator with your own favorite ones to create your best strategy.
Check the settings to find the right setup.
N.2 STOCH RSI
I personally love The Stochastic RSI. This indicator as the normal stochastic shows ranges between zero and 100 and is created by applying the Stochastic oscillator formula to a set of relative strength index (RSI) values rather than to standard price data. Using RSI values within the Stochastic formula gives traders an idea of whether the current RSI value is overbought or oversold.
The StochRSI oscillator was developed to take advantage of both momentum indicators in order to create a more sensitive indicator that is attuned to a specific security's historical performance rather than a generalized analysis of price change.
The StochRSI was developed by Tushar S. Chande and Stanley Kroll and detailed in their book "The New Technical Trader," first published in 1994. While technical indicators already existed to show overbought and oversold levels, the two developed StochRSI to improve sensitivity and generate a greater number of signals than traditional indicators could do.
The StochRSI deems something to be oversold when the value drops below 20, meaning the RSI value is trading at the lower end of its predefined range, and that the short-term direction of the underlying security may be nearing a low a possible move higher. Conversely, a reading above 80 suggests the RSI may be reaching extreme highs and could be used to signal a pullback in the underlying security.
Along with identifying overbought/oversold conditions, the StochRSI can be used to identify short-term trends by looking at it in the context of an oscillator with a centerline at 50. When the StochRSI is above 50, the security may be seen as trending higher, and vice versa when it's below 50.
The StochRSI should also be used in conjunction with other technical indicators or chart patterns to maximize effectiveness, especially given the high number of signals that it generates.
N.3 ATR Average True Range
I think the ATR is the base of any algorithm or at least every algorithm trader has at least one setup with this indicator to calculate the Stop loss or the Take profit or both together.
The average true range (ATR) is a technical analysis indicator, introduced by market technician J. Welles Wilder Jr. in his book New Concepts in Technical Trading Systems, that measures market volatility by decomposing the entire range of an asset price for that period.
The ATR may be used by market technicians to enter and exit trades and is a useful tool to add to a trading system. It was created to allow traders to more accurately measure the daily volatility of an asset by using simple calculations. The indicator does not indicate the price direction; rather it is used primarily to measure volatility caused by gaps and limit up or down moves. The ATR is fairly simple to calculate and only needs historical price data.
The ATR is commonly used as an exit method that can be applied no matter how the entry decision is made.
N.4 The Bullish and Bearish Engulfing
Well, this indicator, free by tradingview show exactly the presence of Bullish and Bearish reversal made from Engulfing pattern.
It can be a great confirmation indicator for your strategy if used together with other indicators inside your algorithm.
N.5 WAE - Waddah Attar Explosion
Last but not least, an incredible free indicator. Great for confirmation entry as well as Volume and trend direction.
Trading volume can help an investor identify the momentum of a currency pair and confirm a trend. If trading volume increases, prices generally move in the same direction and can provide a heads-up if volume diminishes. Once volume begins to diminish and the fuel for the trend starts to dry up, a reversal or ranging market may be on the horizon. This particular volume indicator has only three components to interpret, visually straightforward, easy to understand, and user-friendly.
I hope at least one of these Five uncrowned indicators will become part of your arsenal.
Please, support my work with likes and comments!

The Power of PRICE ACTIONHello traders and future traders!! I know there is a point in the trading journey where you have so much information that it gets confusing, and you try to apply everything that you have read, but price action strategies shows us how simple are the markets and how easily we can interpret one without using tons of indicators, but just the price movement. Here are the 3 main advantages when it comes to price action trading and the reasons why this type of analysis is so powerful in many trading strategies.
If you see any other advantages, but also disadvantages, leave a comment and let's discuss!

The BEST Trading IndicatorWith the ever increasing number of indicators, it makes sense that beginner traders’ wish to cut the steep learning curve by trying to find which indicator is the best and the most profitable to choose from.
It’s overwhelming to start trading with so many jargon terms like, the MACD, RSI, Stochastics, ADX, Bollinger Bands and so on…
Luckily, you won’t ever have to worry about any of these indicators.
Here’s why…
The quest to find the perfect trading indicator
There is a big misconception when it comes to learning how to trade.
Most new people start by going onto Google to search for the ‘best trading strategy’ or the ‘best trading indicator’ to speed up their success.
Everybody wants to find that perfect trading indicator that will help them profit 80% to 100% of the time.
Yet, at most, there are only 5% of traders’ out there who are able to make a consistent income with trading.
I have two main reasons on this matter, which I’ve gathered since 2003.
Reason 1:
All indicators are history
With local and international markets such as the stock market, Forex and even with crypto-currencies, there are billions of rands traded every day.
With the ongoing economic, socio and political events taking place, every transaction from either a company, private individual or even a bot is entirely unique and UNEXPECTED.
So which indicator is the best to choose from?
Well before you go and do research on each indicator there is to trade with, let me spare you the time and tell you this…
Every technical indicator and oscillator out there, is based on one thing.
HISTORICAL DATA.
When you add an indicator onto a chart, it can only show one of three things which are either the:
Current momentum.
Current trend direction or the.
Demand and supply based on buying and selling volume.
Not one indicator has any form of predictive qualities. Even with the dawn of Artificial Intelligence and Quantum Computing, there will most likely never be that one indicator that will be able to predict the future with accuracy and certainty every time.
However, let’s say there is that one Quantum Computer that is able to take every news event, internal and external factor into account. The information assembled and collected, will still be based on past data.
By now you may be feeling like your life has been a lie with all the marketing fluff out there with the 100% win-rate and get rich quick scams, but I assure you there is one legit way to succeed from trading.
Reason 2:
Each element is essential
It doesn’t take just one trading strategy to bank a consistent income.
It doesn’t take just a few rules to follow and,
It doesn’t take a whole lot of money to fund your account to make it as a trader.
No, in actual fact it takes four equally important elements namely:
MARKETS:
You need to find the best markets that are out there to trade and when to trade them.
METHOD:
You need to create or adopt a proven trading strategy that will fit your personality. (Price action with a few patterns is all that's needed to spot probability trades).
MONEY:
You need to have just a couple of money management rules, to follow every time you take a trade.
MIND:
You need to find a way to develop trading self-confidence as well as a strong mindset throughout your career.
This is where so many different trading companies, publications and even education institutions seem to miss the mark.
They either specialise ONLY in psychology, trading analysis or just on money management. Unfortunately, this is one hobby or lifestyle where being an expert in ONE field will not guarantee your success.
Why my indicators are open-source, and why yours should be tooThis post explains my mindset of why i publish only indicators and only under open-source.
A common opinion is that if an indicator or strategy is publicly known, then it cannot be profitable. In economics theory, this is known as the efficient market hypothesis(1), which states that once a strategy is widely adopted, it is integrated in prices and hence cannot be profitable anymore.
Hence, it is a legitimate question to ask: are any of the open-source indicators useful for professional trading?
I do not believe in magic bullet indicators, those that are claimed to indicate when to buy or when to sell. I don't think any indicator, or even any set of indicator, can reliably do that over the long term in any market without human intervention to decide at some point when the signals are true or false positives. Likewise, i do not believe automated strategies can reliably be profitable.
Hence, my focus is to design indicators that can help reveal hiddee structures or simply help in visualizing faster and more easily market's data. As profitable traders know, the raw price action still rules above all, with volume and order flow being the next best metrics, but we can design indicators to give us an edge in terms of time spent analyzing the market, and this is what all my work is focused on: to save me time and reduce interpretation errors. And maybe it can be useful to you too.
Indicators are merely a tool, and no two people will use them exactly the same. Just like giving a fishing rod doesn't make the recipient a fisher, i don't believe that just because indicators are free or open-source they lose their utility. The whole world is fishing, yet any competent fisher can still catch fishes, because they know where, when and how, it's not just because they have a fishing rod, and arguably, the fishing rod is only a necessary tool, but not the most important thing that makes them competent fishers: what makes them competent fishers are skills.
In summary, i am trying to help in understanding the market, not in predicting it. Assessing likelihoods and probabilities of future events and knowing what you can do are your job and depend on your skills solely. If you don't know how, there are free online tutorials(2) to get started, but nothing replaces experience acquired through hard work.
For example, one of my favorite ways to visualize is to encode sentiment related infos as a coloret bar at the bottom, or by highlighting the background. These representations may be simplistic, and that's the goal, anybody can understand them intuitively without even looking at the description, yet they can encode very complex and heterogenous information.
The human brain remains the best informational system when it comes to integrating huge volumes of heterogenous data, as the financial markets generate. So my indicators are meant to boost brains, not replace them. Even artificial intelligence bots have a hard time being profitable (i know, this is my original field of expertise, they require near constant monitoring to avoid potentially catastrophical errors and tweakings to adapt to the market). There is simply no shortcut to hard training when it comes to becoming a good, profitable trader.
Hence, even if my indicators are, I believe, vezy helpful to understand the market and can gice an edge, and ecen though I use several all the time, to be honest, you likely won't get any benefits if you don't know what you are doing, if you are inexperienced with trading.
The above explains why i think publicly available indicators can still be useful, but not why i publish under open-source, which is anither step beyond free but clised-source publication. Truth is, I am marvelled by the open-source spirit in the TradingView community, which is the biggest database of open-source financial indicators ever. As I strted above, these indicators are unlikely to be profitable on their own, but that's not the point: sharing indicators is sharing an idea, a concept, a blueprint, that can then be developed further, or be food for thoughts for a whole new indicator, or just broaden your horizons of how you view the markets.
Therefore, I decided to stay in this spirit and publish all my indicators under open-source. I am very grateful for the giants on which shoulders I stay, and I am eager to hear feedbacks on my work, so we all further our collective understanding of markets!
Enjoy, and be safe!
Tartigradia
(1) Timmermann, A., & Granger, C. W. (2004). Efficient market hypothesis and forecasting. International Journal of Forecasting, 20, 15-27.
(2) cobie.substack.com

HOW TO USE TECHNICAL INDICATORS TO MAKE PROFITS IN TRADING
Always combine technical analysis with fundamental analysis
Successful traders always combine the two types of analysis. This is because technical analysis tends to focus on the past events and fundamental analysis focuses on the present and future issues.
In addition, there are certain situations where technical analysis will not provide adequate solutions. For instance, technical indicators are not programmed to predict the outcome.
In such situations, it is important to rely on fundamental analysis and avoid the market because no one knows the exact number and how the market will react.
Understand the indicators
It is also important to understand the indicators to use. Different one have different ways of analysis.
It is important for you to take time to learn these indicators and how they should set up. There are many learning materials which one can use to learn how the indicators work.
I recommend that you take at least 2 months to learn the indicators using a demo account before using real money.
Use Few Indicators
As stated before, many traders make the sad mistake of using very many indicators at a go. Always remember that two is a company, three is a crowd.
Traders who use more than two indicators at a go make mistakes because of poor visibility and poor market data interpretation.
Therefore, I recommend that you use at most 2 indicators per trade.
Patience
In day trading, patience is an important aspect without which no trader can make it. In fact, some indicators are usually require more time before their predictions can come true.
Following these tips, your indicator-trading will go to the next level.
Do you agree with all these tips?
Hey traders, let me know what subject do you want to dive in in the next post?

TRADINGVIEW PINESCRIPT CODERS PRO+ USER NEEDS YOUR HELP ! traders i am looking for help creating a volume strength indicator i have created and back testing manually, everyone believes price is king but i believe price is just the amount of traders trading and how much volume dictates price action, indicators today are great and i do use them 2nd to price action and volume but believe volume is the true king so i created a idea using multi time frame top down method like dr. elders triple screen, im using (14) time frames and getting the most recent 5 bars volume and taking the average of the 5 bars and giving each time frame a vale 1-3% giving the lowest time frames the lowest number percent and the higher time frames the higher value percentage, then i add up each bull/bear volume and put it in a standard win rate calculator to get the winning volume percentage average, im now back testing manually every 1h if i were looking for trade set ups on the hourly tf and the 4h for day trades and intraday trades have written a pdf with all the details on how im back testing and what i want the indicator to signal for buys and sells based on the percentage of overall volume i have manually calculated using my values, please is anyone interested in building this pine script indicator i want to use on trading view as a paid subscription service once its been back tested and has a good win ratio/rate, anyone ,all trading view coders if u think u are interested in building and testing with myself please pm me, thank you.

How to select effective indicators for your strategyNot all indicators are useful: most are not, and some are downright misleading. Previous posts and studies, such as LuxAlgo's(1), determined that effective indicators need to: 1) produce data to support the trader's decision-making process, not substitute it with automated strategies, 2) produce non-redundant infos. But how do you select indicators in practice? Here, I share my own step-by-step process to select effective indicators for your strategy.
My approach is to use a two-stages process: 1) Expansion, 2) Contraction.
This is the same process that happens in our brains when they develop, first there is neuronal and synaptic expansion, creating lots of new connections that are not necessarily efficient, then there is contraction, which weeds out useless, redundant or ineffective connections. Here, the idea is similar.
## Expansion: try all the indicators you want ##
In the first stage, you just try any indicator that sounds like an interesting idea. The way you select the indicators is up to you, either it can be because it sounds like a good idea, or because it's in line with your main strategy (eg, a volatility indicator when your strategy is contrarian).
Whatever criteria you choose, you should:
1) Remain open to new types of indicators potentially outside your main field, as they can broaden your horizons,
2) Remain skeptic of any claims of effectiveness until you test the indicators and see tha they work for yourself (in the second stage: contraction),
3) Study the indicator to understand how it works and why it works. Don't just blindly use an indicator without knowing what it actually represents precisely, otherwise you will get bit by its limitations and false positives at some point in the future, likely when you will have a lot of money on the table to lose!
Once you have selected a set of indicators, or if you have reached the maximum number of indicators you can add in your TradingView plan (as it happens to me!), then you can go to the next step to weed indicators out.
## Contraction: drop everything that isn't directly useful to you##
In the second stage, we will extensively test the indicators for ourselves, on the assets we are interested in, and in others as well, to "field test" them and see if they work in our strategy. Indeed, trading and investment rely on a balance between collecting enough infos and keeping it simple enough (KISS principle(2)) to support our systematic decision-making process, without information overload which can produce decision paralysis.
The contraction/filtering process is more involved than the first stage, because you have to do the manual, dirty work of testing, it takes time, but this is the only way you can see whether the indicator work as intended and that they work for you. No two people will use the same indicator the same way as I explain in another post (3), so bear in mind that some indicators that may not work for someone else may work for you, and inversely an indicator that works for someone else's strategy may not for you, so the popularity of an indicator is no indication of effectiveness.
Here is a step-by-step outline of my process, feel free to add more steps depending on your needs:
1) Signal-to-Noise test: test on weekly and daily. If the indicator can't be reliable, can't produce good signals with low false positives and high true positives on these long timeframes that are much less noisy than shorter timeframes, then they are useless. Some people claim that there are indicators that work exclusively on lower timeframes, I am not trading such smaller timeframes although I can trade down to 15min, so your mileage may vary, but I remain yet to be convinced that this is true.
2) Redundancy test. If you already found a good indicator that works reasonably well for you, then compare any new indicator to this "best" indicator as a benchmark reference point. This will allow to weed out indicators that cannot provide new, non-redundant data. For example, in the chart of this post, I study correlations, which I compare against the signals generated by my RSI+ (alt) indicator which I consider one of my most reliable. Of course, the signal is of a different kind, but it still provides me a reference point as to whether the correlations can provide me with an additional edge or whether I should just stick to using only the RSI+ indicator. In practice, if the new indicator(s) can provide new, non redundant data, as shown by slightly different predictions in different scenarios or maybe a bit earlier, then great, I keep them. If not, for example the indicator does provide reliable info but it would lead me to take the same decisions at the same time, or worse, later than my best indicator, then I remove it.
3) Generalizabiliy test. Test on multiple markets, on mutiple timeframes, to check generalizability: if it doesn't generalize, the model is overfit on one target market's history, and this likely won't even work for the future if this same market, ie, this is an issue often encountered for models made specifically for bitcoin or ethereum.
4) Misleading test. Use bar replay, to check how the indicator behaves in realtime: does it sprout a lot of false positive in realtime, or is it as useful and predictive, or better, in real-time than when used for historical bars? Or worst being repainting indicators rewriting the past, such as pivots or zigzag, they look super accurate aposteriori but it's only because they cheat (see tradingview pinescript fage about that), using bar replay will help you detect them 100% of the time. Bar replay is one of the best tools you have to test indicators, don't underestimate it. Yes, it's time consuming, but it's well worth it, and you'll become quicker and quicker to use it over time with experience. For more information about the different types of repainting indicators, there is an excellent article in the PineScript documentation, it's worth reading even for non-coders(4).
5) Grouping and intra-class comparison. Finally, group indicators on the same study, so you can quickly answer a question eg about volume and volatility, or about market cycles, etc by checking the adequate chart. Otherwise, if you mix indicators between different charts, it will take you longer to analyze and compare the various signals. Also this allows to compare similar indicators between them to see if they really are useful, non-redundant. For example, in the chart above, it's a Correlations grouped study, so I added almost exclusively correlations indicators; while the delta-agnostic and (pearson) correlation coefficient both provide non-redundant infos, Spearman correlation and Kendall correlation indicators are redundant, although they shouldn't (they should capture non-linear relationships, whereas Pearson can only capture linear ones), their results aren't any different in practice with the pearson correlation coefficient in terms of significant signals they generate that would change my decision process, so we could drop two out of these three correlation coefficients, which would unclutter our chart without losing any data.
## Wrapping-up: continually refine your indicators ##
At the end of the day, it's important to continually try to adapt to the markets. Indicators can continue working, while others may fail, or in the end you find them too difficult to use in practice with your strategy. Your strategy may also evolve over time, and so your indicators should too. Don't ever feel attached to your indicators, you can revisit and question their utility at anytime, and you can go through the steps above again, and drop any indicator at anytime, even if they were useful before, what matters is whether they are still useful now.
There is also a next step for those who are open to learn programming: creating your own indicators. Not so much to create unique opportunities, although they might, but to better understand the market. You should view indicators as a way to better understand some facet of the market, indicators answer the specific questions their authors wanted to find an answer for. So by using indicators of other authors, you are reading the solutions to others questions. But you can also form your own questions, and then the next logical step is to develop your own indicators to find your own answers. And hopefully share them under open-source, so that we can all learn together (and this likely won't impact your profitability, to the contrary, as I explain elsewhere!(3)).
In summary, we can quote Bruce Lee, who described a very similar process for his mastery of martial arts as he taught his own named Jeet Kune Do:
"Absorb what is useful, reject what is useless, add what is essentially your own."
I hope this post was useful to you, and if you have an idea of a criterion or a step you use to select indicators that I didn't list above, please share it in the comments!
Enjoy, Trade Safely!
Tartigradia
(1): Technical indicators: what is useful and what isn't , by LuxAlgo
(2): en.wikipedia.org
(3): Why my indicators are open-source, and why yours should be too , by Tartigradia
(4): Repainting — Pine Script™ v5 User Manual v5 documentation
