Bank of Japan Losing Credibility. USDJPY eyes breakout. Continued or large scale QE, capped yields and reluctance to normalise (or being forced back in to easing during a downturn) would anchor Japanese yields far below peers encouraging capital outflows and undermining confidence in the currency.
A shrinking and ageing population chronic fiscal deficits very high public debt and history of trade deficits in recent years represent structural headwinds that can justify a weaker Yen if investors start to question long-run debt sustainability.
With a wide and persistent rate gap, leveraged global players can keep borrowing Yen to buy higher yield assets abroad.
If markets begin to doubt the BOJ's ability to manage the government bond market without either monetisation or financial repression, investors may demand a steep currency discount rather than high nominal yields, instead of typical "higher rates, Stronger FX" reaction.
Global risk: If the dollar regains or maintains "only game in town" safe-haven status in a world of repeated shocks - while the Yen loses it's traditional safe haven status because of Japan's Macro position - USDJPY can behave more like a one way-risk trade than a mean reverting pair.
Inverse Head and Shoulders

Bulls Still in Control?Hello traders! Here’s an idea for AUDCAD based on current structure, trend, and momentum.
(This is market analysis, not financial advice. Always use proper risk management and seek additional confirmations before entering a trade.)
Intraday Buy Idea (short term move)
• Entry: 0.91500 – 0.91600
• Stop-Loss: 0.91350 – 0.91300
• Target Area: 0.91800 – 0.92000
⸻
Market Analysis
AUD/CAD continues to trade within a relatively modest daily range—typical for this pair—especially as we approach the end of Q4 and move deeper into the holiday season, when liquidity thins and price action often becomes more choppy and range-bound.
On the 4-hour chart, an inverted head-and-shoulders pattern has formed. The market recently closed above the neckline/right-shoulder zone, confirming potential bullish structure. A clean retest of this zone (around 0.91500-0.91600) could provide an opportunity to catch the continuation of the bullish momentum that began late last week (around Nov 21).
Our target—0.92000—lines up closely with November’s high and a key structural resistance level. If momentum remains intact, price could attempt another test of this area.
⸻
Fundamentals (per economic sources)
Australia (AUD)
• The RBA has kept rates steady, maintaining stability in the AUD.
• Commodity prices trending higher (especially metals) provide underlying support for the Australian dollar.
• A potential shift toward U.S. Federal Reserve rate cuts later on can indirectly support AUD through broader USD softness and risk-on flows. (per economic sources)
Canada (CAD)
• Canada’s manufacturing sector continues to contract, signaling broader weakness.
• While recent GDP growth was positive, the expansion was driven mainly by oil exports and government spending, not broad economic strength.
• Mixed and uneven economic performance may limit near-term CAD strength.
Combined, these factors support a slightly bullish bias for AUD/CAD in the near term, aligning with this technical setup.

USB | This Regional Bank May POP Higher ! | LONGU.S. Bancorp operates as a bank holding company, which offers financial services including lending and depository services, cash management, foreign exchange and trust and investment management. The firm also offers mortgage, refinance, auto, boat and RV loans, credit lines, credit card services, merchant, bank, checking and savings accounts, debit cards, online and mobile banking, ATM processing, mortgage banking, insurance, brokerage and leasing services. The company was founded on April 2, 1929, and is headquartered in Minneapolis, MN.

DVN | Strong Oil & Nat Gas Producer About to Pop | LONGDevon Energy Corp. engages in the exploration, development, and production of oil and natural gas properties. It develops and operates Delaware Basin, Eagle Ford, Heavy Oil, Barnett Shale, STACK, and Rockies Oil. The company was founded by J. Larry Nichols and John W. Nichols in 1971 and is headquartered in Oklahoma City, OK.

PEP | Bullish Move Incoming for Pepsico| LONGPepsiCo, Inc. engages in the manufacture, marketing, distribution, and sale of beverages, food, and snacks. It operates through the following business segments: Frito-Lay North America (FLNA), Quaker Foods North America (QFNA), PepsiCo Beverages North America (PBNA), Latin America (LatAm), Europe, Africa, Middle East, and South Asia (AMESA), and Asia Pacific, Australia and New Zealand, and China Region (APAC). The FLNA segment consists of branded convenient food businesses in the United States and Canada. The QFNA segment includes cereals, rice, and pasta under the Quaker, Pearl Milling Company, Quaker Chewy, Cap'n Crunch, Life, and Rice-A-Roni brands. The PBNA segment is composed of beverage concentrates, fountain syrups, and finished goods under various beverage brands such as Pepsi, Gatorade, Mountain Dew, Diet Pepsi, Aquafina, Diet Mountain Dew, Sierra Mist, and Mug. The LatAm segment covers beverage, food, and snack businesses in the Latin American region. The Europe segment offers beverage, food, and snack goods in Europe and Sub-Saharan Africa regions. The AMESA segment deals with all beverage and convenient food businesses in Africa, the Middle East, and South Asia. The APAC segment refers to all business operations in the Asia Pacific, Australia and New Zealand, and China region. The company was founded by Donald M. Kendall, Sr. and Herman W. Lay in 1965 and is headquartered in Purchase, NY.

ZM | Price Will ZOOM Higher | LONGZoom Communications, Inc. engages in the provision of a communications and collaboration platform. It operates through the following geographical segments: Americas, Asia Pacific, and Europe, Middle East, and Africa. The company was founded by Eric S. Yuan in 2011 and is headquartered in San Jose, CA.

FTSE100 post-Budget rally: Inverse Head & Shoulders eyes 9800Chancellor Reeves unveiled tax rises worth £26 billion annually by 2029-30 but showed fiscal discipline by committing to reduce government spending as a share of GDP each year and more than doubling the fiscal headroom buffer to £21.7 billion, reassuring bond markets still scarred by the Liz Truss mini-budget crisis.
With gilt yields falling, sterling at its best level since October, and a Bank of England rate cut expected in December, the macro backdrop supports further upside for Footsie, though sticky inflation and OBR growth downgrades remain headwinds.
Key drivers:
UK Budget introduces tax rises totalling £26bn annually by 2029-30 via threshold freezes, mansion tax, and dividend levies, but spending will decline as a share of GDP each year, calming government borrowing concerns and sending gilt yields lower.
Fiscal headroom buffer more than doubled to £21.7bn (from £9.9bn last year), giving bond vigilantes confidence that the debt trajectory is sustainable.
Sterling rallied above 1.32 towards 1.33 on lower borrowing risks, while FTSE 100 gained, led by financials.
Bank of England expected to cut rates 25bp in December, supporting equities, though sticky inflation and OBR growth downgrades are headwinds.
Technical setup : inverse head and shoulders with neckline/support at 9,630 (38.2% Fib), measured move and Fib confluence target 9,800 (between 61.8% and 78.6% retracement).
Trade idea : Entry on pullback to 38.2% Fib (9,630), stop below previous low (9,434), target 9,800, for 2:1+ risk-to-reward.
Trading the FTSE bounce? Drop your setups in the comments and follow for more high-action technical and macro trade ideas.
This content is not directed to residents of the EU or UK. Any opinions, news, research, analyses, prices or other information contained on this website is provided as general market commentary and does not constitute investment advice. ThinkMarkets will not accept liability for any loss or damage including, without limitation, to any loss of profit which may arise directly or indirectly from use of or reliance on such information.

"Heads Down" With Hopes Up For EUFX:EURUSD seems to have found Support at a Weekly Low formed earlier this month.
Now, since having visited this Support, you can notice that price has begun to form a Higher Low suggesting that price action is forming a strong bullish reversal pattern, the Inverse Head and Shoulders!
If price can continue pushing higher to the Neckline once more, this will complete the reversal pattern.
Once the pattern is complete, we will want to wait for a Breakout and Retest to generate potential long opportunities to take the price up to test the overhead resistance levels.

WYNN | This Casino Will Make Money As Gambling Rises | LONGWynn Resorts Ltd. is a holding company, which Wynn Resorts Ltd. is a holding company, which engages in the design, development, and operation of destination casino resorts. It operates through the following segments: Wynn Palace, Wynn Macau, Las Vegas Operations, Encore Boston Harbor, and Corporate and Other. The company was founded by Stephen Alan Wynn, Elaine P. Wynn, and Kazuo Okada in 2002 and is headquartered in Las Vegas, NV.engages in the design, development, and operation of destination casino resorts. It operates through the following segments: Wynn Palace, Wynn Macau, Las Vegas Operations, Encore Boston Harbor, and Corporate and Other. The company was founded by Stephen Alan Wynn, Elaine P. Wynn, and Kazuo Okada in 2002 and is headquartered in Las Vegas, NV.

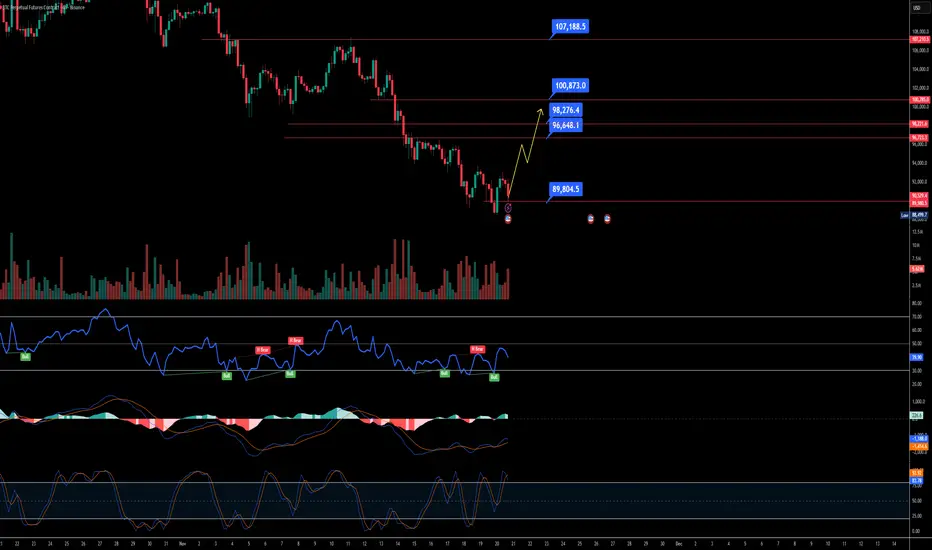
$BTC 4H Analysis – Clear Bullish Structure FormingRight now on the 4-hour chart, BTC is clearly building a strong bullish pattern.
🔹 Price action is forming a clean Inverse Head & Shoulders structure.
🔹 RSI is showing a bullish divergence, meaning momentum is strengthening while price is stabilising.
🔹 This setup usually indicates a breakout move once the neckline is breached.
If BTC starts rising from the current zone, the market is likely to grab liquidity near the $97,000 level, which is the next major area where stop-loss clusters and pending orders are sitting.
In simple terms:
BTC looks ready for a bullish expansion — liquidity target: ~$97,000.
USDCAD: Patient Fed & oil drop support iH&S projection to 1.4370USDCAD is building an interesting medium-term setup as crude oil weakness combines with Fed patience and supports dollar strength against the loonie, with an inverse head-and-shoulders pattern pointing to a measured-move target near 1.4370.
Crude oil recently broke below $60, directly pressuring the Canadian dollar since Canada is a major commodity exporter. Meanwhile, the Fed's cautious stance on rate cuts, despite labour market softness ahead of a potential partial NFP on Friday, keeps the buck bid as investors hold dollars for yield.
The technical structure confirms what the macro backdrop suggests: USDCAD has room to run higher from current levels.
Key drivers
Oil breakdown hurts CAD: crude slipped below $60 recently, and every time oil weakens, the commodity-linked loonie follows. This correlation has been tracking cleanly since July, when USDCAD turned higher alongside the energy sell-off.
Fed patience supports USD: Despite labour-market weakness signals from existing data releases, the Fed isn't rushing to cut in December, and a patient central bank typically supports the dollar because investors can hold dollars and earn decent carry while awaiting clarity on policy.
Inverse H&S pattern: The technical setup shows a head near 1.3537, a neckline breakout near 1.3900, and a clean retest at 1.3985 (former 2022 resistance turned support). The measured move from head to neckline brings 1.4370 into play, with intermediate targets at swing levels.
RSI reset above 50: After showing flat divergence at the recent highs, the RSI has reset by bouncing cleanly off the 50 line on the daily chart, suggesting momentum has room for another leg higher before any overbought concern.
Use 1.3985 as your line in the sand, consider longs above this level with the first target at the peak of 1.4145 (validation of the breakout), the second at 1.4250, and trail stops toward 1.4370 if momentum holds. Watch for oil to remain below $60 and Fed messaging to stay cautious, as a daily close below 1.3985 would shift the bias to consolidation, while full pattern invalidation sits at 1.3720.
This content is not directed to residents of the EU or UK. Any opinions, news, research, analyses, prices or other information contained on this website is provided as general market commentary and does not constitute investment advice. ThinkMarkets will not accept liability for any loss or damage including, without limitation, to any loss of profit which may arise directly or indirectly from use of or reliance on such information.

MDT | Monster Rally Incoming!!! | LONGMedtronic Plc is a medical technology company, which engages in the development, manufacture, distribution, and sale of device-based medical therapies and services. It operates through the following segments: Cardiovascular Porrtfolio, Neuroscience Portfolio, Medical Surgical Portfolio, and Diabetes Operating Unit. The Cardiovascular Portfolio segment includes products for the diagnosis, treatment, and management of cardiac rhythm disorders and cardiovascular disease. The Neuroscience Portfolio is made up of cranial and spinal technologies, specialty therapies, and neuromodulation divisions. The Medical Surgical Portfolio is comprised of surgical innovations and respiratory, gastrointestinal, and renal divisions. The Diabetes Group segment offers insulin pumps, continuous glucose monitoring systems, and insulin pump consumables. The company was founded in 1949 and is headquartered in Dublin, Ireland.

TKC – Multi-Year Inverse Head & Shoulders Formation PotentialA potential multi-year inverse Head & Shoulders structure appears to be developing on Turkcell’s U.S. ADR (TKC) monthly chart.
This is a slow-forming, long-cycle reversal pattern, so completion may take time even few years — also future dividend adjustments will naturally shift the historical price anchors on the ADR chart.
The neckline sits around the 8.00 USD area.
A monthly close above 8.00 would be the structural trigger confirming the reversal.
The measured move from head to neckline projects toward the 13.70 USD area.
This level also aligns with a major Fib confluence zone:
• 61.8% retracement of the 2007 high → 2022 low
• 78.6% retracement — both cluster between ~13–14 USD, reinforcing the significance of that target zone.
Invalidation sits below 4.22 USD.
A sustained move under this level would break the right-shoulder structure and negate the multi-year reversal thesis.
This setup is worth monitoring — high-timeframe reversals can be slow to complete, but meaningful when they do.
Macro note : This stock sensitive to Türkiye’s economical outlook.
Focus on the chart, not the headlines.
(Educational idea – not financial advice.)

$TZA: BULLISH PATTERNS AMEX:TZA : This chart is quite interesting.
Starting point: The MACD indicates a buy signal, and the 14-period RSI is at 60 (though not shown). Therefore, everything considered, the trend appears to be bullish.
I can identify two possible patterns:
1) Since the low on October 27, AMEX:TZA is unfolding a Zigzag (ABC) pattern. The 1x1 extension for the wave (C) at 9.22. Additionally, a double bottom pattern is present with a target of 9.45.
2) AMEX:TZA has formed an inverse head and shoulders (IHS) pattern with a target at 10.52. It’s worth noting that the right shoulder may be somewhat indistinct.
In any case, we will see how the price develops.

CADJPY carry trade gains traction with iH&S, targets 118+The CADJPY carry trade is in focus as the yen stays weak and risk appetite lifts CAD toward a bigger breakout from an inverse head-and-shoulders base.
Japan’s new PM, Takaichi, leans pro‑stimulus, while the BOJ signals no December hike, leaving JPY structurally soft. At the same time, Canada benefits from improved risk tone and a stable BOC policy, which supports CAD strength.
Key drivers
Structural JPY weakness: A stimulus-first stance and low-rate BOJ keep carry demand elevated, but intervention talk remains a headline risk.
CAD tailwinds: US reopening-driven risk-on, oil support, and BOC on hold underpin the loonie.
Technicals: An inverse H&S with a neckline projection toward 116–117, with a recent retest near 108–109 holding the line and RSI having room to push higher.
Levels: supports at 110.00, then 109.50/108.30, and resistances at 111.50, 112.20, and 115.10, with the measured move pointing toward 116.5–118 from the neckline break.
Bias stays long above 110. Buy dips, invalidate below 108, and scale targets at 111.50, 112.20, and 115.10, leaving a runner at 116.5–118 if the first neckline peak holds.
This content is not directed to residents of the EU or UK. Any opinions, news, research, analyses, prices or other information contained on this website is provided as general market commentary and does not constitute investment advice. ThinkMarkets will not accept liability for any loss or damage including, without limitation, to any loss of profit which may arise directly or indirectly from use of or reliance on such information.

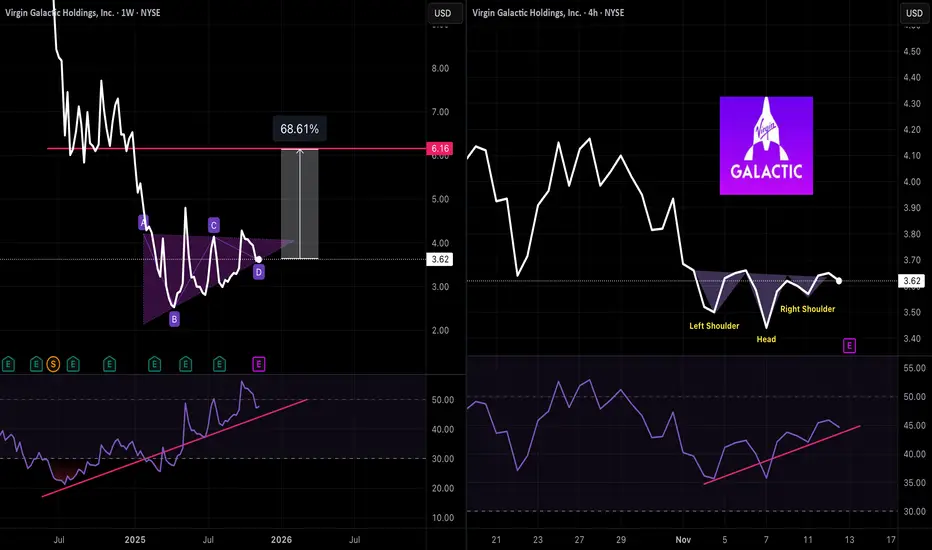
Is Virgin Galactic ready for liftoff?Virgin Galactic NYSE:SPCE has been building an ascending triangle on the weekly chart with a huge gap to fill if it can break to the upside.
Zooming in on a short term 4H chart we see an inverted head & shoulders with improving momentum.
Could one more earnings beat be the catalyst to start the engines and send this spaceship back up to the mesosphere?!
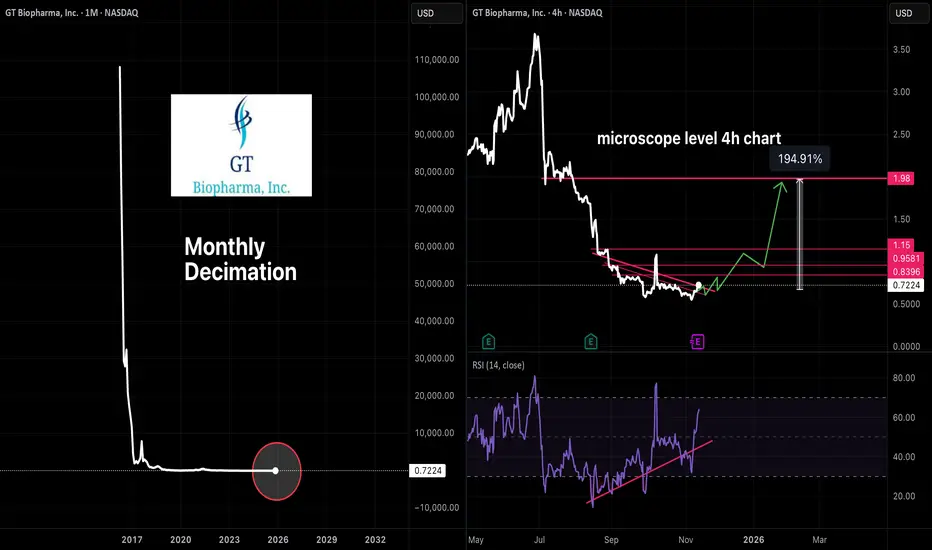
GTBP primed for a moonshot?Is NASDAQ:GTBP primed for a parabolic pump?
The monthly chart is disastrous, but if you drill all the way down to the 4H chart, it looks to be coiling up.
There are plenty of red flags with this name. Hemorrhaging funds and a lack of options are both warning signs. Technicals suggest there could be some type of turnaround brewing.
If you've got money you could comfortably part with, maybe pick up a few shares on a long shot.
BITCOIN Weekly line charttells a story of 4 discernible patterns and 4 log targets.
1) The inverse head & shoulders to end the bear market
2) A broadening rising flag .... which at the time, many thought it was head and shoulder's top on the candle chart.
3) A small sideways flag
4) and the current frustrating broadening descending bull flag. Which has cause much grief to participants but will likely gives an explosive quick large moves.
As you can see putting the chart can help in identifying trends.. key highs and lows and also gives patterns that may not be visible on a candle chart.
Another tool in your toolbox.

PROK on track to transform Kidney Disease. ProKidney Corp
(Nasdaq: PROK)
Is a clinical-stage biotech company pioneering a proprietary autologous cell therapy, rilparencel (REACT) for chronic kidney disease in diabetic patients.
Their phase 3 PROACT ! trial focuses on slowing kidney function decline using eGFR slop as the FDA accepted primary endpoint, with data expected in mid 2027.
With a market cap near $410M and growing trial enrolment, PROK aims to offer a transformative treatment restoring kidney function rather than only managing symptoms.
Watch for trial updates and potential breakout as data readouts arrive.

GU Could Aim For Higher Prices After Strong Reversal FormsHere on FX:GBPUSD we can see Price on the 4Hr Chart has formed an Inverse Head and Shoulders Pattern!
This is a Bullish indication that Price could be looking to Reverse and start moving higher!
Now the Pattern has been formed and a Valid Breakout has been made, the only thing left is for a Proper Retest of the Breakout!
Currently Price is working down after making the Breakout and once a successful Retest is made in the 1.3140 - 1.3135 range, we should see Price start to work up.
If the Breakout and Retest is correct, I suspect Price will make a break for the next layer of Resistance shown at the next Swing High of 1.33969.

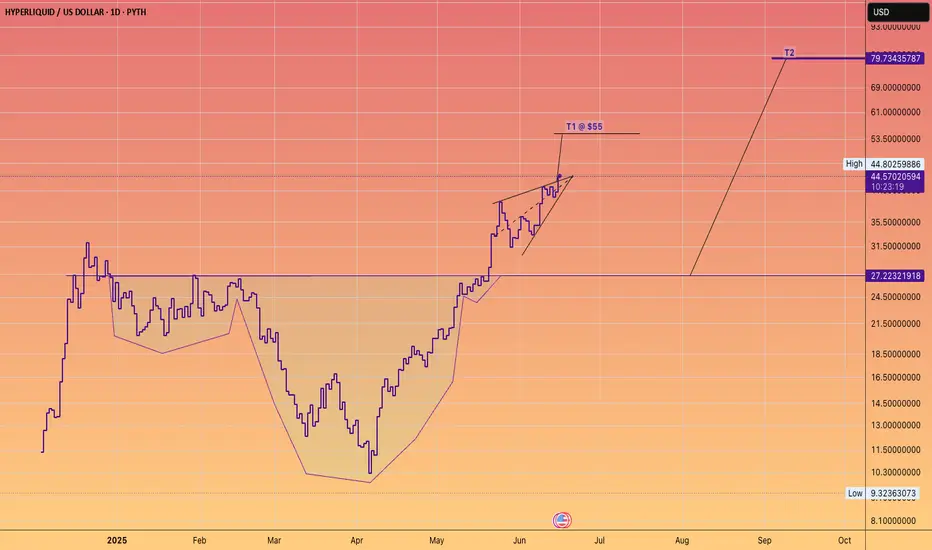
Don't fight the HYPE train!The James Wynn saga was wonderful advertising for the platform.
(Maybe it was staged).
Either way #Hyperliquid goes higher.
GOOG | The Year of Quantum | LONGAlphabet, Inc. is a holding company, which engages in software, health care, transportation, and other technologies. It operates through the following segments: Google Services, Google Cloud, and Other Bets. The Google Services segment includes products and services, such as ads, Android, Chrome, devices, Google Maps, Google Play, Search, and YouTube. The Google Cloud segment refers to infrastructure and platform services, collaboration tools, and other services for enterprise customers. The Other Bets segment relates to the sale of healthcare-related services and internet services. The company was founded by Lawrence E. Page and Sergey Mikhaylovich Brin on October 2, 2015 and is headquartered in Mountain View, CA.

TTD – Potential Inverse Head & Shoulders Formation in PlayA potential inverse Head & Shoulders formation appears to be developing on The Trade Desk (TTD) daily chart.
The neckline sits near 55.56.
A break and close above 55.56 could trigger the pattern, with an upside target around 67.28 based on the measured move. The target aligned with both the 50% Fibonacci retracement and the Ichimoku Senkou Span B — a key confluence area.
Invalidation lies below 48.54; a breakdown there would negate the setup.
Focus on the chart, not the headlines.
(Educational idea – not financial advice.)
