hopes for a inverse head and shoulder pattern a good contestant looking for inverse head and shoulder pattern in ZOMATO(ETERNAL)
Invertedheadandshoulders

Boeing shares ready to capitalize on recovery momentumNYSE:BA stock took a beating when the twin 737 Max disasters rightly sent the stock reeling a few years ago. It's been a long road to recovery since then, and setting aside the story, and fundamental drivers the technicals point to a big upside move getting underway.
Just look at the monthly chart which shows multiple positive signals
Inverted head & shoulders
Rising momentum across IHS formation
Massive gap left to fill from the 737 Max sell-off
Multi-year formation (very strong)

Inverse Head & Shoulders on JSL A textbook bullish reversal pattern is forming on Jindal Stainless. After a prolonged downtrend, the stock has carved out a deep Head between two higher Shoulders, with a clean neckline now in sight. Weekly RSI is strengthening, and price action shows signs of accumulation. A breakout above the neckline with volume could signal trend reversal and fresh upside.
Watch for sustained close above neckline + volume confirmation
Pattern targets can be projected from neckline to head depth.
Jindal Stainless Ltd., incorporated in the year 1980, is a Small Cap company (having a market cap of Rs 68,921.48 Crore) operating in Metals - Ferrous sector.
Jindal Stainless Ltd. key Products/Revenue Segments include Steel, Sale of services, Job Work, Other Operating Revenue and Export Incentives for the year ending 31-Mar-2025.
For the quarter ended 30-09-2025, the company has reported a Consolidated Total Income of Rs 10,982.46 Crore, up 6.87 % from last quarter Total Income of Rs 10,276.01 Crore and up 11.79 % from last year same quarter Total Income of Rs 9,823.88 Crore. Company has reported net profit after tax of Rs 821.71 Crore in latest quarter.
The company’s top management includes Mrs.Savitri Devi Jindal, Mr.Ratan Jindal, Mr.Abhyuday Jindal, Mr.Tarun Kumar Khulbe, Mr.Jagmohan Sood, Dr.Aarti Gupta, Mr.Ajay Mankotia, Mrs.Arti Luniya, Mr.Jayaram Easwaran, Dr.Rajeev Uberoi, Mrs.Shruti Shrivastava, Mr.Navneet Raghuvanshi. Company has Walker Chandiok & Co. LLP as its auditors. As on 30-09-2025, the company has a total of 82.44 Crore shares outstanding.

MY THOUGHTS ON GBP/USDIn my analysis of GBP/USD on the DAILY Chart , I forecast that price is moving toward the monthly resistance price of $1.34533 after breaking the neck of the Inverted Head & Shoulders and retesting support. In this analysis, I utilized chart patterns and price action. FX:GBPUSD

Bulls Still in Control?Hello traders! Here’s an idea for AUDCAD based on current structure, trend, and momentum.
(This is market analysis, not financial advice. Always use proper risk management and seek additional confirmations before entering a trade.)
Intraday Buy Idea (short term move)
• Entry: 0.91500 – 0.91600
• Stop-Loss: 0.91350 – 0.91300
• Target Area: 0.91800 – 0.92000
⸻
Market Analysis
AUD/CAD continues to trade within a relatively modest daily range—typical for this pair—especially as we approach the end of Q4 and move deeper into the holiday season, when liquidity thins and price action often becomes more choppy and range-bound.
On the 4-hour chart, an inverted head-and-shoulders pattern has formed. The market recently closed above the neckline/right-shoulder zone, confirming potential bullish structure. A clean retest of this zone (around 0.91500-0.91600) could provide an opportunity to catch the continuation of the bullish momentum that began late last week (around Nov 21).
Our target—0.92000—lines up closely with November’s high and a key structural resistance level. If momentum remains intact, price could attempt another test of this area.
⸻
Fundamentals (per economic sources)
Australia (AUD)
• The RBA has kept rates steady, maintaining stability in the AUD.
• Commodity prices trending higher (especially metals) provide underlying support for the Australian dollar.
• A potential shift toward U.S. Federal Reserve rate cuts later on can indirectly support AUD through broader USD softness and risk-on flows. (per economic sources)
Canada (CAD)
• Canada’s manufacturing sector continues to contract, signaling broader weakness.
• While recent GDP growth was positive, the expansion was driven mainly by oil exports and government spending, not broad economic strength.
• Mixed and uneven economic performance may limit near-term CAD strength.
Combined, these factors support a slightly bullish bias for AUD/CAD in the near term, aligning with this technical setup.

ETHUSD - Inverted H&S An inverted H&S pattern forming with only the right shoulder yet to complete.
I expect following the right shoulder upward movement to come, not sure how much but it will be there.
Chart pattern analysis on this daily timeframe.
Alt season?

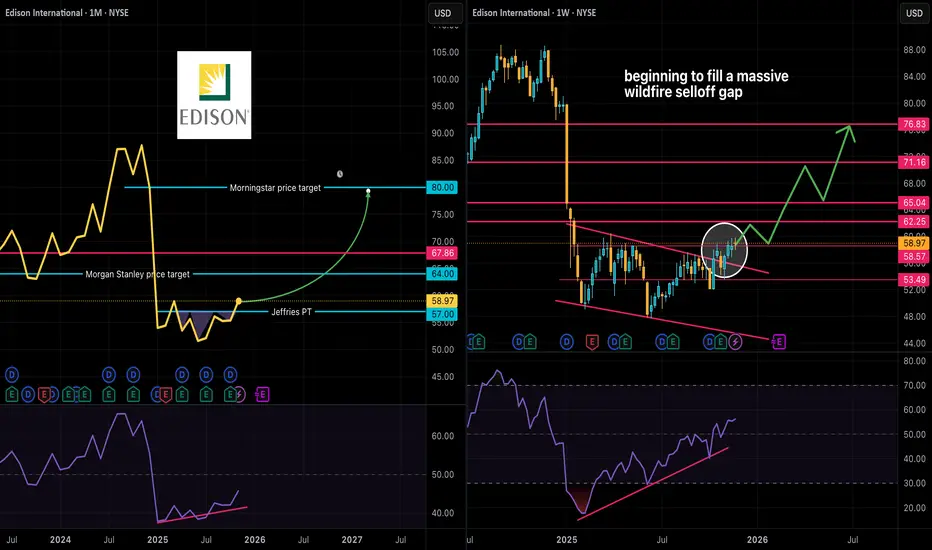
EIX -- Powering the AI Surge: Why Edison Is the Utility to WatchEdison International (NYSE: NYSE:EIX ) finds itself in a compelling position heading into the next wave of energy demand — and the decline in its stock price amid wildfire concerns may present a window of opportunity.
Why it’s discounted
The company’s subsidiary Southern California Edison (SCE) pulls power for roughly 15 million customers across California and has faced elevated wildfire risk, including the major January 2025 fires around Los Angeles. These events brought increased scrutiny, higher operating costs and legal exposure.
Why it’s potentially undervalued
Despite these headwinds, Edison has a resilient regulatory and operating foundation. Its 2024 annual report shows core earnings rising and a strong rate-base growth outlook.
Analysts at Seeking Alpha argue that the market may be overestimating the wildfire liability risk and underestimating Edison’s stable earnings power. PG&E was found culpable within a month of the wildfires that lead to its bankruptcy, but 11 months later Edison still has not been found culpable for the 2025 LA fires.
Technicals
The wildfire scare resulted in a wicked drawdown. That seems to have found a bottom, and lately NYSE:EIX shares have demonstrated strength; on top of that strength sits a healthy dividend. If current resistance is taken out, and an unseasonably moist California holds wildfire fears at bay, thirsty AI data centers may push NYSE:EIX shares into the lower $70s.
Cello World Ltd – Weekly Inverted Head & Shoulders Breakout📊 Cello World Ltd – Weekly Inverted Head & Shoulders Breakout 🧩
📅 Chart Date: October 29, 2025 | Timeframe: Weekly
📈 CMP: ₹660.60 (+4.74%)
📍 Symbol: NSE:CELLO
🔍 Technical Overview
📉 Pattern: Inverted Head & Shoulders (Reversal Pattern)
The stock formed a clear inverted H&S structure after a long downtrend, signalling potential trend reversal.
Neckline breakout seen near ₹645, accompanied by rising volume momentum — suggesting buyer dominance.
💥 Volume Confirmation (🔊)
Weekly volume surged to 3.2M, up significantly from the average of 1.02M, validating the breakout.
📈 Next Resistance Zone: ₹745–₹780
📉 Immediate Support: ₹640 (neckline zone)
⚠️ Disclaimer
This analysis is for educational and charting purposes only. Not a buy/sell recommendation. Always do your own research before trading or investing

Potential Reversal Ready To Flip AU On Its "Head"Price on OANDA:AUDUSD is almost complete with forming the Right and final Shoulder of the potential Inverted Head and Shoulders Pattern!
Once Price has visited the Neckline of the Pattern, it will be Confirmed and will suggest that Price is looking to head higher!!
Once Confirmed, we will want to wait for a Valid Breakout and a Retest to generate potential Long Opportunities to take up to the next Resistance @ .6620!

Tata Motors Inverted Head n ShoudlersTata motors is making an inverted Head n Shoulder on the daily timeframe. A long entry can be made in this scrip at the retest levels of around 704-706. Support can be 670 which is the right shoulder low for Swing traders and for intraday traders todays low can be the support.
Targets can be 740 750 for swing. Look at the chart for understanding how an Head n Shoulder works and follow for more such ideas.
Disclaimer- This is just for educational purpose.
Jai Shree Ram.

DAX40 Quick Trade Double Bottom Buy ChanceDouble bottom on the 1 hour candle chart and inverted head and shoulder on the line chart.
Good luck
Markets Titan

Nifty Weekly chart - in Making of Inverted Head and Shoulder Disclaimer : Do your own research before investing. This is just a chart analysis. No recommendation to buy and sell.
Nifty is in making of Inverted head and Shoulder pattern on Weekly Chart.
CMP is Rs. 24560/- On the upper side it can go upto Rs.26000/- and lower side can go upto Rs. 23000.

Can Yen Futures Push Higher? Inverted H&S Breakout in Focus1. Introduction
Japanese Yen Futures (6J) and Micro Yen Futures (MJY) are showing a promising technical setup that traders are watching closely. On the daily chart, an inverted Head and Shoulders pattern has formed, suggesting a potential reversal from recent weakness. The neckline lies around 0.006850, and if prices sustain a breakout above this level, the upside projection aligns neatly with a UFO resistance zone near 0.007100.
Adding weight to this bullish case, the MACD histogram is diverging positively, with higher lows forming while price action recorded lower lows. This bullish divergence suggests underlying momentum could support the completion of the pattern and drive Yen Futures higher in the sessions ahead.
2. Understanding the Inverted Head & Shoulders Pattern
The inverted Head & Shoulders (H&S) is a widely recognized reversal formation that often signals the end of a bearish trend. It is composed of three troughs: the left shoulder, the head (the deepest low), and the right shoulder, which is typically shallower. The neckline acts as the key breakout level, and once broken, the projected price target is measured from the head to the neckline, then projected upward.
In the case of Japanese Yen Futures, the neckline sits around 0.006850. A confirmed break above this price would validate the pattern, projecting a target toward 0.007100.
3. The Role of MACD Divergence
Momentum indicators could provide early clues about the strength of a potential breakout. In this case, the MACD histogram is showing bullish divergence—price made lower lows, while the histogram made higher lows. This divergence signals that selling pressure may be weakening, even as price was still falling.
Such conditions could potentially precede significant reversals, and when they align with a clear price pattern like the inverted Head & Shoulders, the probability of follow-through may increase. Traders monitoring this confluence will be looking at the neckline breakout above 0.006850 as the technical trigger that confirms it.
4. Contract Specs: Yen Futures vs. Micro Yen Futures
Understanding contract specifications helps traders size positions correctly and manage risk efficiently.
o Japanese Yen Futures (6J)
Contract Unit: ¥12,500,000
Minimum Tick: 0.0000005 per JPY = $6.25 per contract
Initial Margin (approximate, subject to change): ~$3,100
Popular with institutional traders due to larger notional exposure.
o Micro JPY/USD Futures (MJY)
Contract Unit: ¥1,250,000 (1/10th of standard 6J contract)
Minimum Tick: 0.000001 per JPY = $1.25 per contract
Initial Margin (approximate, subject to change): ~$310
Provides accessibility for retail traders and allows more granular risk management.
Both contracts track the same underlying, but the Micro contract offers flexibility for traders with smaller accounts or those looking to fine-tune position sizes.
5. Trade Plan & Stop Loss Options
With the inverted Head & Shoulders pattern taking shape, the trade bias turns long above the neckline breakout at 0.006850. The upside objective aligns with the resistance around 0.007100, providing a clearly defined target.
Two possible stop-loss placements can be considered:
o Below the Right Shoulder
Provides a valid protection but may offer a weaker Reward-to-Risk (R:R) ratio depending on the right shoulder height.
Useful for conservative traders looking to minimize drawdowns.
o Mathematically Below the Neckline
Positioned far enough to allow for retests of the neckline while aiming for a 3:1 R:R ratio.
Provides a balance between protection and potential profitability.
This approach ensures flexibility, letting traders choose between tighter risk control or a more favorable reward profile.
6. Risk Management Considerations
No pattern or indicator guarantees success, making risk management the cornerstone of any futures strategy. A few key principles stand out:
Always use a stop loss: Prevents small losses from escalating into significant drawdowns.
Avoid undefined risk exposure: Futures are leveraged products; unprotected trades can lead to large, rapid losses.
Precision in entries and exits: Reduces emotional decision-making and improves consistency.
Position sizing matters: Adjusting the number of contracts ensures risk stays proportional to account size.
Diversification and hedging: Yen futures can be used as a hedge against equity or bond market volatility, but should not necessarily replace broader risk controls.
In this context, choosing the stop-loss level carefully and sticking to the pre-defined trade plan is more important than the pattern itself.
7. Conclusion & Forward View
Japanese Yen Futures (6J) and Micro JPY/USD Futures (MJY) are at a critical juncture. The inverted Head & Shoulders on the daily chart, supported by a bullish MACD divergence, highlights a potential reversal in progress. A breakout above the neckline at 0.006850 opens the door for an advance toward the 0.007100 UFO resistance zone.
While the setup looks constructive, it is crucial to recognize that even strong patterns can fail. This is why risk management—through proper stop-loss placement and careful position sizing—remains the most important aspect of any trading plan.
When charting futures, the data provided could be delayed. Traders working with the ticker symbols discussed in this idea may prefer to use CME Group real-time data plan on TradingView: www.tradingview.com - This consideration is particularly important for shorter-term traders, whereas it may be less critical for those focused on longer-term trading strategies.
General Disclaimer:
The trade ideas presented herein are solely for illustrative purposes forming a part of a case study intended to demonstrate key principles in risk management within the context of the specific market scenarios discussed. These ideas are not to be interpreted as investment recommendations or financial advice. They do not endorse or promote any specific trading strategies, financial products, or services. The information provided is based on data believed to be reliable; however, its accuracy or completeness cannot be guaranteed. Trading in financial markets involves risks, including the potential loss of principal. Each individual should conduct their own research and consult with professional financial advisors before making any investment decisions. The author or publisher of this content bears no responsibility for any actions taken based on the information provided or for any resultant financial or other losses.

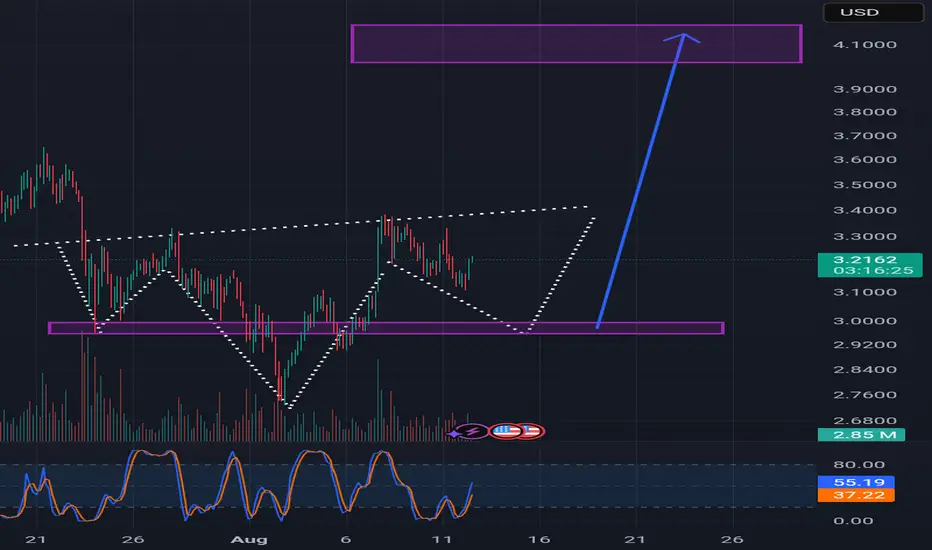
Would I be even close? I'm still learning Hello, I'm not doing this as someone who knows what they are doing right, as I'm still learning. I'm publishing my idea to see if I'm even close to seeing the possible correct path . And please if I'm incorrect,let me know, this seems to be the only way I learn.
So if this inverted head and shoulder plays out, we would be looking at a completion of shoulder around the lower rectangle and would look to complete upper rectangle. I know I'm not using proper words or even exact measurements areas. I appreciate any feedback back
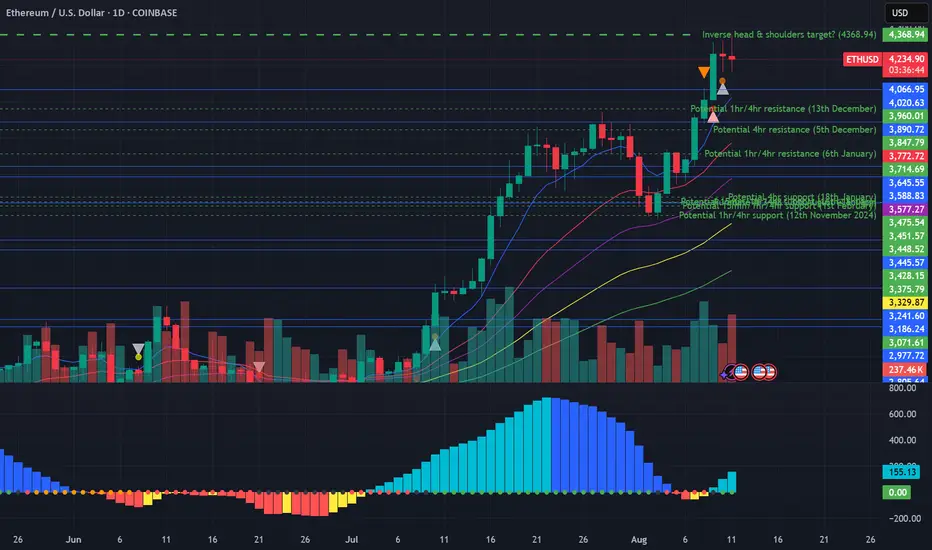
Potential inverse head and shoulders target reached on EthereumWell... nearly reached at this stage anyway. In a similar vein to Dow Theory (in which you would normally expect that the Dow Jones Industrial Average would rise alongside the Dow Jones Transportation Index, the Nasdaq Composite, the SP500 and the Russell 2000 indices), let's suppose you would expect that Ethereum would rise alongside Bitcoin and the other altcoins.
Let's face it, Ethereum has had a great run recently, but what has Bitcoin been doing over the past month in particular? Literally nothing. Zero, zilch, nada... But why am I bringing up caution at this stage whilst everyone is so bullish about Ethereum? Let's scale out. If you look very far out to earlier this year, there was spike down in February for Ethereum (which formed a 'left shoulder' downward), and further retracement in share price downward to the ultimate low in April two months later to form the 'inverted head', followed by upward movement to form the inverted 'right shoulder' in late June.
This allows us to draw a 'neckline' at around about the 2880 level. Extending calculations from this neckline to the inverted head provides a range of approximately 1400, but when utilising exact numbers utilising charting software, and extending this range upwards from the neckline northwards provides a potential target of 4,368.94, which is fairly close to where we've been recently (the high of 4,333.13 about 2 hours ago at the time of writing).
Unless Bitcoin can get itself moving, as well as Ethereum turn around with respect to the one hourly momentum, tread cautiously and consider the possibility that the target may be reached of this head and shoulders target for Ethereum (thus, neutral bias at this stage, with potential to turn bearish).
BULLISH - Short Term Breakout - Inverted Head and Shoulder Regarding the daily price forecast from July 28, 2025 (Monday), through August 1, 2025 (Friday), the projections are derived from the bull flag continuation pattern, cross-referenced with aggregated analyses from recent market data, technical indicators (such as RSI and MACD showing neutral-to-bullish momentum), on-chain metrics (indicating accumulation at $115,000–$117,000), and a distribution of expert predictions. These include short-term consolidation with a potential dip for liquidity clearance, followed by a breakout, aligning with historical post-halving cycles and institutional inflows. Note that cryptocurrency prices are inherently volatile and influenced by factors such as Federal Open Market Committee outcomes, ETF flows, and macroeconomic events; these forecasts are speculative and not financial advice.
• July 28, 2025 (Monday): Anticipated consolidation within the flag channel amid low weekend volume. Expected range: $116,800–$118,500. Key targets: Support at $116,700 (lower flag boundary, potential entry for accumulation); resistance at $118,500 (upper flag line, breakout watch level). Average closing prediction: $117,800, reflecting neutral sentiment with minor downside risk if global markets weaken.   
• July 29, 2025 (Tuesday): Possible test of lower support amid early-week volatility, potentially sweeping liquidity before rebounding. Expected range: $116,000–$119,000. Key targets: Downside at $116,000 (critical on-chain accumulation zone); upside at $119,000 (initial breakout threshold). Average closing prediction: $117,500, with a 40% probability of a brief dip followed by stabilization.   
• July 30, 2025 (Wednesday): Breakout attempt likely if support holds, driven by mid-week momentum and potential dovish policy signals. Expected range: $117,500–$120,500. Key targets: Support at $117,000 (mid-channel level); resistance at $120,000 (psychological barrier and prior high). Average closing prediction: $118,900, assuming bullish confirmation above $118,500.   
• July 31, 2025 (Thursday): Extension of upward movement post-breakout, with volume potentially increasing. Expected range: $118,500–$122,000. Key targets: Support at $118,000 (retest of breakout level); resistance at $121,000 (flagpole projection start). Average closing prediction: $120,200, supported by technical alignment and ETF inflow trends.   
• August 1, 2025 (Friday): Momentum continuation toward weekly close, with risk of profit-taking. Expected range: $119,500–$123,500. Key targets: Support at $119,000 (new floor post-breakout); resistance at $123,000 (extended target based on pattern measurement). Average closing prediction: $121,800, aligning with broader bullish forecasts for early August.   

GBPUSD Long Trade Alert – Inverted Head & Shoulders BreakoutGBPUSD has confirmed a classic Inverted Head & Shoulders pattern, signaling a strong bullish reversal opportunity on the 2-hour chart. Price has successfully broken above the neckline resistance zone (~1.3490) and has now retested that zone, forming a bullish engulfing candle — an ideal confirmation for long entries.
🟢 Trade Plan:
Entry: After bullish engulfing candle formed on neckline retest (~1.3490–1.3500)
Stop Loss: Just below the right shoulder low / retest swing low (~1.3455)
Risk/Reward Ratio: ~4:1 (High reward with tightly controlled risk)
🎯 Target Levels:
Target 1: 1.3555
Final Target (Projected): 1.3620
These levels align with structure resistance and measured move of the pattern
📌 Why This Trade Matters:
Pattern confirmed ✅
Retest successful ✅
Bullish confirmation candle ✅
Clean invalidation and upside potential ✅
This is a textbook reversal play, offering solid structure, clear stop placement, and attractive upside. Perfect for swing traders or short-term position setups.
📉 Trade what you see, not what you think. Let price action lead your execution.
=================================================================
Disclosure: I am part of Trade Nation's Influencer program and receive a monthly fee for using their TradingView charts in my analysis.
=================================================================

GBPUSD Long Opportunity – Inverted Head & Shoulders PatternGBPUSD is currently forming a classic Inverted Head & Shoulders pattern on the 1-hour timeframe — a powerful trend reversal signal that typically marks the shift from bearish to bullish momentum. The structure is clear, with a defined left shoulder, head, and right shoulder, and price now approaching the neckline resistance around 1.3488–1.3495.
Traders should now shift focus to two key confirmation events:
A neckline breakout
A successful retest of the neckline with a bullish reversal candle (e.g., bullish engulfing)
🔍 Trade Plan (Long Setup)
Entry: After 1H candle closes above neckline (~1.3490), wait for a retest of the breakout
Enter long on bullish confirmation candle during the retest
Stop Loss: Below the swing low of the retest (around 1.3440–1.3450)
Risk/Reward Ratio: ~5.5:1
🎯 Target Zones:
TG1: 1.3540 (Minor Resistance)
TG2: 1.3585 (Next structure zone)
Final Target: 1.3627+ (Full measured move from pattern)
📌 Confirmation Tips:
Look for bullish candlestick confirmation on neckline retest (bullish engulfing, hammer, or strong rejection wick)
Avoid entering inside the pattern – confirmation is key to reduce false breakouts
⚠️ Note to Traders:
This setup aligns with a possible shift in sentiment for GBPUSD. The pattern is developing against the larger downtrend, so discipline and stop-loss protection are crucial. A successful breakout and retest would suggest a potential short-term bullish reversal with clean upside targets.
🧠 Stay patient. Let the breakout confirm. Execute with structure.
=================================================================
Disclosure: I am part of Trade Nation's Influencer program and receive a monthly fee for using their TradingView charts in my analysis.
=================================================================

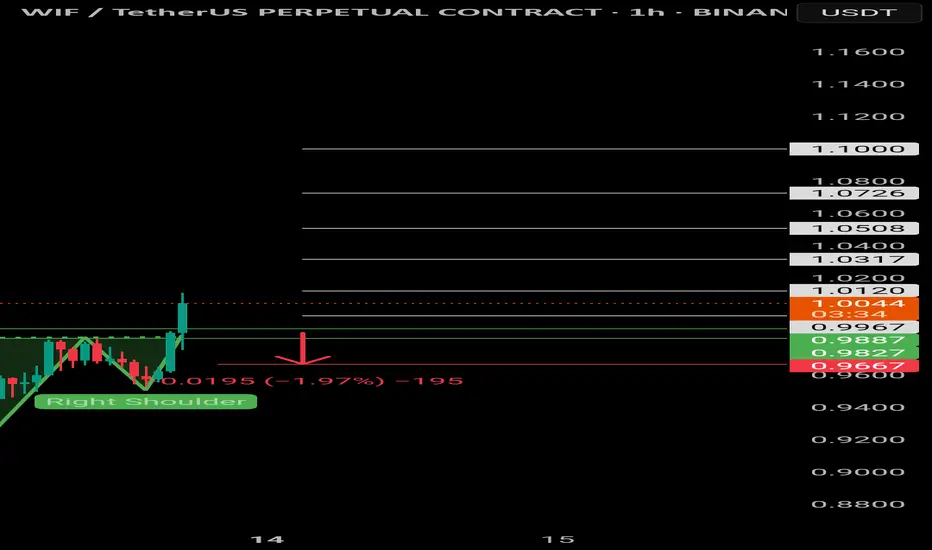
$WIF | Inverted head and shoulders $Wif/Usdt
BINANCE:WIFUSDT.P
The price is formed the Inverted head and shoulders pattern and did a breakout of the neckline, expecting the price to retest green lines (neckline).
If 1H CC hit and bounce above the green lines, it'll be a long opportunity.
Entering at current price will increase the SL, it's suggested to wait for a retest, to have better entry and a good risk management.
Use only 1-2% of your portfolio.
NFA, DYOR
TP:
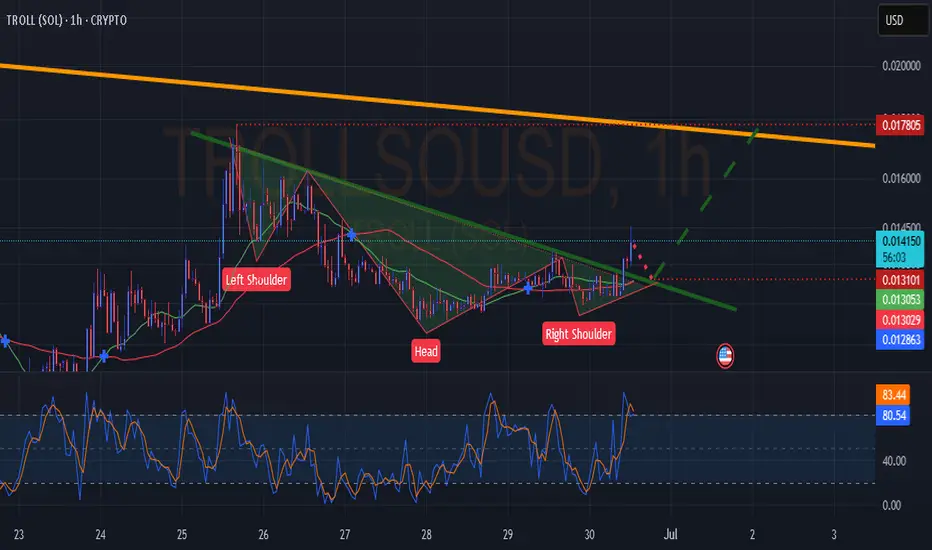
TROLL(SOL) IH&SGood day everyone. IH&S On troll. Touch back to the trend_line & take off to the upper red dotted line. Not financial advice.
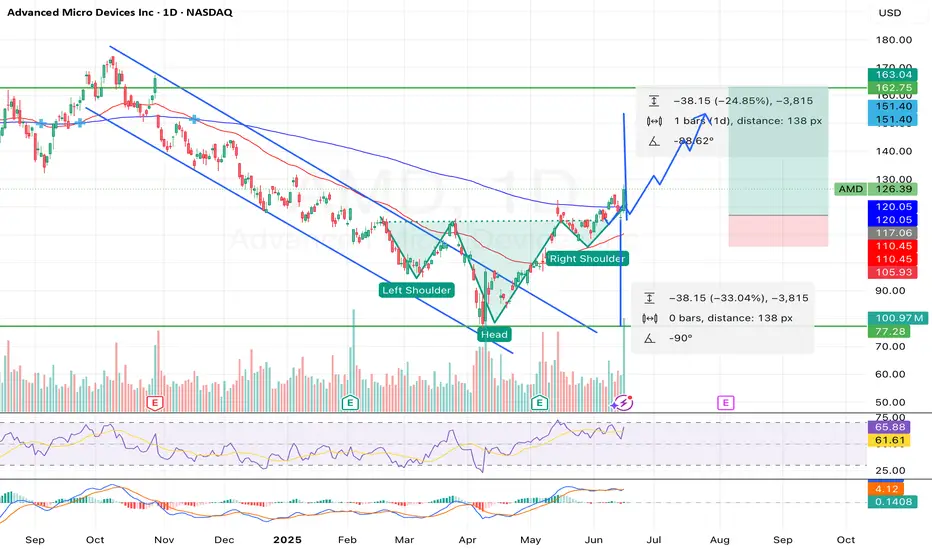
Breakout Alert: AMD Head & Shoulders Points to $160+Overview
Name: Advanced Micro Devices, Inc.
Ticker Symbol: AMD
Exchange: NASDAQ
Founded: 1969
Headquarters: Santa Clara, California, USA
CEO: Lisa Su (as of 2025)Sector: Technology / Semiconductors
About
AMD is a leading semiconductor company known for its high-performance computing and graphics solutions. It competes with Intel and NVIDIA in the CPU, GPU, and data center markets. Its product line includes Ryzen (desktop/laptop CPUs), EPYC (server CPUs), and Radeon (GPUs), with strong expansion in AI and custom silicon for next-gen applications.
Fundamentals
Earnings: AMD reported strong Q1 2025 earnings with a beat on both revenue and EPS, supported by explosive demand in the AI and data center segments.Revenue: $6.52B, up 21% YoY
Outlook: The company raised guidance for the second half of 2025 as it expects to benefit from the AI chip boom and new product rollouts.
Technicals (4H Chart)
Inverted Head and Shoulders pattern confirmed with neckline breakout around ~$117
Breakout from Falling Channel aligning with bullish reversal structure
Price surged past resistance with strong volume, currently at $126.39 (+9.71%)
RSI at 65.88, approaching overbought but not signaling weakness
MACD bullish crossover, confirming momentum
Short-term target range: $145–$150, with extended projection up to $162.75
📌 Support Levels: $117, $111.50📈 Target Price (TP): $162.75 (based on pattern breakout height projection)
💡 My Take
AMD just pulled off a textbook bullish reversal — inverted head and shoulders breakout combined with a falling channel exit. With strong macro trends in AI hardware and data center expansion, this move feels well-supported fundamentally and technically.
The clean neckline breakout and explosive candle suggest continuation. I am expecting a potential consolidation around $130–$135ish before next leg to $150+. If momentum holds, $162+ is possible before August.
💼 Position
Type: AMD 145 Call
Expiry: July 03, 2025
Quantity: 15
Average Cost Basis: $.038
Date Purchased: June 12, 2025
Last Price: $0.47
Total % Gain/Loss: +23.4%
I entered after the neckline break and riding the wave. AMD’s setup is too clean to ignore — high conviction play.
Could BOJ's "HOLD" on Rates Turn AUDJPY "On Its Head"?Here I have a Multi-Timeframe analysis on OANDA:AUDJPY which is giving multiple signs of Higher Prices potentially to come!!
First on the Daily we can see that Price formed a Hammer Candle after testing the March 11th Support Zone and as the next Daily candle forms (Today), we are already seeing a Bullish Confirmation candle begin!
*Bullish Engulfing would be a textbook Confirmation Candle!
Now zooming into the 4Hr / 1 Hr Charts, this Hammer is formed by what looks to be a very Strong Reversal Pattern, the Inverted Head and Shoulders!
Now we are still waiting for the Confirmation of the Pattern where Price needs to rise to the "Neckline" or Resistance Level.
Once Confirmed, we will look for a Breakout of the Pattern and if Validated, could deliver great Long Opportunities as a Breakout and Retest of the Inverted Head and Shoulders Pattern!
If the Pattern is Successful, we could expect the Price Target to be at the next level of Resistance being the 95.3 - 95.6 Area!
Fundamentally, the BOJ begins the week with Policy Rate decision Monday evening where they forecast a HOLD on Interest Rates, staying at .5%. This could have drastic implications on the JPY, potentially weakening it.

$INJ - Inverted head and shouldersCRYPTOCAP:INJ
BINANCE:INJUSDT.P
The price recently broke out from the inverted head and shoulders pattern; now, the price is going to retest the pattern's neckline.
If the price hits and bounces above the white line zone, or if the 4H candle hits and closes above the upper white line, it will be a good long opportunity.
TP: YELOW LINES
SL: 12.052 / 4H CC BELOW
NFA, DYOR
FOLLOW FOR MORE AND SHARE WITH YOUR COMMUNITY.
DON'T FORGET TO HIT THE BOOST BUTTON.
