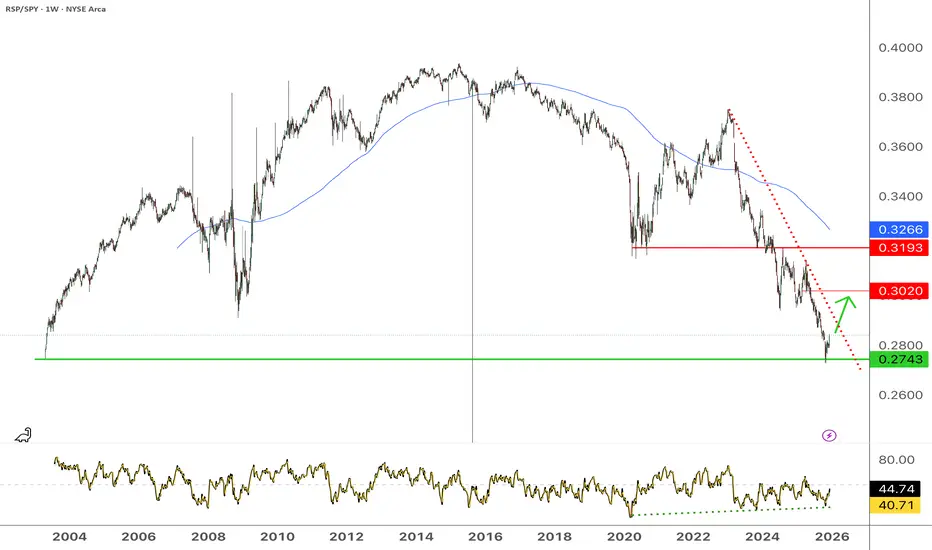
US large caps starting to underperform (RSP/SPY)S&P500 Equal weight / S&P500 (RSP/SPY) has rebounded from the 0.27 level, corresponding from its low in 2003. Expecting a rise towards at least 0.30, possibly even 0.319, as long as the low is holding. Therefore large caps tech stocks should underperform the index over the next few months.
Largecaps
When Generals Run and Soldiers Nap — The Market’s Odd ParadeEver seen an army march where the generals sprint ahead, but the soldiers just yawn and stay behind?
That’s exactly what’s happening in the U.S. futures battlefield right now.
The ES, NQ, and YM — our large-cap “generals” — opened the week above their prior highs, looking ready for victory speeches. But the RTY, representing small caps, is still lagging like it hit the snooze button.
The Breadth Problem
Healthy rallies need everyone on board. When small caps don’t join the charge, it’s like running a marathon with only one leg — you might move forward, but not for long.
That’s why this gap between the big guys and the small ones is called bearish divergence — momentum without muscle.
How Deep Could It Go?
Under the surface, liquidity pockets (UFO supports) show the “landing zones” below price:
ES: ~5% lower
NQ: ~6% lower
YM: ~9% lower
RTY: ~14% lower (!)
Translation: if the market trips, the generals may bruise a knee — but the soldiers could roll down the hill.
Tick, Margin, and Scale
CME index futures come in two flavors — E-minis for the pros, Micro E-minis for precision control:
S&P 500 (ES/MES): tick 0.25 → $12.50 / $1.25; margin ≈ $21K / $2.1K
Nasdaq 100 (NQ/MNQ): tick 0.25 → $5 / $0.50; margin ≈ $30K / $3K
Dow Jones (YM/MYM): tick 1 → $5 / $0.50; margin ≈ $13K / $1.3K
Russell 2000 (RTY/M2K): tick 0.10 → $5 / $0.50; margin ≈ $9K / $0.9K
(Approximate numbers, educational only.)
The Lesson
Breadth divergences don’t “predict” the end of the rally — they just whisper: “Careful, this parade’s out of sync.”
So before chasing the next breakout, remember:
even the best generals can’t win a war if their soldiers stay in camp.
Want More Depth?
If you’d like to go deeper into the building blocks of trading, check out our From Mystery to Mastery trilogy, three cornerstone articles that complement this one:
🔗 From Mystery to Mastery: Trading Essentials
🔗 From Mystery to Mastery: Futures Explained
🔗 From Mystery to Mastery: Options Explained
When charting futures, the data provided could be delayed. Traders working with the ticker symbols discussed in this idea may prefer to use CME Group real-time data plan on TradingView: www.tradingview.com - This consideration is particularly important for shorter-term traders, whereas it may be less critical for those focused on longer-term trading strategies.
General Disclaimer:
The trade ideas presented herein are solely for illustrative purposes forming a part of a case study intended to demonstrate key principles in risk management within the context of the specific market scenarios discussed. These ideas are not to be interpreted as investment recommendations or financial advice. They do not endorse or promote any specific trading strategies, financial products, or services. The information provided is based on data believed to be reliable; however, its accuracy or completeness cannot be guaranteed. Trading in financial markets involves risks, including the potential loss of principal. Each individual should conduct their own research and consult with professional financial advisors before making any investment decisions. The author or publisher of this content bears no responsibility for any actions taken based on the information provided or for any resultant financial or other losses.
Generals Charge, Soldiers Stall: Reading Bearish Divergence1. Context: The Battle Line Between Large and Small Caps
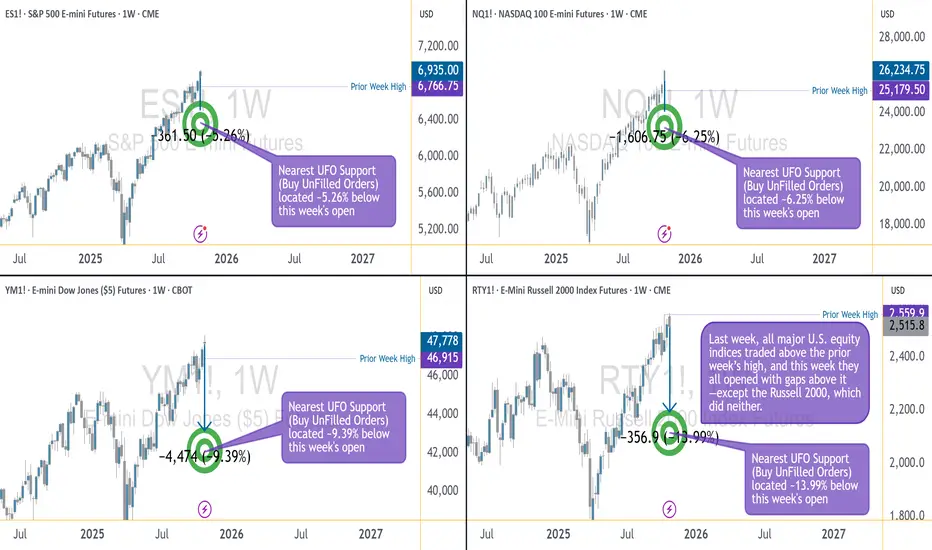
This week’s futures landscape paints a striking contrast between leadership and hesitation. In the CME equity index universe, the large caps — ES (E-mini S&P 500), NQ (E-mini NASDAQ 100), and YM (E-mini Dow Jones) — advanced as a united front, all opening above their prior week’s highs. The market generals were charging confidently uphill.
Yet, on the same battlefield, the RTY (E-mini Russell 2000) lagged behind. The small caps failed to take out the prior week’s high and opened below the aggressive gaps that marked their larger counterparts. In trader terms, breadth was narrowing. In storyteller terms, the generals were calling “forward!” — but the soldiers weren’t following.
Such divergences in participation often mark transition zones in market psychology. When large caps push while small caps stall, it doesn’t necessarily mean the campaign is lost — but it does mean confidence among the broader troops is weakening.
2. Reading the Divergence: When Breadth Narrows
The relationship between large-cap and small-cap indices often reveals more than just price action — it exposes the structure of conviction. In sustained bullish environments, small caps tend to lead or at least confirm the move. Their participation signals that risk appetite is healthy across the field, not confined to the biggest names.
When that breadth fades, the advance becomes fragile. A rally driven only by mega-cap components (the generals) can stretch further, but with decreasing participation, it becomes increasingly vulnerable to shocks. Traders who watch intermarket behavior know this phenomenon as bearish divergence — higher highs in the generals, lower or flat highs in the soldiers.
From a practical standpoint, narrowing breadth implies that fewer sectors are carrying the index higher. In other words, the market’s engine is running on fewer cylinders. This is not a timing trigger on its own, but it is a powerful contextual clue suggesting that volatility could expand when the leadership stumbles.
3. Quantifying the Risk: Supports and Market Depth
Looking beneath price, Order Flow (UnFilled Orders) provides a sense of where liquidity may reside once the current rally pauses. Key UFO support zones, acting as potential demand clusters, reveal how far the market might travel before encountering fresh buy interest.
From this week’s open:
ES shows its next support roughly 5.26% below current levels.
NQ sits around 6.25% below.
YM’s cushion lies approximately 9.39% beneath.
RTY, however, faces a much deeper air pocket — the next notable UFO support sits nearly 13.99% lower.
This asymmetry is critical. If markets retreat, small caps have the most unprotected downside terrain before reaching meaningful support. In other words, the generals may fall back a few miles, but the soldiers could tumble down the hill.
These percentages don’t guarantee a move — they outline the potential amplitude of correction if risk-off flows accelerate. The deeper the distance to support, the larger the volatility zone beneath.
4. Strategic View: Large Caps Lead, but Are They Overextended?
The current setup puts traders in a classic tactical dilemma:
Are the generals inspiring a new advance, or are they overextended and exposed?
Two plausible scenarios emerge:
Continuation scenario: If the small caps (RTY) regain strength and take out their prior week’s high, the breadth gap could close. This would validate the generals’ move and reestablish a broad-based advance.
Correction scenario: If RTY continues to stall while ES, NQ, and YM fail to sustain their gaps, it would confirm a divergence-led weakening. A close back below prior week’s highs could trigger a retreat toward the support zones identified earlier.
The idea is not to predict a reversal, but to prepare a framework in case weakness unfolds.
5. Contract Overview: E-mini and Micro Versions
To analyze or engage these markets, traders can study both E-mini and Micro E-mini contracts listed on the CME. These contracts represent standardized ways to participate in U.S. equity index movements, but at different notional sizes.
E-mini contracts (ES, NQ, YM, RTY) are the long-standing institutional benchmark instruments that track major U.S. equity indices with efficient liquidity and tight spreads.
Micro E-mini contracts (MES, MNQ, MYM, M2K) provide the same exposure pattern at one-tenth the size, offering more granularity in risk management and flexibility for smaller accounts or precise hedging.
It’s important to understand that these futures allow directional and hedging applications without requiring ownership of the underlying equities. However, as with any leveraged product, margin requirements can amplify both gains and losses. Traders should familiarize themselves with margin-to-equity ratios and maintenance requirements before participation.
S&P 500 – ES / MES
Minimum tick: 0.25 points
Tick value: $12.50 (E-mini) | $1.25 (Micro)
Typical margin: ≈ $21K (E-mini) | ≈ $2.1K (Micro)
NASDAQ 100 – NQ / MNQ
Minimum tick: 0.25 points
Tick value: $5.00 (E-mini) | $0.50 (Micro)
Typical margin: ≈ $30K (E-mini) | ≈ $3.0K (Micro)
Dow Jones – YM / MYM
Minimum tick: 1 point
Tick value: $5.00 (E-mini) | $0.50 (Micro)
Typical margin: ≈ $13K (E-mini) | ≈ $1.3K (Micro)
Russell 2000 – RTY / M2K
Minimum tick: 0.10 points
Tick value: $5.00 (E-mini) | $0.50 (Micro)
Typical margin: ≈ $9K (E-mini) | ≈ $0.9K (Micro)
Please note that all margin requirements are approximate and may be adjusted.
6. Risk Management Spotlight
Breadth divergences can test patience and positioning discipline. Managing exposure becomes as important as analyzing the signal itself.
Here are three core reminders:
Position Sizing: Adjust to volatility. If the distance to the nearest support is wide, scale down accordingly to maintain a consistent risk percentage per trade.
Stop-Loss Discipline: Predetermine exit points based on technical invalidation, not emotion.
Capital Preservation: Capital is ammunition; running out of it limits participation when true opportunity returns.
In the end, risk management isn’t about avoiding loss; it’s about surviving long enough to thrive when clarity returns. When markets are divided between generals and soldiers, maintaining balance becomes a trader’s greatest edge.
7. Educational Takeaway
The “generals vs. soldiers” analogy reminds us that market structure is not just about price—it’s about participation. When large caps surge but small caps lag, it signals a potential exhaustion point in the broader advance. The healthiest rallies are those in which all troops move in sync.
For traders and investors, breadth divergences serve as an early-warning system, not a countdown clock. They encourage a review of exposure, tighter stop placement, and a shift toward risk-awareness rather than return-chasing.
At this stage, the technical setup across U.S. index futures reads like a fragile truce: ES, NQ, and YM maintain their gains above prior-week highs, while RTY still lingers below. Should the soldiers eventually follow, confidence could rebuild. But if the generals start retreating first, the path toward their UFO supports could unfold quickly.
The core takeaway: breadth divergences don’t predict timing—they illuminate imbalance. Recognizing that imbalance early allows traders to respond intelligently instead of react emotionally when volatility expands.
When charting futures, the data provided could be delayed. Traders working with the ticker symbols discussed in this idea may prefer to use CME Group real-time data plan on TradingView: www.tradingview.com - This consideration is particularly important for shorter-term traders, whereas it may be less critical for those focused on longer-term trading strategies.
General Disclaimer:
The trade ideas presented herein are solely for illustrative purposes forming a part of a case study intended to demonstrate key principles in risk management within the context of the specific market scenarios discussed. These ideas are not to be interpreted as investment recommendations or financial advice. They do not endorse or promote any specific trading strategies, financial products, or services. The information provided is based on data believed to be reliable; however, its accuracy or completeness cannot be guaranteed. Trading in financial markets involves risks, including the potential loss of principal. Each individual should conduct their own research and consult with professional financial advisors before making any investment decisions. The author or publisher of this content bears no responsibility for any actions taken based on the information provided or for any resultant financial or other losses.

tesla still has a shot at ATHthis bull market has carried tsla to prices not seen since september 2022. with the size of the bounce and the consolidation in the s&p500 volatility is expected to rise in this name. the trend continuation could happen at any of these market structure levels, an i would remain long the stock on any breakout or bounce from these levels. ive used horizonfal lines to mark out support, resistance and pivot levels that could sway price. is aim as high as ATH or as low as pwVAH.

right here, right meowin a perfect world we would be able to say that this is the start of a broader market recovery with an almost absolute degree of certainty. this is the real world however, and we all have to keep in the backs of our minds that things could still go very badly for longs. that being said bulls do appear to be keeping control of this bounce, and shorts look like theyre ready to start hitting pretty major stoplosses starting a massive squeeze. if we stay over this area, and steer all signals upward im banking on hitting those upper levels, and if we dont... then we dont. we are probably headed back to the lows at the very least, and possibly much lower if we cant maintain this momentum. however we are quite near confirmation of the first weekly higher low in more than a year. that is major.

LTC/BTC - 1D Support + Trend LineSince mid June 2022 LTC has been steadingly increasing in sats value and from the start of November it has been increasing at a much greater pace. Big caps have started to move and are generally a precursor for more volaitlity incoming into other mid to small caps. BTC can still fall so this could take the momentum out of its rise however it would descend slower and will take a while longer to reach its lows like it did in June

Nifty 50 Breakout Retest Near 18100/18000Nifty 50 Breakout - Breakout Retest Near 18100/18000
Use the dips to accumulate Nifty for Target of 19000/19500+

we are at a crossroads maybe there is hopeone mans hopium is anothers forever market. the time to start averaging into large caps may have passed. this big tech stock might lead the market higher as has happened every time pointed out here around this recent year low. the price is around sss demand which is still green, and were getting near that year low anchored vwap and the bottom of envelope. finding a higher daily low might be near even if we dont end up breaking the weekly high. sell if we break pivot, lower horizontal or resist from upper. buy if we support pivot or lower horizontal or break upper.

Booking Slips Below Nearby SupportGoing sideways since 2018, Booking.com has not gained much ground. Despite claiming a new all-time high in 2022, the RSI has shown a loss in relative strength. Its very likely that this stock sees a 60% drop in value over the next 2-3 years. Holders should look for the most suitable exit in order to avoid more losses than necessary.
(Wave analysis has been redacted from this marking however, wave-by-wave analysis will be tracked via link in bio).

simple signal moving average on largest cap is remaining sellthis is a big chunk of the market all byitself. if we look to it for broader implication we find most equity is still a sell. im not looking to long stocks right now until $TICK is far below the price again.

ACC BreakoutThe stock has broken out and retested, therefore may undergo a reversal rally. Trade is supported by Supports Nearby.
Risk Reward Ratio - 2:1
SL is placed below the support zone & the lower trendline. The target is placed near resistance.

Adani Enterprises BreakoutThe stock has broken out and retested, therefore may undergo a reversal rally. Trade is supported by Supports Nearby.
Risk Reward Ratio - 2:1
SL is placed below the support zone & the lower trendline. The target is placed near resistance.

JSW Steel BreakoutThe stock has broken out and retested, therefore may undergo a reversal rally. Trade is supported by Supports Nearby.
Risk Reward Ratio - 2:1
SL is placed below the support zone & the lower trendline. The target is placed near resistance.

CIPLA BreakoutThe stock has broken out and retested, therefore may undergo a reversal rally. Trade is supported by Supports Nearby.
Risk Reward Ratio - 2:1
SL is placed below the support zone & the lower trendline. The target is placed near resistance.

Hindalco BreakoutThe stock has broken out and retested, therefore may undergo a reversal rally. Trade is supported by Supports Nearby.
Risk Reward Ratio - 2:1
SL is placed below the support zone & the lower trendline. The target is placed near resistance.

Infosys BreakoutThe stock has broken out and retested, therefore may undergo a reversal rally. Trade is supported by brokerage calls and Supports Nearby.
Risk Reward Ratio - 2:1
SL is placed below support zone & the lower trendline. The target is placed near resistance.

Divis Labs BreakoutThe stock has broken out and retested, therefore may undergo a reversal rally. Trade is supported by brokerage calls and Supports Nearby.
Risk Reward Ratio - 2:1
SL is placed below support zone & the lower trendline. The target is placed near resistance.

TATA Consumer Products ReversalThe stock has reached lower trendline and may undergo a reversal rally. Trade is supported by brokerage calls and Supports Nearby.
Risk Reward Ratio - 2:1
SL is placed below support zone & the lower trendline. The target is placed near swing high.
This is a high risk trade as the market is in a overall bearish sentiment. Plan Trades Accordingly.

Siemens ReversalThe stock has reached lower trendline and may undergo a reversal rally. Trade is supported by brokerage calls and Supports Nearby.
Risk Reward Ratio - 2:1
SL is placed below support zone & the lower trendline. The target is placed near swing high.
This is a high risk trade as the market is in a overall bearish sentiment. Plan Trades Accordingly.

Amazon Ponzied - Made in China - Small Biz Killer*valuation matters in *rising rates environment. Go small caps!! #MSOgang
Large cap stonks & crypto Ponzi Pogs collapse.

Equal Weight Nifty ETF Movement3 shares - Reliance Industries, HDFC Bank and Infosys - weigh almost 30% of the NIFTY 50. These shares have returned anywhere between 18% and 35% in the last 3 years.
Looking at an equal weight Nifty chart can give a useful perspective about NIFTY movements.
As seen in the chart, NIFTY went nowhere for almost 6 years from April 2015. It only surpassed those April 2015 levels in January 2021. The former highs were retested in April 2021, and like a charm, the former resistance became the new support.
Get information about NFTY ETF from First Trust below.

Indecisive close for Nifty ahead of RBI announcementHere's a quick analysis of Nifty, Banknifty and the top stocks ahead of the RBI announcement amidst earnings season.

Small caps testing a critical support levelSince 2005, the IWM/SPY ratio has held this key support level 6 times. This support failed only once, in the midst of the Covid-19 pandemic. Now we find out whether the pandemic was the exception that proves the rule, or whether the pandemic structurally changed something about the relationship between small caps and large caps.
Small cap valuations look better than large caps
Check out page two of the latest Yardeni report titled "Selected P/E Ratios." They've got forward P/E charts for large caps, mid caps, and small caps, showing that forward P/E for large caps is still extended well above its historical range, whereas forward P/E for small caps has corrected sharply down back into its normal range of the last 20 years. In fact, we're well below the price multiple that small caps traded at throughout 2017.
www.yardeni.com
Large caps just touched a strong resistance level
The Nasdaq index, heavily weighted toward large-cap tech stocks like Apple and Facebook, just touched 15,000 and seemingly got rejected from that level.
Large cap tech has benefited from soaring bond prices, but bonds seem to be meeting some resistance after this month's large inflation surprises. The Fed is doing its best to support bond prices with a "jawboning" campaign, but they've got a tough row to hoe after those inflation reports.
Large cap tech also faces a bipartisan push in Congress for antitrust legislation. Facebook, Apple, Amazon, Google, and Microsoft are among the names that may be affected if such legislation goes through. Of course, Tesla is also getting some bad press from the Solar City trial. So it's possible we will see the beginning of a real Nasdaq/S&P 500 correction here.
How I'm playing it
When I say I think small caps will hold this support, I don't necessarily mean that small caps will make gains. Only that they will make relative gains. That could happen by large caps and small caps selling off together, but small caps selling off more slowly. Or it could happen by small caps trading sideways as large caps sell off. In general, small caps have made their largest gains when large caps are going up, not when large caps are going down.
So one way to play this support level is with a two-tailed bet: long small caps, short large caps. Personally I am long a few select small cap names. I like Allison Transmission because of soaring car prices, and I like the KRE regional banking ETF because bonds look like they may have hit a ceiling, and because small lending banks tend to trade inversely with bonds. To hedge my rate bet, I'm also long on small cap gold miners, which should benefit if bonds continue to go up.
(I'm also long on homebuilders KB Home and MDC Holdings, although the homebuilder sector is struggling a bit due to backlogs, labor shortages, materials costs, buyer reluctance, and rising rates on 5/1 ARMs. I love the valuations on these two stocks, but I won't be surprised if that trade continues to go against me here.)
For the large cap short, I'm trying to be a little careful, because the big tech companies' earnings are coming up. I think I may wait to see what the results are before I take that leg of the bet. It would be easy to get wiped out by a big tech earnings beat. For now I've just grabbed some UVXY shares.
As always, this is just an idea and not investing advice. Good luck!
