GBPUSD: Liquidity Grab off 1.31000CRT suggests Pound/Dollar could drop further below 1.31000, however, is there enough bearish momentum to keep it dropping? With wicks to the bottom that Liquidity Grab could experience a pullback, maybe back towards the POI it created whilst dropping.
Liquiditygrab

Smart Money Liquidity Trap Explained⭐ Smart Money Liquidity Trap Explained
✨ A deep dive into how institutions manipulate price before major moves ✨
In every financial market — Forex, Crypto, Stocks, Indices — price doesn’t simply move at random. Behind the scenes, Smart Money (institutions, banks, hedge funds) engineer setups that allow them to enter positions at the best possible price. One of their most effective tools is the Liquidity Trap.
Let’s break it down beautifully and clearly. 👇
🔥 What Is a Liquidity Trap?
A Liquidity Trap occurs when Smart Money deliberately pushes price into areas loaded with:
❌ Stop-loss orders
📉 Sell-side liquidity
📈 Buy-side liquidity
😰 Emotional retail entries
🔥 Breakout traders placing pending orders
These areas become liquidity pools — perfect fuel for institutions to fill their massive positions.
Retail traders think it’s a breakout…
But Smart Money thinks:
➡️ "Thank you for the liquidity."
🧩 How Smart Money Creates the Trap
1️⃣ Phase 1: Build the Setup
Smart Money guides price slowly toward an obvious level:
A clean high
A clean low
A trendline
A double top/bottom
Retail traders get excited:
📢 “Breakout coming!”
But institutions are simply gathering attention.
2️⃣ Phase 2: The Liquidity Grab ⚡
Price spikes violently above/below the obvious level.
This move triggers:
🟥 Stop-loss hunts
📉 Forced liquidations
💥 Breakouts that fail instantly
This sudden spike gives institutions the liquidity needed to place large buy or sell orders without causing massive slippage.
This is why the spike is often fast and dramatic.
3️⃣ Phase 3: The Real Move Begins 🚀
After the liquidity is collected, price reverses sharply.
This is the moment Smart Money actually commits to the real direction.
Retail traders feel:
🤯 “Why did it reverse?!”
😭 “I got stopped out for nothing!”
😵 “The breakout was fake!”
But Smart Money simply executed their strategy perfectly.
🎯 How to Use Liquidity Traps in Your Trading
Study where retail traders commonly place:
⛔ Stops
📌 Breakout orders
❗ Predictable entries
Then wait for the fast liquidity grab followed by:
A displacement 🎇
A sharp wick rejection
A structure shift (CHoCH / BOS)
These signals often reveal the true direction of the upcoming move.
💡 Key Features of a Smart Money Liquidity Trap
✨ Sudden spike into obvious areas
✨ Fast liquidation and stop-hunting behavior
✨ Sharp wick rejections
✨ Structure shift after the spike
✨ Smooth continuation in the real direction
🚀 Why This Concept Is So Powerful
Recognizing liquidity traps allows you to:
❌ Avoid fake breakouts
🛡️ Protect yourself from stop-hunts
🎯 Enter the market at premium/discount levels
🤝 Align with Smart Money
💼 Improve long-term consistency
This is how professional traders stay on the right side of volatility — by understanding why the market moves, not just where it moves.
Price Doesn’t Move Randomly: It Hunts Liquidity1. Introduction
Every trader starts by learning “supply and demand.”
Sounds logical: buyers push price up, sellers push it down.
But that’s not how it really works.
Price doesn’t move because of demand.
It moves toward liquidity — where orders exist.
The market’s goal is simple: find liquidity, fill it, and move on.
2. What Is Liquidity?
Liquidity is the pool of pending orders sitting on the chart — stop losses, limit orders, and resting positions.
Think of them as magnets.
Above highs: stop losses from shorts.
Below lows: stop losses from longs.
Around major levels: limit orders waiting to be filled.
Institutions and large players can’t just “market buy” or “market sell” huge positions — they need liquidity to fill them efficiently.
So, price hunts it.
3. The Game of Stop Hunts
You see it all the time:
A breakout above resistance → instant reversal.
A sweep below support → immediate bounce.
That’s not coincidence — that’s a liquidity grab.
Big players push price to trigger stop losses, collect those orders, and then reverse in the true direction.
Retail traders call it “manipulation.”
Smart traders call it “the business model.”
4. How to Read It
Stop focusing on predicting direction — start identifying where liquidity sits.
Look for:
Equal highs/lows → obvious stop clusters.
Clean levels that everyone sees → perfect trap zones.
FVGs or inefficiencies → likely rebalance points post-hunt.
Instead of asking “where will it go,” ask “who’s trapped?”
5. Takeaway
The market isn’t random. It’s strategic.
Every wick, every fake breakout, every stop hit — it all serves one purpose: to find liquidity.
Stop trying to predict the next candle.
Start understanding why the candle exists.
Price hunts liquidity — not logic.
GBP/USD - Bearish Liquidity Grab Before Bullish Reversal Price is currently trading around 1.3432 after multiple rejections from the resistance zone above. On the 15m timeframe, we can observe the following structure:
• Change of Character (ChoCH) and Break of Structure (BOS) confirm short-term bearish momentum.
• Price has broken below minor support, indicating potential continuation to the downside.
• There is a strong Order Block (OB) demand zone marked in red, which could act as the next liquidity grab area.
Expected Move:
• Price may push down into the OB zone to mitigate orders and collect liquidity.
• From there, a bullish reversal is anticipated with a target back above 1.3450, aligning with the liquidity sweep and resistance re-test.
Bias:
• Short-term bearish → looking for buy setups at OB demand zone.
• Target: retest of resistance / liquidity sweep above.

Stop Hunts: How the Market Tests Your Patience“If the market keeps taking your stop before running in your direction…
You might not be wrong — just too early.”
What is a Stop Hunt?
A Stop Hunt is when price pushes just far enough to trigger stops sitting above a high or below a low — and then reverses.
It’s not random. It’s the market collecting liquidity before the real move begins.
Why Stop Hunts Happen
Stops are easy targets — they’re predictable.
Institutions use them to fill big orders at the best prices.
Your loss is their entry.
How to Spot a Stop Hunt
Mark clear swing highs and lows — obvious levels most traders are watching.
Watch price sweep above/below those levels with a quick move.
Wait. Don’t jump in — the first move is usually a trap.
Drop to a lower timeframe (M1/M5) to get a precise entry confirmation.
Look for structure shift or ChoCH after the sweep.
Only then, consider entering — now you’re trading with the market, not against it.
Example
Refer to the Gold(XAUUSD) M15 chart above:
Notice how price took out the previous swing low with a liquidity grab from the stop area — trapping early buyers — and only then launched into a strong up move.
This is the classic stop hunt behavior that shakes out weak hands before the real trend continues.
Patience turns a losing stop into a winning entry.
The market isn’t against you — it’s just testing who can wait.
📘 Shared by @ChartIsMirror

DXY SHORTS | 9SEPT Price failed to hold above resistance — strong sign of supply in control ⚡.
Intraday structure shifting bearish below 97.400.
Minor LQC + demand point marked — a confirmed close below supports further downside.
⚡ Trade Summary:
This is a continuation play following the first trade idea. The rejection confirms bears are stepping in, aligning with higher timeframe momentum. Short positions below 97.400 remain valid, targeting 97.100.

Liquidity: The Trap That Powers the Market“The market doesn’t move to reward you.
It moves to hunt those who move without awareness.”
Every beginner asks: “Why did price stop me out before going in my direction?”
The answer is usually one word: Liquidity .
What is Liquidity?
Liquidity is simply where orders are waiting:
Buy stops above a recent high
Sell stops below a recent low
Pending orders around round numbers (like 3400, 3350 in Gold)
These areas are pools of money.
The market needs these pools to fill large institutional orders.
Why Traders Get Trapped
Price breaks above a high → retail traders buy the breakout.
Price dips below a low → retail traders sell the breakdown.
But instead of continuing, price often snaps back .
Why? Because the market just collected those stops — the liquidity it needed — before reversing.
This is why beginners often say:
“Every time I enter, the market goes the other way.”
Sweep vs Grab
Sweep = Price pushes above/below a key level to collect stops. This alone doesn’t mean reversal.
Grab = After the sweep, price rejects and shifts structure (ChoCH/BOS). This confirms intent and often leads to the true move.
Practical Example (Gold)
Suppose Gold makes a high at 3395.
Many traders place buy stops above 3395, expecting a breakout.
Price pushes to 3397 (this is the sweep ), then falls back under 3395.
If structure shifts bearish after that, it becomes a liquidity grab .
The smart entry isn’t the breakout.
It’s after the sweep, when the grab confirms direction.
Trading isn’t about being the first one in.
It’s about being the last one trapped.
Patience protects you from becoming liquidity yourself.
📘 Shared by @ChartIsMirror

EUR/USD at Critical Buying Zone | Liquidity Grab Before 1.1800?EUR/USD at Critical Buying Zone ⚡ | Liquidity Grab Before 1.1800?
Market Structure
BOS (Break of Structure):
Around late June, price broke to the upside, confirming bullish order flow.
In early August, another BOS occurred to the downside, showing a short-term bearish shift.
Current price action is consolidating within a range between 1.1600 – 1.1700, with liquidity resting on both sides.
Key Zones
Support Zone: 1.1350 – 1.1450
Strong demand area that previously initiated a bullish rally.
Buying Zone (1.1600 region):
Price is currently testing this level. Historically, this zone acted as a re-accumulation base before pushing higher.
Resistance Zone: 1.1750 – 1.1850
A supply area where sellers previously took control.
Liquidity & Fair Value Gap
FVG (Fair Value Gap): identified below resistance; this is an imbalance zone where price could revisit before any major continuation.
Liquidity (“$$$”): resting above the short-term highs near 1.1720; market may grab these buy-side stops before reversing lower.
Scenario Outlook
Bullish Case:
If price holds the Buying Zone (1.1600 support), expect liquidity sweep above 1.1720 and a push toward 1.1800–1.1850 resistance.
Bearish Case:
Failure to defend 1.1600 could trigger a deeper decline back toward 1.1400 support zone.
Bias
Currently, the chart suggests a liquidity grab and bullish continuation scenario. The drawn projection hints at a short-term sweep of lows (below 1.1600) followed by a strong rally toward resistance at 1.1800.

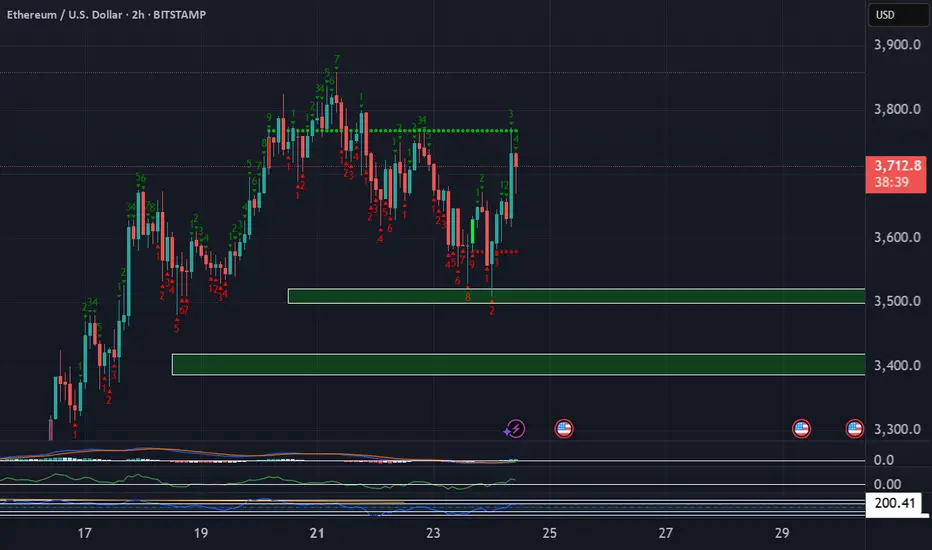
Ethereum Elliott Wave Analysis: The Bull Trap Before Wave C!As mentioned in my previous two analyses, Ethereum rejected the $4,740 high and dropped to the $4,050 support zone, where it bounced exactly as projected.
From an Elliott Wave perspective, ETH has already completed a 5-wave impulsive structure and is now inside a corrective ABC phase. At the moment, price action is developing within wave B. Historically, wave B has the tendency to break above the top of wave ⑤, creating a bull trap and sweeping liquidity before the real wave C sell-off begins.
📉 What does this mean for traders?
Wave C is usually sharp, aggressive, and offers great risk-to-reward opportunities on the short side. But instead of rushing into shorts, the smart play is to wait for confirmation.
🎯 Trading Strategy:
1. Allow wave B to complete – watch for a liquidity grab above the $4,840–$4,800 zone.
2. Look for a CHoCH (Change of Character) / market structure break on lower timeframes (4H / 1H) as your entry trigger.
3. Enter short after confirmation, targeting the $4,100 → $3,800 zones first, with potential extension lower depending on momentum of wave C.
4. Place invalidation above the recent swing high to keep risk controlled.
⚡ This is a high-probability short setup forming, but patience and timing are crucial — don’t get trapped in wave B’s fake breakout.
👉 Follow for updates as we track the confirmation of wave C and refine the short targets!

Gold Rejecting Resistance After Liquidity Grab – Bow & Arrow SetThis is a textbook liquidity grab + rejection setup.
Price executed a liquidity grab above structure, shooting into previous highs to build momentum for the drop — classic bow and arrow effect.
After sweeping stops and pulling back, price retested the nearest resistance (around 3,324–3,325), but hasn’t broken the body high — this confirms sellers are still active.
The push down was strong enough to reach the 4H support zone, and although price bounced, it looks like a temporary pullback rather than a reversal.
As long as price stays below 3,347, this short bias holds. The structure still supports downside continuation unless a clear breakout occurs.
Bias:
Bearish — expecting continuation down toward 3,312 and possibly back to test 3,307.

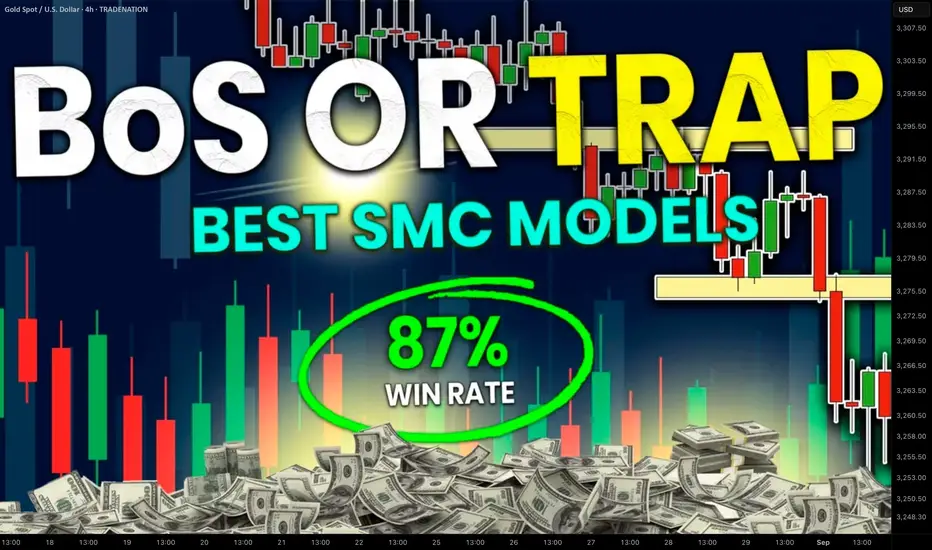
Break of Structure VS Liquidity Grab. How to Identify Valid BoS
The main problem with break of structure trading is that you can easily confuse that with a liquidity grab.
But don't worry.
There is a secret SMC price model that will help you to confirm a break of structure in a second.
Learn smart money concepts trading secrets and a simple strategy to trade break of structure on any forex pair.
Let's study a break of structure that I spotted on AUDUSD forex pair.
We see that the market is bullish on a daily time frame and the price has just violated a previous high with a break of structure.
The issue with that is the fact that such a violation can easily be a liquidity grab and a bullish trap .
Buying the market immediately after a BoS, we can incur a huge loss .
We need something that would help us to accurate validate that.
Fortunately, there is a simple price model in SMC that will help.
After you spotted a break of structure on a daily time frame,
use a 4h time frame for its validation.
After a BoS on a daily time frame, the market usually starts retracing , setting a new local high.
To confirm that it is not a trap, you will need a break of THAT structure on a 4H time frame.
It will increase the probabilities that the entire bullish movement that you see on a daily is not a manipulation.
Here is what exactly we need.
After the price violated a daily structure and closed above that, we see a minor intraday retracement on a 4h time frame.
A bullish violation of the last high there is our BoS confirmation and a clear indicator of the strength of the buyers.
You can execute a buy trade, following a simple strategy then.
Set a buy limit order on a retest of a broken high on a 4H,
a stop loss should be below the last higher low,
a take profit is based on the next supply zone on a daily.
To avoid the traps, a single time frame is not enough for profitable trading break of structure.
Learn to integrate multiple time frames in smart money concepts trading. It will help you make thousands of pips weekly.
❤️Please, support my work with like, thank you!❤️
I am part of Trade Nation's Influencer program and receive a monthly fee for using their TradingView charts in my analysis.
13.08 2025 TARGET DONEAs I was typing yesterday about my target for the BTC price I don't have to wait long for it and the price make it happen very quick and now we have a clear pattern, so are now is time to short this market?. After yesterday I see a big potential for the price to go lower but also we can go higher because we have fuel to go higher.

BTCUSD – Bearish Retracement Towards Key Liquidity Zone📊 BTCUSD – Bearish Retracement Towards Key Liquidity Zone
BTCUSD is currently trading near 116,425, showing signs of a potential bearish retracement after testing the previous resistance zone around 117,000–119,000. The chart structure highlights multiple Break of Structure (BOS) points, confirming shifts in market sentiment.
Technical Breakdown
Previous Resistance Rejection
Price failed to hold above the 117,000 mark, indicating strong selling pressure from the prior supply zone.
The rejection aligns with a liquidity grab above the recent highs, suggesting smart money distribution.
Liquidity & Fair Value Gaps
There’s a visible Liquidity/Fair Value Gap from the late July rally, which may now act as a magnet for price.
The market tends to fill these inefficiencies before deciding the next major trend move.
Target & Support Zone
The next key support and liquidity pool rests between 113,500 – 114,000, highlighted as the target zone.
This area has confluence with previous accumulation phases, making it a probable point for a bullish reaction if tested.
Volume Profile Context
Volume nodes indicate heavier trading activity below current levels, suggesting that a drop towards 114,000 could be met with increased buyer interest.
Market Outlook
Primary Bias: Short-term bearish retracement.
Immediate Target: 114,000 liquidity zone.
Invalidation: A daily close above 117,500 may shift sentiment back to bullish, opening the path toward 119,000–121,000.
Trading Insight:
Aggressive traders may look for short setups below 116,500, targeting 114,000. Conservative traders may wait for price to tap into the support/target zone for potential long opportunities with tight risk management.

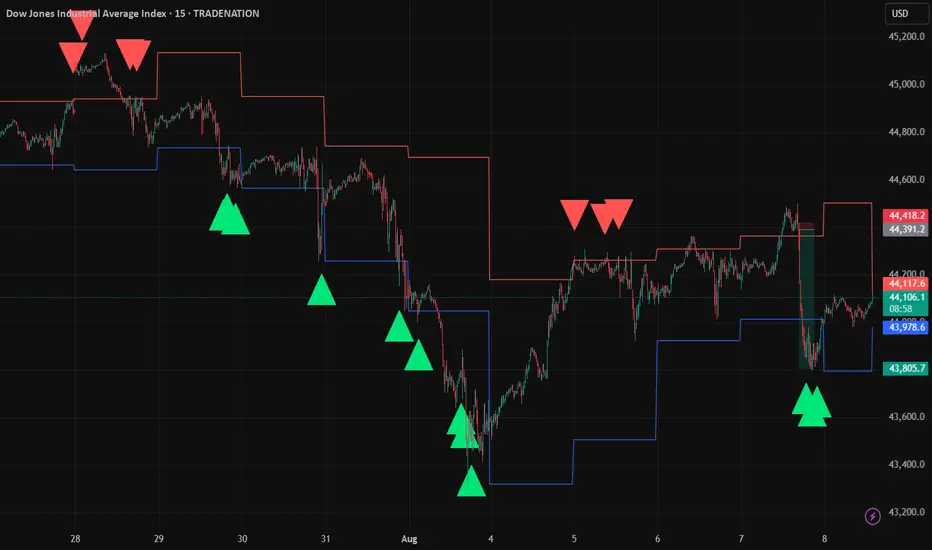
US30 Liquidity Grab Strategy – 15m Chart (1m Precision Entries)Description:
This idea showcases my Liquidity Grab Entry Signals strategy, optimized for US30.
The setup identifies daily high/low liquidity zones with a sensitivity buffer, then confirms reversals using strong engulfing candles.
Key Points:
Daily Liquidity Levels plotted automatically.
Buffer Zone detects price interaction with liquidity.
Engulfing Confirmation for higher probability entries.
Long when price rejects daily low with bullish engulfing.
Short when price rejects daily high with bearish engulfing.
While the precision entries are taken on the 1-minute chart, this 15-minute chart is shown for publication purposes in line with TradingView rules.
Example (Yesterday & Today):
Multiple clean rejections at daily liquidity zones.
Clear 1:15–1:20 R:R potential with minimal drawdown.
Risk Management:
Suggested SL: 10–15 points beyond liquidity zone.
Suggested TP: the next key level.
Precise 1 min entry shown here:
ETH/USD Analysis – Smart Money Breakdown ETH/USD Analysis – Smart Money Breakdown & Rejection from Premium Zone
🔍 Key Breakdown:
✅ BOS (Break of Structure): The initial BOS on July 15 signaled a strong bullish shift in market structure, triggering a sustained upside rally.
💪 Strong Bullish Rebound: After the BOS, ETH experienced impulsive buying, confirming institutional order flow and liquidity injection.
🔺 Resistance Zone (Premium Area): The price formed a clear TOP at the resistance (near $3,950–$4,000), a common zone where smart money distributes positions.
📉 Reaction from Resistance: As ETH tapped into the resistance, price sharply rejected — a potential mitigation move or distribution phase.
⚠️ Current Price Structure: After the correction, ETH is retracing back into the resistance zone. The projected arrow indicates a possible lower high formation, followed by a continuation to the support zone ($3,300–$3,400).
🧠 Educational Takeaways:
Structure Is King: Market structure (HHs, HLs, BOS) is the foundation of SMC-based trading.
Premium vs. Discount Zones: Smart money sells in premium (resistance) and buys in discount (support).
Liquidity Reversal: Tops often trap late buyers before a reversal — watch for liquidity grabs at key zones.
Wait for Confirmation: Always wait for confirmation (candlestick or structure shift) before entering trades.
🎯 Potential Scenarios:
✅ Bearish Case: ETH forms a lower high and drops to support (~$3,350).
❌ Invalidation: Clean breakout and hold above $4,000 could open doors for further bullish continuation.

USD/JPY Chart Analysis (Educational Breakdown)📊USD/JPY Chart Analysis (Educational Breakdown)
🗓 Date: July 28, 2025
⏰ Timeframe: 2H (2-Hour Candles)
🧠 Concepts: Liquidity | Fair Value Gap | Order Block | Structure | Support/Resistance
⸻
1. Market Structure Overview
• The pair has been bullish, making higher highs and higher lows.
• Recently, price tapped into a resistance zone (~148.40–149.00) and sharply rejected, suggesting a potential short-term reversal.
• The price may now aim to sweep liquidity below support before a possible rebound.
⸻
2. Key Levels
🟥 Resistance Zone (148.50–149.00)
• Marked by a previous supply zone where sellers stepped in aggressively.
• Current Bearish Order Block sits just below this resistance, confirming institutional interest in selling this level.
🟫 Bearish Order Block
• Last bullish candle before sharp drop acts as a bearish order block (around 148.30–148.50).
• This is a high-probability sell-side reaction area — ideal for liquidity grabs and reversals.
🟦 Fair Value Gap (FVG)
• Between mid-17th–18th July, an imbalance was left after strong bullish momentum.
• Price returned to this zone, partially filled the gap, and then dropped again — confirming its importance.
🟥 Support Zone (145.80–146.30)
• Long-standing demand area where buyers previously stepped in.
• This area aligns closely with sell-side liquidity (SSL).
⸻
3. Liquidity Zones
🔵 Buy-Side Liquidity (BSL) – Above resistance (149.00+)
• Stop-loss clusters above previous swing highs.
• Liquidity for institutional sell positions.
🟣 Sell-Side Liquidity (SSL) – Below 146.00
• Positioned right under support.
• Ideal liquidity target for smart money to trigger stop hunts and fill positions before reversing.

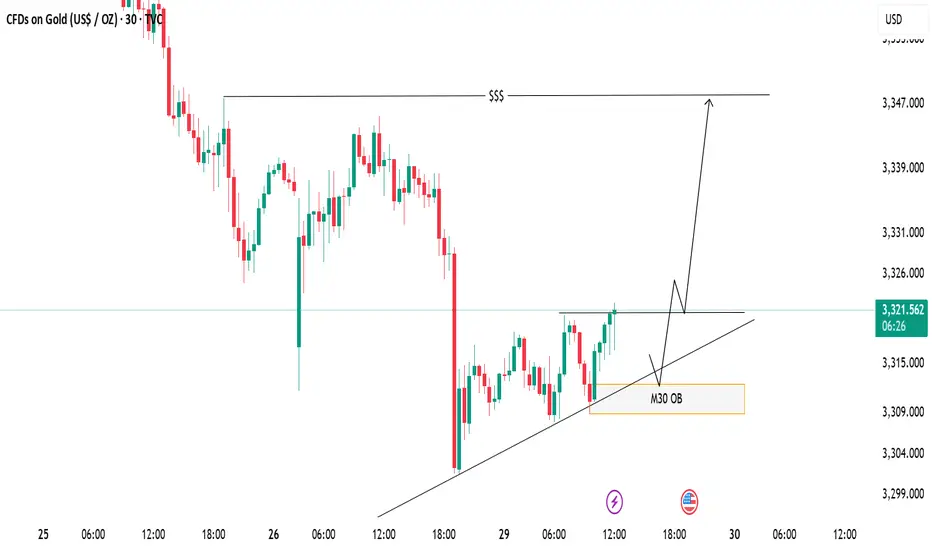
XAUUSD Eyeing Liquidity Grab – M30 OB Zone in PlayPrice is respecting the ascending trendline and consolidating near a key resistance level. A bullish breakout is expected, with a potential retest of the trendline and the M30 Order Block (OB) zone acting as a key demand area.
📈 Trade Plan:
Wait for a minor pullback into the OB and trendline confluence
Look for bullish confirmation to go long
Target the liquidity zone above (around 3347)
📌 A clean structure and bullish order flow hint at a continuation to the upside.
XAUUSD Technical Analysis – Educational Insight Key Observations:
🔴 Strong Support Zone (3,278 – 3,299 USD)
This zone has been highlighted as a key institutional level where buyers have consistently stepped in.
It aligns with previous Breaks of Structure (BOS), confirming its historical significance.
📉 Recent Price Action:
Price is retracing from the highs of around 3,439 USD and is approaching the strong support zone again.
A possible liquidity grab near the support is anticipated before a bullish reversal.
🔄 Break of Structure (BOS):
Multiple BOS marked indicate shifts in market direction and the presence of aggressive buying/selling phases.
These BOS events help identify trend continuation or reversal points.
🟢 Bullish Fair Value Gap (FVG):
A bullish FVG is present, indicating imbalance in price movement where institutions may look to fill orders.
Price previously reacted positively to this zone, indicating unfilled demand.
📈 Target Area:
A clearly marked target at 3,440.487 USD, which aligns with Buy-Side Liquidity, suggests a potential liquidity run.
This implies smart money may drive price upwards after collecting liquidity below support.
Volume Profile (VRVP):
The horizontal volume bars show the highest traded volume areas, providing confirmation for key support zones and BOS reactions.
🧠 Educational Insights:
BOS (Break of Structure) is used by institutional traders to spot shifts in trend. It typically signals continuation or reversal when aligned with liquidity concepts.
Liquidity Zones (like buy-side or sell-side liquidity) often serve as magnets for price; smart money aims to trigger orders and trap retail traders.
Fair Value Gaps represent imbalances where price moved too fast; institutions may return to these zones to execute pending orders.
Volume Profile Analysis helps in understanding where the most buying/selling occurred—confirming support and resistance zones.
📌 Strategy Suggestion (For Learning Only):
Entry Idea: Wait for price to tap the strong support (ideally sweep liquidity slightly below).
Confirmation: Look for bullish engulfing or BOS on lower timeframe to confirm reversal.
Target: 3,440 area where buy-side liquidity resides.
Stop Loss: Below the strong support (near 3,270 level) to protect against deeper liquidity grabs.
📢 Disclaimer (Educational Use Only):
This analysis is for educational purposes and not financial advice. Trading involves significant risk; always do your own research or consult a financial advisor.

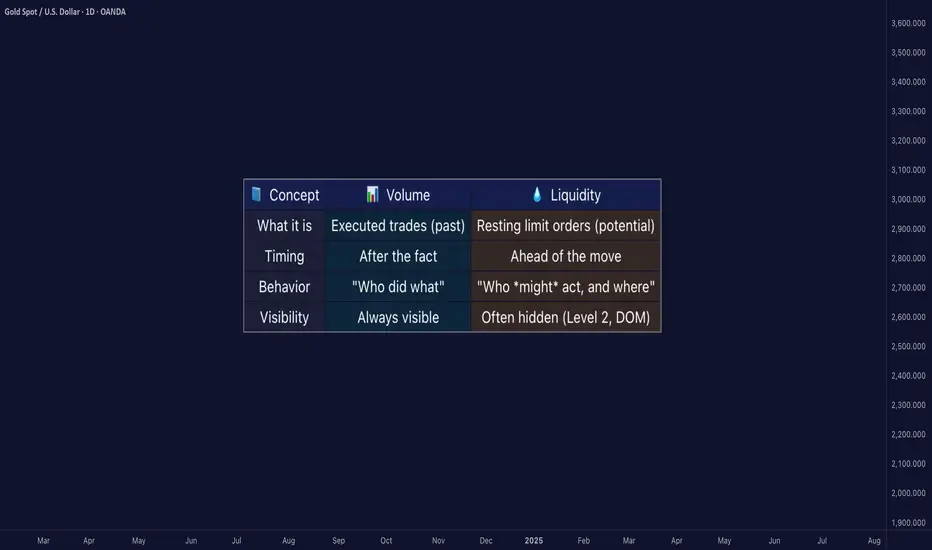
Liquidity ≠ Volume: The Truth Most Traders Never Learn█ Liquidity ≠ Volume: The Truth Most Traders Never Learn
Most traders obsess over volume bars, but volume is the footprint, not the path forward.
If you’ve ever seen price explode with no volume or fail despite strong volume, you’ve witnessed liquidity in action.
█ Here’s what you need to know
⚪ Volume Is Reactive — Liquidity Is Predictive
Volume tells you what happened.
Liquidity tells you what can happen.
█ Scenario 1: Price Jumps on Low Volume
❝ A price can jump on low volume if no liquidity exists above.❞
⚪ What’s happening?
The order book is thin above the current price (i.e., few or no sellers).
Even a small market buy order clears out available asks and pushes price up multiple levels.
Volume is low, but the impact is high because there’s no resistance.
⚪ Implication:
This is called a liquidity vacuum.
It can happen before news, during rebalancing, before session openings, on illiquid instruments, or during off-hours.
Traders often overestimate the strength of the move because they only see the candle, not the absence of offers behind it.
█ Scenario 2: Move Fails on High Volume
❝ A move can fail on high volume if it runs into a wall of offers or bids.❞
⚪ What’s happening?
There’s a strong surge of aggressive buying or selling (high volume).
But the order book has deep liquidity at that level — large resting limit orders.
The aggressive traders can’t chew through the liquidity wall, and price stalls or reverses.
⚪ Implication:
This is called liquidity absorption.
Market makers or institutions may intentionally absorb flow to stop a breakout.
Many retail traders mistake this for “fakeouts,” but it’s really liquidity defending a level.
⚪ What the Research Says
Cont, Stoikov, Talreja (2014): Price responds more to order book imbalance than trade volume.
Bouchaud et al. (2009): Liquidity gaps, not trade size, are what truly move markets.
Hasbrouck (1991): Trades only impact price if they consume liquidity.
Institutions don’t chase candles — they model depth, imbalance, and liquidity resilience.
⚪ Where the Alpha Lives
Liquidity tells you where the market is weak, strong, or vulnerable — before price moves.
Fakeouts happen in thin books.
Reversals occur at hidden walls of liquidity.
Breakouts sustain when liquidity follows the price, not pulls away.
If you understand this, you can:
Enter before volume shows up
Avoid chasing dead breakouts
Fade failed moves into empty space
█ Final Truth
Volume is the echo. Liquidity is the terrain. Alpha is in reading the terrain. You want to study the structure, because price moves toward weakness and away from strength. Learn to see where liquidity is, or where it’s missing, and you’ll see trading with new eyes.
-----------------
Disclaimer
The content provided in my scripts, indicators, ideas, algorithms, and systems is for educational and informational purposes only. It does not constitute financial advice, investment recommendations, or a solicitation to buy or sell any financial instruments. I will not accept liability for any loss or damage, including without limitation any loss of profit, which may arise directly or indirectly from the use of or reliance on such information.
All investments involve risk, and the past performance of a security, industry, sector, market, financial product, trading strategy, backtest, or individual's trading does not guarantee future results or returns. Investors are fully responsible for any investment decisions they make. Such decisions should be based solely on an evaluation of their financial circumstances, investment objectives, risk tolerance, and liquidity needs.
Ethereum Long These zones are significant because they represent areas where large institutions and professional traders are likely to be active, potentially causing strong price movements when those orders are triggered. We want to enter trades that have minimal drawdown to maximize our buying power.
GOLD Rejected from Reversal Zone – Retest + Bounced & Major High📌 1. Major High & Liquidity Grab
The chart starts by showing a strong impulsive move toward the upside that taps into a Major High zone (highlighted at the top). This is a classic MMC "liquidity grab" where price sweeps the previous high to trigger stop losses and collect orders before reversing. This is a common trap zone where retail traders get caught in FOMO buys.
📌 2. Reversal Area Identified
The price entered a clearly marked Reversal Area between $3,430 – $3,445. This zone acted as:
Historical supply area
Psychological resistance
Liquidity hunt zone
Upon entry, strong rejection candles formed, signaling institutional sell pressure. This reaction aligns with MMC principles where reversal is expected post-liquidity collection from major highs.
📌 3. Parabolic Curve Formation – Bullish Impulse
A beautifully formed parabolic curve (Black Mind Curve) supported the bullish rally from around $3,310 up toward the high. This shows accumulation → breakout → expansion. However, the curve has now been broken, suggesting that bullish momentum is weakening.
⚠️ This break of curve support is critical — it often leads to a corrective phase or a deeper retracement.
📌 4. Mini Reversal Zone + SR Interchange Zone
Price has now pulled back to a very important area: the Mini Reversal Zone + SR Flip Zone around $3,400. This zone previously acted as resistance and now has the potential to act as support (classic SR interchange).
According to MMC concepts:
If this zone holds → we may see a bullish bounce and potential re-test of the upper reversal area.
If this zone breaks → bears will likely push price toward the next demand level around $3,350 – $3,340.
This is the decision point — a “battlefield” zone where market direction can be decided.
📌 5. Potential Scenarios Ahead:
✅ Bullish Scenario:
Price respects the SR zone ($3,400)
Forms bullish engulfing / continuation pattern
Likely target: re-test of reversal zone ($3,430–$3,445)
Beyond that: breakout possible if volume supports it
❌ Bearish Scenario:
Price breaks below $3,395 with strong bearish candles
Could confirm the rejection from the major high and trigger a full retracement
Downside targets: $3,360 → $3,340 range
🔑 Final Thoughts:
This GOLD setup is a perfect case of MMC theory in action — liquidity grab at the top, rejection at reversal zone, curve break, and now testing critical SR flip area.
Keep an eye on:
Candlestick behavior at the SR zone
Volume confirmation
Momentum indicators (if using)
Wait for confirmation before jumping in — let the market reveal its hand at the decision zone.

Smart Money Concepts in Action: XAUUSD Tests Strong Resistance Market Context and Structure
On the 1-hour chart, XAUUSD (Gold) has been in a bullish market structure, forming consecutive Breaks of Structure (BOS)—a clear sign of buying pressure and upward momentum. These BOS points mark moments when the market forms new highs, confirming bullish continuation.
However, as price approaches the 3370–3380 zone, it reaches a well-defined resistance/supply area. This zone has previously rejected price and can be viewed as a region where institutional selling may occur.
🧠 Smart Money and Liquidity Concepts
From a Smart Money Concepts (SMC) perspective, price often moves to areas of liquidity—zones where buy stops (above highs) or sell stops (below lows) are collected. In this chart:
Price pushes up towards 3370, potentially grabbing liquidity above recent highs.
This move could be a liquidity sweep, where the market fakes a breakout to trap retail traders before reversing.
Such behavior often occurs near institutional zones, suggesting a possible distribution phase—where large players offload positions before a move in the opposite direction.
⚙️ Resistance Analysis: Why 3370 Matters
The 3370–3380 area has acted as a ceiling in the past.
Price is currently reacting near this level, showing early signs of rejection.
This zone aligns with previous order blocks, where institutions may have placed sell orders.
In educational terms, this shows how supply zones can act as natural turning points in a market, especially when price approaches them after an extended move.
📦 Support & Potential Downside
If a reversal happens from this resistance, the next key support zone lies between 3300–3320. This level has historically acted as demand and could be revisited for price rebalancing or order filling.
📝 Educational Summary
This XAUUSD chart provides a great learning opportunity in observing:
How Break of Structure (BOS) confirms trend direction.
The role of liquidity zones in trapping retail traders.
How smart money operates around key levels like 3370.
The importance of combining structure, zones, and reaction for confluence.

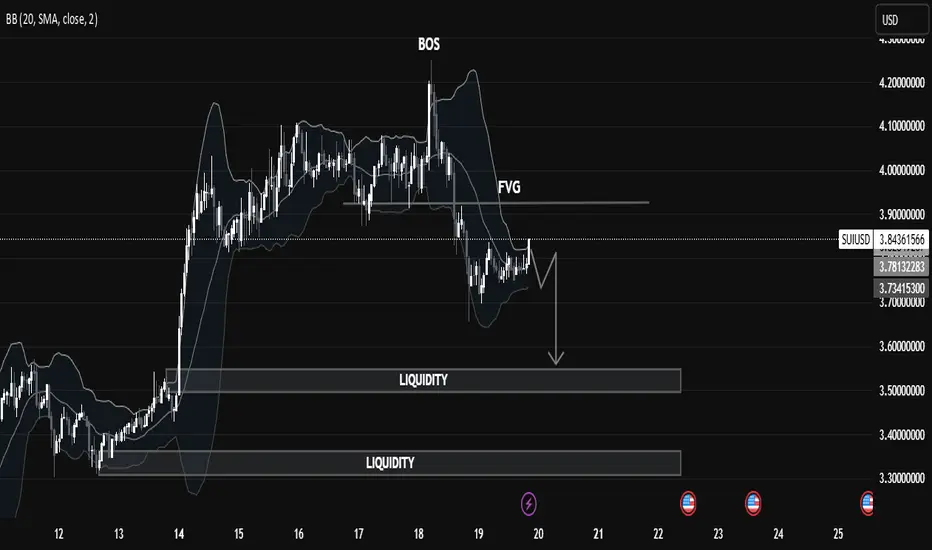
SUIUSD Liquidity Trap in Motion: Price Targeting Deeper Pools🧠 Market Structure Insight (SMC Framework)
🔍 1. Break of Structure (BOS):
The most recent BOS around the $3.95 level marked a bull trap, indicating a transition from bullish momentum to a distribution phase. This suggests institutional players offloaded liquidity at premium prices before initiating a markdown.
🕳️ 2. FVG (Fair Value Gap):
A visible Fair Value Gap (Imbalance) remains unmitigated above the current price action. This zone acted as a supply area, where price sharply moved down, leaving inefficiency in its trail—now serving as a potential point of rejection if revisited.
📌 Liquidity Zones:
Upper Liquidity Cleared: Price has swept highs before reversal (a sign of engineered liquidity grab).
Double Liquidity Pools Below:
First pool: Around $3.55 - $3.60
Second pool: Deep liquidity around $3.30 - $3.35
These levels are highly attractive for Smart Money to target next, suggesting continuation to the downside.
📉 Current Price Behavior:
Market is consolidating in a tight range just below FVG, signaling potential re-accumulation of sell orders.
The chart pattern suggests a potential lower high forming, likely to precede a bearish leg towards liquidity zones.
Bollinger Bands show compression, hinting at volatility expansion soon.
🎯 Trade Outlook (Not Financial Advice):
🔻 Bearish Bias:
Unless price breaks above the FVG zone with strong bullish momentum, the probability favors a bearish continuation targeting:
1st Target: ~$3.55
2nd Target (Deeper liquidity grab): ~$3.30
A rejection from FVG followed by a BOS to the downside would serve as confirmation for this bias.
📚 Educational Takeaway:
This chart is a clean illustration of Smart Money Concepts in play:
BOS > FVG > Liquidity Sweep
Price respects institutional footprints: grab liquidity, fill imbalances, then drive toward untouched liquidity zones.
Recognize market intent through structure shifts and imbalance reaction.