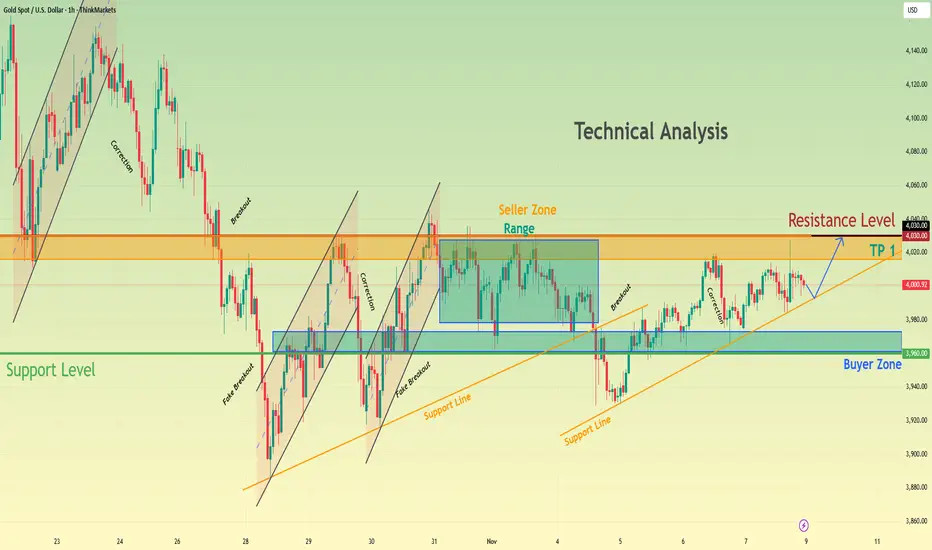
XAUUSD Holds Buyer Zone — Potential Recovery Toward $4,030Hello traders, I’d like to share my view on Gold (XAUUSD). The market has been holding a constructive bullish structure, developing higher lows along the rising Support Line. Each time price approached this trendline, buyers reacted strongly, confirming persistent demand. Meanwhile, the $3,960–$3,980 Buyer Zone has acted as a key accumulation area, where several fake breakouts occurred, but price quickly returned back above support — indicating seller failure and liquidity sweeps before bullish continuation. On the upper side, we have a clear Resistance Level and Seller Zone near $4,020–$4,040, where the market previously consolidated inside a range. Multiple rejections were seen in this zone, suggesting that sellers are active here and this remains the next significant reaction area for price. Recently, Gold has been gradually moving upward from the buyer zone, forming a steady corrective climb inside the current structure. At this stage, the trend remains bullish while price stays above the ascending Support Line and Buyer Zone. The immediate objective for buyers is a retest of the $4,020–$4,030 Resistance Level, where price may react again based on previous market behavior. A confirmed breakout above this zone would open the way for further continuation, while rejection could lead to another pullback into the support structure. Please share this idea with your friends and click Boost 🚀
Long!!!!
LINK LONG — FROM MATH TO MARKET STRUCTURE: An Extensive AnalysisTraders,
In my latest BINANCE:LINKUSDT analysis I started my thesis with " I BELIEVE THE CRYPTO MARKET IS SETTING UP FOR A BIG, BIG, BIG DUMP! NOT JUST LINK! "
It wasn’t coincidence that I wrote those words in caps lock. The market was whispering louder than usual: not in price, but in data. Every metric pulsed in rhythm, like the heartbeat of a system about to release its tension. The numbers weren’t random; they were poetry in motion, quietly syncing toward one inevitable point. Sometimes, data doesn’t just inform — it sings. And when it does, your fingertips start typing before your mind even realizes what the melody means.
Now we’re back — same chart, same logic, but a different side of the market.
I’m going to analyze it the same way I did before — step by step, math-backed, structure-based, and logic-driven.
Only this time, it’s even more extensive.
For free. For nothing. So that you, the people who actually care to learn, can start to see how markets truly work. How they breathe, trap, rotate, rebalance — and how every candle hides intent.
I believe the BINANCE:LINKUSDT dump might be over — for now, at least — and that the market is slowly starting to build upward momentum. This post is not a quick “looks bullish” statement. It’s a structured walkthrough from mathematical foundation to market structure, liquidity, and order flow, showing why the $20–$21 region might become the next key target before a rotation lower.
Let’s go step by step.
Step 1 – Is There a Mathematical Reason to Say the Current Auction Might Be Finished?
By “auction,” I mean the move from a clear swing high to a clear swing low where sellers were in control. Markets move in auctions — from high to low, then pull back, then extend again. To determine whether a sell auction is finished, we measure how far it has retraced and extended.
After the 10 Oct liquidation event, price printed a clean new high — more valid than the liquidation spike. That’s point A (~20.15). From there, it sold off to point B (~15.70).
So our first auction is:
A → B | Direction: Down
Step 2 – Measuring the Retrace
Since the move was downward, I drew a Fibonacci retracement from A to B (high → low). nThat gives us retracement levels above price on TradingView.
Price retraced almost perfectly to the 0.786 level (~19.23) — not shallow (0.382 or 0.5), not extreme (0.886), but deep enough to classify as a “normal” yet decisive retrace.
That means sellers regained control after a 0.786 pullback, a key ratio in the Fibonacci family.
Step 3 – What Does a 0.786 Retrace Usually Lead To?
Here’s where the Fibonacci logic becomes meaningful. The 0.786 level is derived from the square root of the golden ratio inverse: √(1/φ). Its natural mirror on the other side of price is √(φ), or 1.272.
That’s why 0.786 retraces often project toward 1.272 extensions — the two are mathematically linked. Beyond that, the next probable extensions are 1.414 and 1.618.
So, for a 0.786 retrace, the Fibonacci extension ladder is:
Primary: 1.272
Intermediate: 1.414
Extended: 1.618
Step 4 – Did BINANCE:LINKUSDT Reach One of These Fibonacci Targets?
To check that, we reverse the Fibonacci — draw it from B to A (low → high). That prints the extension levels below the swing low.
Price hit the 1.414 extension almost perfectly before structure began shifting:
Lower lows stopped forming
Higher lows began to appear
Small higher highs emerged on lower timeframes
That’s a structural sign the sellers exhausted their leg — a textbook confirmation that the 1.414 zone completed the auction.
Step 5 – Confirming the Auction
The A → B auction retraced to 0.786, extended to 1.414, and then reversed in structure. This matches the Fibonacci expectation for a completed wave.
If the retrace had been 0.886 instead, we’d likely expect continuation to 1.618 — but since it was 0.786, the 1.414 tap followed by reversal fits perfectly.
✅ 0.786 retrace → 1.272 / 1.414 / 1.618 extension
✅ 1.414 tapped → structure reversed
We can reasonably call this auction finished.
Step 6 – Confluence from the Smaller ABC Swing
After the main leg, the market made a small rally and a lower high — point C. Using the Fibonacci Extension tool (A → B → C), we project this smaller swing.
Interestingly, the ABC projection lands exactly on the same 1.414 zone as the larger A → B measurement. That’s two independent Fibonacci constructions converging on the same price.
From a math perspective, this isn’t coincidence — both patterns use the same ratio family.
It’s proportion — the geometry folding back onto itself.
Nature’s Geometry on a Price Chart
This is where Fibonacci goes beyond numbers. The same proportions that define growth patterns in seashells, tree branches, sunflowers, hurricanes, and galaxies are present in the market’s structure.
Two distinct swings produce the same 1.414 target.That’s natural proportion — mathematical harmony showing up in price behaviour.
It’s not random. It’s geometry repeating itself.
Part 2 – The Structural Context: Liquidity and Value
We’ve identified our Potential Reversal Zone (PRZ) using Fibonacci confluence. Now let’s look inside the structure and the market’s underlying “memory.”
We’ll answer three questions:
Where does liquidity sit — which levels might the market hunt next?
What is the order flow showing — is there absorption or continuation?
What do the next extensions project mathematically?
1. Liquidity via TPO (Market Profile)
TPO (Time Price Opportunity) shows how much time price spent at each level. Clusters = acceptance and value. Gaps = imbalance and rejection.
Around $19.00, during TPO periods G, H, N, and O, price built acceptance but didn’t explore higher. That created a weak high — a level that often acts as a magnet for future liquidity hunts.
Another, slightly weaker high sits near $20.00, which is still unfinished.
And as James Bond said, “I never leave loose ends.” Neither does the market.
2. Anchored VWAP Confluence
Anchoring VWAP from the major swing high shows the blue AVWAP aligning almost perfectly with that $20.00 region. That gives strong confluence between volume-weighted value, liquidity, and structure.
3. Low Volume Nodes (LVNs) and Imbalance
Using the Fixed Range Volume Profile (FRVP) from A → B reveals clear low-volume zones — “air pockets” where price moved too fast to build volume.
Between $20.00 and $20.50, there’s a notable LVN, meaning price skipped over it during the selloff.Such zones often act as magnets — the market tends to revisit them to rebalance unfinished business.
Now we have three layers of confluence:
Weak high at $19.00–$20.00
Anchored VWAP aligning with $20.00
LVN pocket at $20.00–$20.50
That defines a clear liquidity and target zone.
Structure and Confluence Summary
PRZ established through Fibonacci symmetry
Structure showing higher lows and early accumulation
Confluence cluster between $20.00 and $20.50, combining:
Weak highs
Low-volume node
Anchored VWAP
Market Profile imbalance
The setup aligns across math, volume, and structure.
Part 4 – Order Flow: What Lies Beneath the Candles
From the outside, price action looks calm — clean candles, defined Fibonacci levels, and structure that seems perfectly balanced. But the real story is hidden underneath, inside the Order Flow.
Every candle represents a battle — between aggression and absorption, buyers and sellers, liquidity and imbalance. Understanding who is winning that battle tells us whether a move is genuine strength or a trap waiting to unwind.
Order Flow allows us to look beneath the surface and see where transactions are actually happening — where volume clusters, where buyers are absorbed, and where sellers are defending. It’s the market’s heartbeat.
The Current Picture
Here’s what we see right now on BINANCE:LINKUSDT :
CVD (Cumulative Volume Delta) — across both spot and futures (stablecoin- and coin-margined contracts) — is making lower highs, showing persistent sell aggression.
Yet price itself is not breaking down. Instead, it’s holding steady and even forming higher lows.
Meanwhile, the A/D (Accumulation/Distribution) line is rising, indicating that despite heavy selling pressure, buyers continue to absorb and accumulate.
That means one thing:
aggressive sellers are being absorbed by large passive buyers quietly taking the other side.
Recognizing the Setup
Let’s break down the pattern:
CVD ↓ → sustained sell aggression
OI ↑ → new short positions entering the market
Price ↔ or ↑ slightly → absorption and accumulation taking place
When these three align:
It often signals a short trap forming.
Sellers feel in control because CVD shows selling dominance.
In reality, their aggression is being absorbed by larger passive buyers.
Once that liquidity runs out and buyers stop absorbing, shorts are trapped.
Those trapped shorts must cover — triggering a fast, aggressive short squeeze upward.
Also: CVD on Stablecoin Margined Contracts remains flat while Stablecoin Margined Open Interest rises — showing aggressive shorting being absorbed by larger buyers. Price stability suggests accumulation, not weakness. Since OI stays high, those shorts are still in the game, meaning their positions haven’t been closed yet. If price starts to move up, they’ll be forced to cover — setting up the conditions for a short squeeze.
Absorption in Context
Absorption isn’t random — it’s the footprint of strong hands quietly taking in sell pressure without letting price break down. While most see weakness, they’re actually witnessing controlled accumulation.
Here, price holds steady as CVD trends flat and OI stays high — meaning aggressive shorts are still in the game, being absorbed by larger buyers. Every new short adds fuel to the spring.
When that pressure releases, it doesn’t drift — it snaps. Shorts are forced to cover, triggering a sharp, emotional squeeze toward the next liquidity zone around $20–$20.50, where Fibonacci confluence and a weak high align.
This is where microstructure meets the macro picture — absorption building the base for a violent move higher.
Part 5 – Fibonacci Extension Confirmation
To justify the $20–$21 target mathematically, we apply one more Fibonacci extension —
from the last swing low to the recent high, projected forward.
The 1.618 extension aligns almost perfectly around $20.00, adding strong mathematical confluence to our previously defined liquidity and structure zone.
That makes $20.00–$20.50 a textbook target cluster — a Fibonacci, liquidity, and volume alignment.
Final Outlook – The Path Ahead
Based on all the combined data:
Fibonacci structure shows completion and new expansion potential
Market Profile and VWAP reveal unfinished business around $20–$20.50
Order Flow confirms absorption and hidden accumulation
The 1.618 Fibonacci projection reinforces this level as a natural mathematical destination
I believe the market will squeeze upward toward $20–$21, taking out the weak high and the LVN pocket — and once that liquidity is collected, rotate back down to restore balance.
The setup is mathematically justified, structurally valid, and order-flow supported — a complete picture of how Fibonacci geometry, structure, and liquidity align to reveal where the next phase of this auction may unfold.
If price slips lower instead, the key level to watch is $12.90 — the latest 1.618 extension from the initial wave we measured earlier. That remains the deep liquidity and structural boundary where balance could be restored.
Last words.
Everything we have mapped — Fibonacci structure, confluence, liquidity, and absorption — means nothing without the psychology behind it. The market is not just math and candles; it is a mirror of collective emotion. Every trapped short, every breakout chase, every hesitation is human behaviour written in numbers.
When confidence is at its peak, risk is usually greatest.
When fear dominates, opportunity hides in plain sight.
That is why sentiment often reaches its extreme just before reversals. Most traders only see what is already visible, not what is quietly building beneath the surface.
So next time you scroll through social media or read the news about what everyone expects, remind yourself of this:
When everyone sees the same breakout, the trade was over hours ago.
And the markets whisper long before they speak.
From the depths of the sands,
ThetaNomad
------------------------------------
If you enjoy this kind of analysis, leave a like and drop a comment. I don’t ask for anything — I just want to help more people learn to look behind the charts, to see the story that price and volume quietly write together.

SPY: Forecast & Trading Plan
The analysis of the SPY chart clearly shows us that the pair is finally about to go up due to the rising pressure from the buyers.
❤️ Please, support our work with like & comment! ❤️

NATGAS Set To Grow! BUY!
My dear friends,
Please, find my technical outlook for NATGAS below:
The price is coiling around a solid key level - 4.324
Bias - Bullish
Technical Indicators: Pivot Points Low anticipates a potential price reversal.
Super trend shows a clear buy, giving a perfect indicators' convergence.
Goal - 4.368
Safe Stop Loss - 4.295
About Used Indicators:
The pivot point itself is simply the average of the high, low and closing prices from the previous trading day.
Disclosure: I am part of Trade Nation's Influencer program and receive a monthly fee for using their TradingView charts in my analysis.
———————————
WISH YOU ALL LUCK

QQQ Will Explode! BUY!
My dear followers,
This is my opinion on the QQQ next move:
The asset is approaching an important pivot point 609.75
Bias - Bullish
Technical Indicators: Supper Trend generates a clear long signal while Pivot Point HL is currently determining the overall Bullish trend of the market.
Goal - 622.40
About Used Indicators:
For more efficient signals, super-trend is used in combination with other indicators like Pivot Points.
Disclosure: I am part of Trade Nation's Influencer program and receive a monthly fee for using their TradingView charts in my analysis.
———————————
WISH YOU ALL LUCK

APPLE The Target Is UP! BUY!
My dear friends,
My technical analysis for APPLE is below:
The market is trading on 268.53 pivot level.
Bias - Bullish
Technical Indicators: Both Super Trend & Pivot HL indicate a highly probable Bullish continuation.
Target - 271.24
Recommended Stop Loss - 266.96
About Used Indicators:
A pivot point is a technical analysis indicator, or calculations, used to determine the overall trend of the market over different time frames.
Disclosure: I am part of Trade Nation's Influencer program and receive a monthly fee for using their TradingView charts in my analysis.
———————————
WISH YOU ALL LUCK

EURUSD Will Go Up! Long!
Here is our detailed technical review for EURUSD.
Time Frame: 12h
Current Trend: Bullish
Sentiment: Oversold (based on 7-period RSI)
Forecast: Bullish
The market is on a crucial zone of demand 1.156.
The oversold market condition in a combination with key structure gives us a relatively strong bullish signal with goal 1.169 level.
P.S
Overbought describes a period of time where there has been a significant and consistent upward move in price over a period of time without much pullback.
Like and subscribe and comment my ideas if you enjoy them!

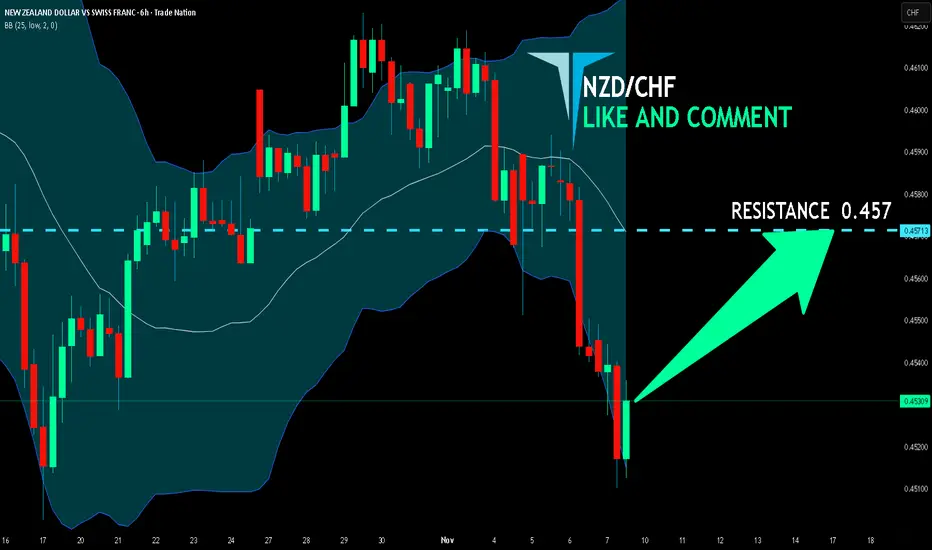
NZD/CHF BULLS ARE STRONG HERE|LONG
Hello, Friends!
NZD/CHF pair is in the uptrend because previous week’s candle is green, while the price is obviously falling on the 6H timeframe. And after the retest of the support line below I believe we will see a move up towards the target above at 0.457 because the pair is oversold due to its proximity to the lower BB band and a bullish correction is likely.
Disclosure: I am part of Trade Nation's Influencer program and receive a monthly fee for using their TradingView charts in my analysis.
✅LIKE AND COMMENT MY IDEAS✅
EURUSD: Bulls Aim for Recovery Toward 1.1580 ResistanceHello everyone, here is my breakdown of the current Euro setup.
Market Analysis
EURUSD has recently shown signs of recovery after bouncing from the key 1.1480–1.1500 Support Zone, which aligns with the lower boundary of the Support Structure highlighted on the chart. This area has acted as a strong Buyer Zone multiple times in the past, and once again, price reacted with a clear bullish impulse, indicating active accumulation from buyers.
Recently, before the rebound, EURUSD was moving inside a Downward Channel, with several fake breakouts that illustrated weakening bearish pressure and lack of continuation from sellers. Eventually, price broke above the downward resistance line, signaling a structural shift away from bearish momentum. Following the breakout, EURUSD began forming higher highs and higher lows, confirming the start of a short-term bullish structure. The pair is now trading above the breakout area and approaching the 1.1580 Resistance Zone, which previously acted as a strong Sell Zone and pivot level. If buyers maintain control above the Support Zone, the bullish scenario remains favorable, suggesting a continued recovery move.
My Scenario & Strategy
From my perspective, as long as EURUSD holds above the 1.1480–1.1500 Support Zone, the bullish setup remains valid. I expect price to continue moving upward toward the 1.1580 Resistance Level as the next key target. A confirmed breakout and hold above 1.1580 would likely open the path for further bullish continuation, potentially targeting 1.1650 and beyond in the medium term.
However, if EURUSD fails to hold above 1.1480 and breaks back below support, this would invalidate the bullish structure and could send price towards lower levels before any new recovery attempt develops. For now, the structure favors buyers, and I will be looking for pullback-based long entries while price remains above support.
That's the setup I'm tracking. Thank you for your attention, and always manage your risk.

XAUUSD: Buyers Target $4,080 Resistance ZoneHello everyone, here is my breakdown of the current Gold setup.
Market Analysis
Gold (XAUUSD) has recently formed a constructive bullish structure after rebounding from the 3,930–3,960 Buyer Zone, which aligns with the lower boundary of the Upward Channel. This demand zone has consistently acted as a strong accumulation area, indicating that buyers are actively defending it. Prior to this rebound, price moved within a Downward Channel, where several fake breakouts occurred — showing that sellers were gradually losing momentum and failing to maintain downside pressure.
Currently, a breakout from the Downward Channel shifted the market tone, and since then, XAUUSD has started forming higher lows, signaling an early trend reversal. The price is now trading back inside a new Upward Channel, and the structure suggests buyers are preparing for a continuation move. At the moment, XAUUSD is approaching the mid-range of the channel, while the next major resistance sits near 4,130, which previously acted as a supply level and point of distribution.
My Scenario & Strategy
The current setup suggests that as long as price remains above the 3,930–3,960 demand region, the bullish setup remains intact. I expect Gold to continue moving gradually toward the 4,080–4,130 resistance zone in the short term. A confirmed breakout above 4,130 would likely signal strong bullish continuation, opening the way for a larger upward move toward 4,200 and beyond.
However, if XAUUSD breaks back below 3,930, the bullish structure would be invalidated, and price could revisit deeper support levels before attempting another upward leg. For now, I prefer to look for long entries on pullbacks within the channel, targeting a continuation toward the resistance levels mentioned above.
That's the setup I'm tracking. Thank you for your attention, and always manage your risk.

QQQ: Bulls Will Push Higher
Looking at the chart of QQQ right now we are seeing some interesting price action on the lower timeframes. Thus a local move up seems to be quite likely.
Disclosure: I am part of Trade Nation's Influencer program and receive a monthly fee for using their TradingView charts in my analysis.
❤️ Please, support our work with like & comment! ❤️

TESLA Sellers In Panic! BUY!
My dear subscribers,
My technical analysis for TESLA is below:
The price is coiling around a solid key level - 429.39
Bias - Bullish
Technical Indicators: Pivot Points Low anticipates a potential price reversal.
Super trend shows a clear buy, giving a perfect indicators' convergence.
Goal - 446.44
About Used Indicators:
By the very nature of the supertrend indicator, it offers firm support and resistance levels for traders to enter and exit trades. Additionally, it also provides signals for setting stop losses
Disclosure: I am part of Trade Nation's Influencer program and receive a monthly fee for using their TradingView charts in my analysis.
———————————
WISH YOU ALL LUCK

EURCHF: Long Trading Opportunity
EURCHF
- Classic bullish formation
- Our team expects pullback
SUGGESTED TRADE:
Swing Trade
Long EURCHF
Entry - 0.9315
Sl - 0.9312
Tp - 0.9321
Our Risk - 1%
Start protection of your profits from lower levels
Disclosure: I am part of Trade Nation's Influencer program and receive a monthly fee for using their TradingView charts in my analysis.
❤️ Please, support our work with like & comment! ❤️

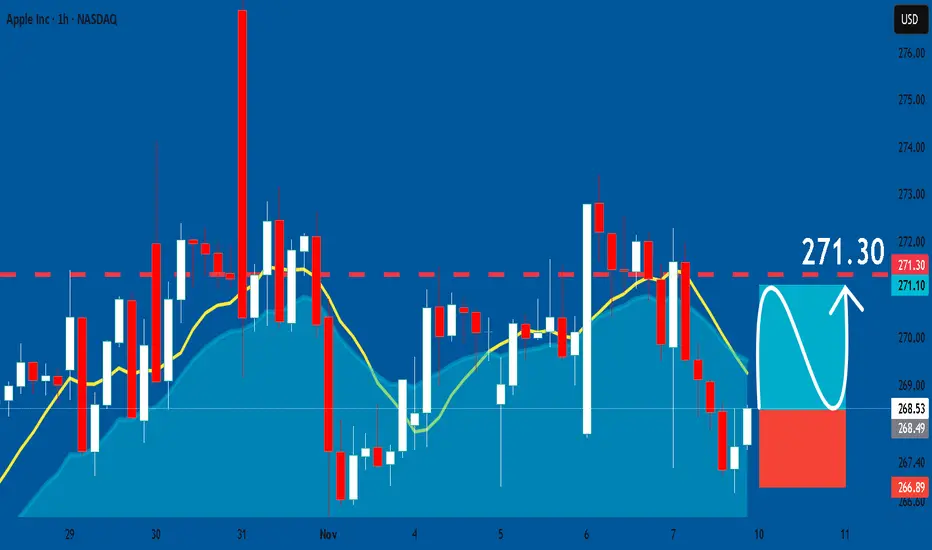
APPLE: Long Trade Explained
APPLE
- Classic bullish pattern
- Our team expects retracement
SUGGESTED TRADE:
Swing Trade
Buy APPLE
Entry - 268.53
Stop - 266.89
Take - 271.30
Our Risk - 1%
Start protection of your profits from lower levels
Disclosure: I am part of Trade Nation's Influencer program and receive a monthly fee for using their TradingView charts in my analysis.
❤️ Please, support
EURCAD Sellers In Panic! BUY!
My dear subscribers,
EURCAD looks like it will make a good move, and here are the details:
The market is trading on 1.6246 pivot level.
Bias - Bullish
My Stop Loss - 1.6231
Technical Indicators: Both Super Trend & Pivot HL indicate a highly probable Bullish continuation.
Target - 1.6272
About Used Indicators:
The average true range (ATR) plays an important role in 'Supertrend' as the indicator uses ATR to calculate its value. The ATR indicator signals the degree of price volatility.
Disclosure: I am part of Trade Nation's Influencer program and receive a monthly fee for using their TradingView charts in my analysis.
———————————
WISH YOU ALL LUCK

SPY Massive Long! BUY!
My dear followers,
I analysed this chart on SPY and concluded the following:
The market is trading on 670.89 pivot level.
Bias - Bullish
Technical Indicators: Both Super Trend & Pivot HL indicate a highly probable Bullish continuation.
Target - 678.65
About Used Indicators:
A super-trend indicator is plotted on either above or below the closing price to signal a buy or sell. The indicator changes color, based on whether or not you should be buying. If the super-trend indicator moves below the closing price, the indicator turns green, and it signals an entry point or points to buy.
Disclosure: I am part of Trade Nation's Influencer program and receive a monthly fee for using their TradingView charts in my analysis.
———————————
WISH YOU ALL LUCK

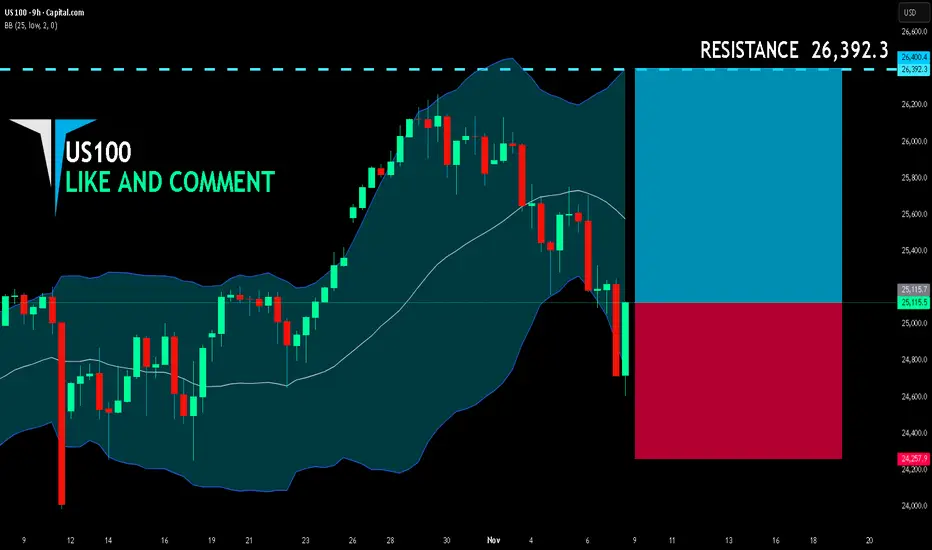
US100 LONG FROM SUPPORT
US100 SIGNAL
Trade Direction: long
Entry Level: 25,115.7
Target Level: 26,392.3
Stop Loss: 24,257.9
RISK PROFILE
Risk level: medium
Suggested risk: 1%
Timeframe: 9h
Disclosure: I am part of Trade Nation's Influencer program and receive a monthly fee for using their TradingView charts in my analysis.
✅LIKE AND COMMENT MY IDEAS✅
GBPUSD Is Bullish! Long!
Please, check our technical outlook for GBPUSD.
Time Frame: 9h
Current Trend: Bullish
Sentiment: Oversold (based on 7-period RSI)
Forecast: Bullish
The market is trading around a solid horizontal structure 1.316.
The above observations make me that the market will inevitably achieve 1.329 level.
P.S
The term oversold refers to a condition where an asset has traded lower in price and has the potential for a price bounce.
Overbought refers to market scenarios where the instrument is traded considerably higher than its fair value. Overvaluation is caused by market sentiments when there is positive news.
Like and subscribe and comment my ideas if you enjoy them!

USDCAD Is Very Bullish! Buy!
Here is our detailed technical review for USDCAD.
Time Frame: 1h
Current Trend: Bullish
Sentiment: Oversold (based on 7-period RSI)
Forecast: Bullish
The market is testing a major horizontal structure 1.404.
Taking into consideration the structure & trend analysis, I believe that the market will reach 1.407 level soon.
P.S
We determine oversold/overbought condition with RSI indicator.
When it drops below 30 - the market is considered to be oversold.
When it bounces above 70 - the market is considered to be overbought.
Like and subscribe and comment my ideas if you enjoy them!

USDJPY Eyes 153.000 Support as Hawkish Fed Keeps Dollar Bid!Hey Traders,
In the coming week, we’re monitoring USDJPY for a buying opportunity around the 153.000 zone. The pair remains in a clear uptrend and is currently in a correction phase, approaching a key support and resistance area at 153.000.
Fundamentally, the Fed’s recent hawkish tone emphasizing stronger than expected labor data and pushing back against December rate cut bets continues to support USD strength, keeping upward pressure on the pair.
A sustained reaction at 153.000 could signal the next leg higher.
Trade safe,
Joe.

NZDCHF: Bulls Will Push
Remember that we can not, and should not impose our will on the market but rather listen to its whims and make profit by following it. And thus shall be done today on the NZDCHF pair which is likely to be pushed up by the bulls so we will buy!
Disclosure: I am part of Trade Nation's Influencer program and receive a monthly fee for using their TradingView charts in my analysis.
❤️ Please, support our work with like & comment! ❤️

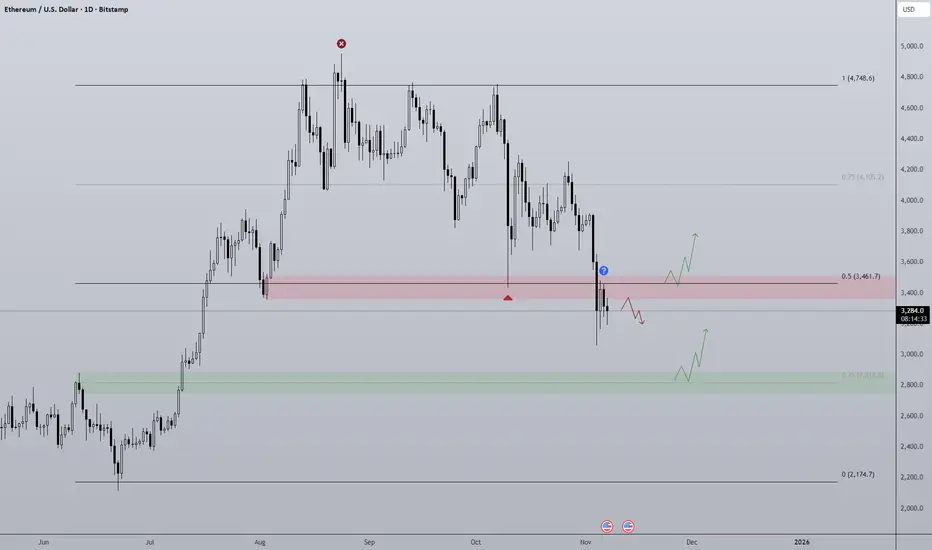
ETH Losing Range Midpoint? Similarly to Bitcoin, Ethereum finds itself around the midpoint of the high time frame range, only ETH has already lost the level and has rejected when retesting. Such a lack of strength is concerning for the project as well as the broader altcoin market.
So there are a few actionable moves I'm looking out for:
Bullish scenario is we maybe chop for a while around/under the midpoint then with high volume the midpoint gets flipped with conviction. That would open the door for the top half of the range to be accessible again. I think this scenario relies on the US Government shutdown coming to an end and QT also ending. Right now there just isn't the liquidity needed to prop up prices hence the slow bleed.
Bearish scenario is a simple continuation of the local bearish trend where 0.25 ($2,800) is the target. This area signaled the break in structure responsible for the previous rally and so I believe it will provide support but is also the target for the bears to reach.
USDCAD Technical Analysis! BUY!
My dear friends,
Please, find my technical outlook for USDCAD below:
The instrument tests an important psychological level 1.4071
Bias - Bullish
Technical Indicators: Supper Trend gives a precise Bullish signal, while Pivot Point HL predicts price changes and potential reversals in the market.
Target - 1.4090
Recommended Stop Loss - 1.4054
About Used Indicators:
Super-trend indicator is more useful in trending markets where there are clear uptrends and downtrends in price.
Disclosure: I am part of Trade Nation's Influencer program and receive a monthly fee for using their TradingView charts in my analysis.
———————————
WISH YOU ALL LUCK
