LULU WEEKLY ANALYSIS# **LULU (Lululemon Athletica) | Weekly ConfluX Analysis**
## **Executive Summary**
LULU has completed a higher-timeframe **External Sell-Side Liquidity (EX-1) sweep** into a major Weekly Discount Order Block. Price is showing early signs of institutional accumulation after a prolonged markdown, with multiple overhead liquidity pools offering significant upside potential.
**Bias:** **Bullish** ⭐⭐⭐⭐⭐ (**9.2/10**)
---
## **Market Narrative**
* ✅ External Sell-Side Liquidity (EX-1) successful
Lululong
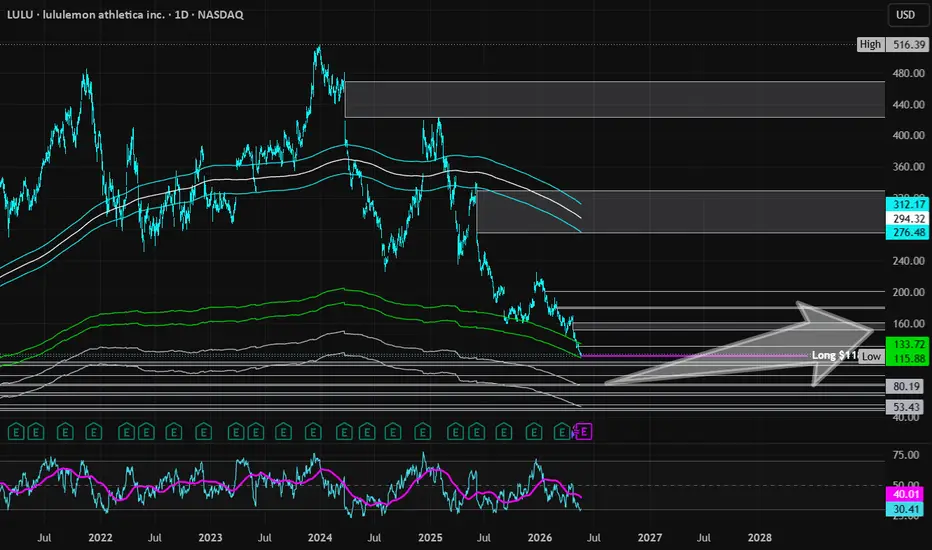
Lululemon | LULU | Long at $118.50TECHNICAL ANALYSIS
Lululemon NASDAQ:LULU touched the bottom of my selected "crash" simple moving average (green lines). As predicted from my original entry / exit , the stock isn't super strong during these economic times. I still think this is the case. I would not be surprised if the upcoming earnings call drops the stock to $50-$80 and closes out many of the looming open price gaps on the daily chart. At that level, it will have entered my "major crash" simple moving average area (gray
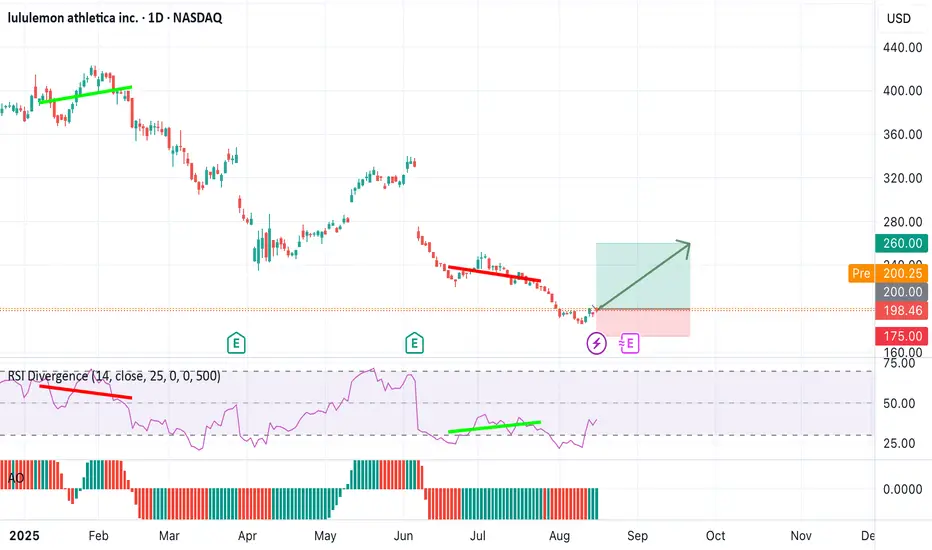
LULU Pt. 2 EXPLOSION SETUPLululemon is showing a strong confluence of improving technicals and solid fundamentals.
The chart is printing bullish divergence on both the weekly and monthly timeframes, suggesting that downside momentum is fading and a higher timeframe reversal could be developing. From a valuation standpoint, the stock is trading around ~12.25 TTM, which looks attractive relative to its historical growth and premium brand positioning. Financially, the company continues to perform with revenue over ~$9B, gr
LULU HOLIDAY LONGLULU has been falling hard in the past few months/weeks, down to support from March 2020 at $160~
With support from the bottom of the channel on this downtrend also meeting the support from over 5 years ago we see a confluence of support.
Also with a rising MACD and a rising RSI showing signs of volume and interest at this HUGE support line, I see an approximate 15%-35% return on investment.
The Financials on LULU also look very good with a P/E of 11.62 and little debt sitting at $1.76B. I fi
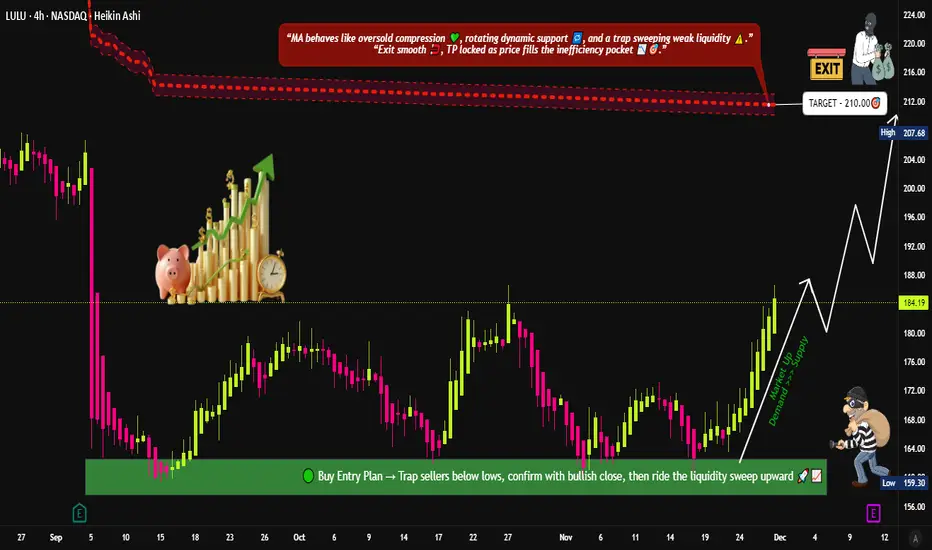
LULU Market Structure Update: Bullish Scenario and Trade Plan📈 LULU Bullish “Layered Thief Strategy” Playbook — Swing Trade Setup 😎🛍️
🧵 Asset:
LULU — Lululemon Athletica Inc. (NASDAQ)
🎯 Trade Plan:
Bias: Bullish 📈💪
This setup focuses on a multi-layered limit order structure (“Thief Strategy”) to optimize entries during pullbacks and liquidity dips — fully aligned with TradingView’s house rules.
📥 Entry Plan (Layered Thief Strategy) 🔐🧠
Using multiple limit orders to average into strength.
This method is simply a layering technique, safe for TradingView
LULU Bullish Reversal Alert, +43% Upside Potential on the Table?Hey Realistic Traders!
With the Fed cutting rates, investors rotated out of overpriced AI stocks and into value names. Lululemon stands out after a sharp sell-off compressed valuations to historically attractive levels, and we now turn to technical analysis to see whether price action confirms the bullish case.
Technical Analysis
On the daily chart, NASDAQ:LULU has been trading consistently below the EMA200, reflecting a broader bearish trend. However, a breakout from a wide symmetrical t
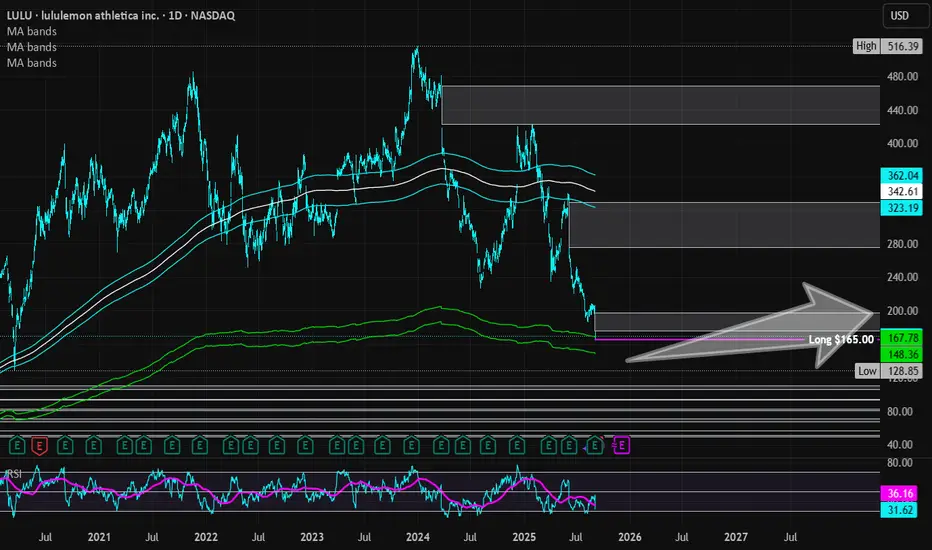
Lululemon Athletica | LULU | Long at $165.00Lululemon $NASDAQ:LULU. If you don't think the US is in a recession, examine most retail stocks right now. But this doesn't mean doom and gloom are here from a US government/news narrative - in fact, the complete opposite. AI and tech are solely propping up the US stock market ... but pay no attention to the issues behind the curtain! Once interest rates start dropping, trading and investing are going to get wild before the cracks open up.
Okay, off my soap box...
NASDAQ:LULU entered by "cra
LULU HOLIDAY LONGLULU has been falling hard in the past few months/weeks, down to support from March 2020 at $160~
With support from the bottom of the channel on this downtrend also meeting the support from over 5 years ago we see a confluence of support.
Also with a rising MACD and a rising RSI showing signs of volume and interest at this HUGE support line, I see an approximate 15%-35% return on investment.
The Financials on LULU also look very good with a P/E of 11.62 and little debt sitting at $1.76B. I fi
LLong
LULU Earnings Alert: Big Beat Potential! 208Call Plays
🚀 **LULU Earnings Trade Setup (2025-09-04)** 🚀
**Market Bias:** **Moderate Bullish** 📈
**Confidence:** 72% ✅
**Trade Idea:**
🎯 **Instrument:** LULU
🔀 **Direction:** LONG CALL
💵 **Strike:** \$208.00
📅 **Expiry:** 2025-09-05 (Weekly)
💰 **Entry Price:** \$12.10
📈 **Profit Target:** \$36.30 (200%+ return)
🛑 **Stop Loss:** \$6.05 (50% of premium)
📏 **Size:** 1 contract
⏰ **Entry Timing:** Pre-earnings close (AMC on 2025-09-04)
**Rationale:**
* Strong fundamental beat history: 100% last 8 quarte
Breaking: Lululemon Shares Dip 12.80% In Friday's Premarket lululemon athletica inc., (NASDAQ: NASDAQ:LULU ) together with its subsidiaries, designs, distributes, and retails technical athletic apparel, footwear, and accessories for women and men under the lululemon brand in the United States, Canada, Mexico, China Mainland, Hong Kong, Taiwan, Macau, and internationally saw it's shares tanked nearly 15% in Friday's premarket trading after reporting earnings and revenue beats for its fourth-quarter earnings on Thursday.
Lululemon beat Wall Street expect
Lululemon ($LULU) Slides After Q2 Earnings; Key Levels to WatchLululemon Athletica Inc. (NASDAQ: NASDAQ:LULU ) experienced a sharp pullback early Friday despite posting better-than-expected earnings in Q2. The activewear giant’s outlook and revenue missed analysts' expectations, fueling investor concern.
Fundamental Analysis
Lululemon (NASDAQ: NASDAQ:LULU ) reported Q2 earnings of $3.15 per share, a 17.5% increase year-over-year, surpassing the FactSet consensus estimate of $2.93 per share. Revenue rose 7% to $2.37 billion but fell short of the expected
LULU breakout level!LULU is squeezing on multiple time frames and is getting ready to fire. We are also in a wolf wave pattern with a price target of 350.70 (green dotted line). Today, it formed a doji after a full body candle on the previous day which signals a bullish uptrend ahead of its earnings. We might see LULU get into the earnings run soon!
Looking for this wolf wave to pan out in the next couple weeks. If you're planning on getting into this option trade, I'd go 2-3 weeks out. I'll update this as we go.
LULU -- waiting for pullback to enter longI like LULU, and so does all the gym goers and yoga goers especially if COVID restrictions start to loosen up over the next month or two approaching spring and summer.
Long term I like LULU long, but for now, I'm going to be patient and wait for a slight pullback to a better demand buying level. If we can get a pullback A B C pattern back to the 350's, I'll look to enter long a month or two out with some call debit spreads. If the pullback comes, I'll watch for the trend support line to hold,
Lululemon (LULU): The Channel of the Yoga Apparel IndustryIf you like this analysis, please make sure to like the post, and follow for more quality content!
I would also appreciate it if you could leave a comment below with some original insight.
In this post, I will be providing an in-depth analysis on Lulu Lemon Atheletica Inc. (LULU), by going over its business model, financials, and technicals as well.
What is Lululemon Athletica Inc. (LULU)?
Lululemon is a company that provides technical athletic apparel for yoga, running, training and most o
LULU - 8.49% Potential Profit - Ascending TriangleClear uptrend Support with an Ascending Triangle formed within.
Target price set at a new potential resistance line.
I suggest entering with a Buy Limit order. If limit is not triggered, I wouldn't chase the run.
- Historical uptrend
- RSI + Stoch well above 50
- MACD above Signal.
Suggested Entry $332.94
Suggested Stop Loss $326.66
Target price $361.20
Note that I tend to adjust stop losses in order to secure profits early and preserve capital. This means that the target price is going to
Lulu long Here is an easy ta for Lulu long:
As you can see easly- Lulu in up-trend. Stock had high volume compared with strong move to 325 § mark, bounced off and since that consolation.
We have support on 284 $ Mark (S1) and resistance on 325 $ mark (S2). You can identify this as a consolation zone, so next step should be a clear break through ATH.
Indicators:
BB: Are close after big movement, cosolation, next move could be strong, neutral signal
20 SMA: Trend is moving above, bullish signal
50 SMA
LULUWill watch LULU tomorrow and see what kind of action happens. Think if it holds this demand it currently is in, which aligns with .32 fib retrace, possibly a good opportunity to grab some calls for the upside for wave “c.”
If current demand fails, will wait for it to drift down to next level demand. If gaps up in the overnight, like this market seemingly likes to do both up and down, will see what price does if it shoots to the upside price target / supply zone around the $215 area.