ETH: Macro Accumulation And Levels I’m WatchingHere are the indicators and levels I use for macro accumulation, and how I combine them to decide when risk/reward starts to favor buying not trading, not guessing bottoms, but long-term positioning.
1️⃣ $2150 — 0.5 Fibonacci Level
The $2150 zone aligns with the 0.5 Fibonacci retracement of the larger move.
Why this matters:
* The 0.5 fib often acts as a psychological midpoint
* In previous cycles, this level frequently acted as:
- a reaction zone
- a pause before continuation
- or the first area where long-term buyers step in
I don’t treat this as a guaranteed bottom but it’s a first macro accumulation interest zone, especially if other conditions align.
2️⃣ $1400 — 2018 Top + April 2025 Rejection
The $1400 zone is structurally much stronger.
It represents:
* the 2018 cycle top (former resistance → potential support)
* a clear rejection area in April 2025, confirming it as a key market memory level
Markets tend to respect old highs and lows because:
* long-term participants anchor to them
* they often become zones of high liquidity
* they attract both defensive buyers and late sellers
3️⃣ RSI Below 30 — Macro Oversold
Historically, RSI below 30 on higher timeframes has marked:
* periods of extreme pessimism
* forced selling
* long-term opportunity, not comfort
Important:
* RSI < 30 does not mean price must reverse immediately
* it signals risk asymmetry starting to favor buyers
4️⃣ Below the Weekly 200 Moving Average
The Weekly 200 MA is one of the most important cycle filters.
In past bear markets:
* price often trades below the Weekly 200 MA
* true macro bottoms usually form after this condition is met
Being below it doesn’t mean cheap”by default but it confirms bear-market territory, which is where long-term accumulation historically makes sense.
5️⃣ Below the Monthly 100 Moving Average
The Monthly 100 MA adds a higher-timeframe confirmation.
When price is: below the Monthly 100 MA, it signals
* long-term trend damage
* compressed expectations
* reduced speculative excess
This combination has historically aligned with multi-year accumulation zones, not local pullbacks.
6️⃣ USDT.D Above 7%
Stablecoin dominance is a risk-off indicator.
When USDT.D is above ~7%:
* capital is parked on the sidelines
* fear is elevated
* risk appetite is suppressed
Macro accumulation tends to work best when:
* fear is high
* liquidity is defensive
* sentiment is negative
If this framework is useful, let me know if you’d like to see similar macro accumulation analysis for other assets.
Happy to break down additional charts using the same approach.
Macro

EUR/USD - Fundamental / Tech & 1W/1M Macro OutlookFX:EURUSD
The EU economy might be in a coma, but EUR/USD is finally trying to pull out of a long-term bear trend. Technically, we’ve seen a breakout of key levels following a bull flag, so this week is all about confirmation or rejection. Below is my macro and technical analysis, along with a specific game plan
Fundamentals:
- before taking the technical picture under loop, it’s important to break down EUR/USD from the fundamental and macroeconomic side. Local dollar strengthening might cause a short-term drop in the euro, but it won’t be the force that pushes the price south globally
- the Eurozone has been in economic stagnation for quite a while now because production is slowly weakening due to a lack of resources, high energy prices, and high spending on non-productive sectors
- at the same time, the Eurozone is very wealthy, and the resource deficit can be offset by increased imports. To make imports more profitable, the national currency must be strong (so you can buy more goods for one unit of currency), while for more profitable exports, a weak currency is better (you get more money for one unit of goods)
- this is why the resource-rich US has a weak dollar and increases its exports, while resource-poor but cash-rich Europe increases imports and has weak exports because it can’t produce much
- for this same reason, the European Central Bank made no changes to the interest rate last week (if the rate goes down, loans become more profitable for companies, which stimulates the economy by helping production; if the rate goes up, loans become less attractive and production drops) while saying inflation might even decrease (but probably no signs of possible deflation)
- an interesting fact is that in Jan. 2026, the EU signed a truly massive trade deal with India (a country rich in resources and labor), specifically on simplified customs duties for many goods (excluding agricultural products and a few others)
- looking at this through the lens of assumptions, the EU market could be flooded with resources and goods they desperately need, and this increase in domestic resources in EU could lead to a ramp-up in production volumes, potentially boosting industrial earnings, household income, and overall GDP
- as a matter of a fact at the same time the India's market will get a major boost to its economy and production, whereas allowing to significantly increase its GDP over the next few years, and we can also see that the probability of the Indian Rupee rising definitely increases
- of course, there are opposing views and news—for example, Macron recently said the euro is too expensive and needs to be cheaper. Locally this can be the case, but globally today this is far from beneficial for Europe, so in my opinion this kind of news is more like media noise rather than the most probable outcome
Technicals:
- since Oct. 2022, the price reversed after hitting major lows and in Feb. 2025 it confirmed the start of a new medium-term bullish trend, finally breaking out of the long-term descending channel that has been in place since 2008
- during the last week of Jan. 2026, there was an attempt to break a multi-year resistance level of "medium strength" (originating from 1998), which resulted in a false breakout. Why "medium strength"? Historically, the price tends to perform a fakeout here, followed by a technical retracement to the 0.236 Fibonacci level (and rarely a deeper correction towards 0.382), before eventually resuming momentum for a full breakout
- a local correction in DXY towards 98.70 (approx. +1.12% from the current 97.60) could proportionally lead to a local EUR/USD weakening toward the 1.16910 area
- this price target coincides with a mirror support/ressistance level formed in Aug. 2017 and later confirmed in Mar. 2021 and Oct. 2021
- a strong weekly bar has left an imbalance within the {1.16984, 1.17655} range, making this a point of Interest (POI) for further liquidity hunt
- looking at the monthly chart on the screenshot below, the price is testing the upper boundary of a descending consolidation channel for the third time. This is looks like forming a bull flag pattern, which historically signals local accumulation before a further move to the upside
- 1. optimal scenario: 1.16912 is the primary target with a risk-reward ratio of 1:3.65 with taking partial profits (at 45% level of the untouched order zone) at 1.1733, in case HFTs or market makers decide to leave some liquidity untapped for a later move
- 2. optimistic scenario: should sell-side pressure prevail in the local context, the price may test the long-term support level at 1.16400
- 3. pessimistic scenario: conversely, if the price fails to break resistance and consolidate above 1.19050, we could see a move south toward 1.13960 to sweep liquidity below the 1.14680 support. However, this move would take significant time to materialize and should only be considered if the price fails to hold above 1.16400
- local short scenario invalidated if 2 bars close above 1.18780
- higher probability of global long continuation if 2 bars close above 1.19400 ( increased risk if entry at 1.19100 )
Conclusion:
- the Euro has recently broken out of a multi-year downtrend and is currently sitting at the upper boundaries of both a descending consolidation channel and a local ascending channel
- this trade is focused on a retest of the {1.16984, 1.17655} range to clear liquidity before any attempt to test the major resistance at 1.19050
- risk management constraints do not allow for a stop-loss at 1.19420 (the price level which, if held above, would confirm the continuation of the medium-term bullish move)
- the basis for this local short is a combination of the local technical setup, the macroeconomic backdrop, and the currency correlation with the DXY
- higher probability of global long continuation if 2 bars close above 1.19400 (increased risk if 1.19100)
- higher probability of global short continuation if 2 bars close below 1.16100 (increased risk if 1.16750)
- last but not least: always keep the "Black Swan" in mind and stay critical. The EU economy is still in a very fragile state, and the points mentioned above are merely attempts to resuscitate it from an economic coma. Unexpected events can always shift market sentiment overnight, rendering any technical or fundamental analysis useless. Use your head and always weigh the probabilities of different outcomes and their consequences
# - - - - -
Local Short Scenario:
⚠️ Short/Swing-term Signal - Sell ⬇️
✅ Entry Point - 1.1842
🛑 SL - 1.18860
🤑 Partial TP 50% - 1.1749
🤑 Final TP 100% - 1.1692
⚙️ Risk/Reward - 1 : 3.68 👌
⌛️ Timeframe - 3 weeks 🗓
# - - - - -
If price consolidates at 1.19 - 1.195:
⚠️ Long-term Signal - Buy ⬆️
✅ Entry Point - 1.19100
🛑 SL - 1.18170
🤑 TP - 1.22370
⚙️ Risk/Reward - 1 : 2.15 👌
⌛️ Timeframe - 3 months 🗓
# - - - - -
Good Luck! ☺️
# - - - - -
DISCLAIMER: Not financial advice. Everyone must make trading decisions at their own risk, guided only by their own criteria and strategy for opening or not opening a trade

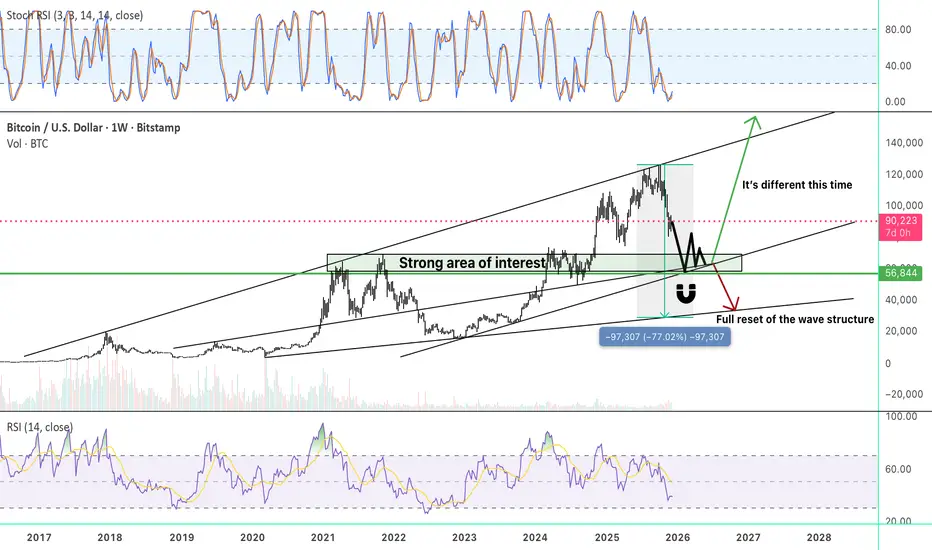
Signal v. Noise: The Power of the Macro Structure | BTC Edition As shown similarly in my macro chart of CRYPTOCAP:XRP , we again see similar macro trend lines that do matter.
While I do feel that were absolutely well into a bear market, these trend lines combined with the truncated nature this cycle and the cycle prior leave me curious of a larger shockwave at play stemming back from the 2017 market cycle top. “Will this cycle be different” is the big question we will soon have to confront. Depending on how these confluences interact will strengthen the probability of which direction the market will trend, and analyzation of how these confluences react to one another must not be taken lightly.
Since 2017, the charts might be telling us to not get too comfortable and that in this new paradigm of institutional backed digital beans, we may want to tread lightly and be increasingly vigilant to not fall into the similar rut that prior cycle timeframes have foretold.
I hope this chart helps you. None of this is financial advice, and best of luck with your current and future trades!
LONG TSM: Great point to GO LONG with low risk.TSM is aligned with the current macro and it's part of a sector that won't be heavily affected by inflation. It's main driver is AI and TECH, sectors that are resilient in crisis and sky rocket with tailwind.
For this trade, I'm going long at the open of next candle, the previous current bar already have what I need, including the volume above the 20 SMA of the volume. I'm closing only when a candle closes under the 50 EMA.
My risk for this trade is 2% of portfolio and the initial stop is at the previous swing low.

USD Index | Rising Channel BreakdownThe recent USD bounce unfolded within a clearly defined rising channel, but that structure has now been broken to the downside. This suggests the counter-trend move is likely complete, with attention shifting back to the underlying support zone.
From a technical perspective, price has decisively slipped below the lower boundary of the channel, which changes the short-term bias. The highlighted support area below now becomes the primary area of interest, as it represents both prior demand and the origin of the most recent impulsive move higher.
The primary scenario is that price continues to gravitate towards this support zone, where some form of stabilisation or reaction would be reasonable to monitor. As long as price remains below the former channel base, the upside looks more corrective rather than impulsive.
That said, it’s also worth acknowledging that the downside move is becoming increasingly extended on momentum. If support does not hold cleanly, an alternative interpretation is that price may be carving out a broader rising channel, with the recent break acting as a reset rather than a full trend shift.
For now, the key focus is the support zone below. How price behaves there should help clarify whether this is continuation lower, or the early stages of a larger corrective structure taking shape.

SPY Structure Update (Daily)SPY experienced a structural reset during the February–April drawdown, followed by a clear trend shift. Since that transition, price has maintained a steady upward trajectory, with all key EMAs remaining in healthy alignment well above the 200 EMA.
Short-term and intermediate EMAs continue to support price, confirming that the broader trend structure remains intact rather than corrective.
Momentum & Participation
RSI: Holding near the neutral 50 level, reflecting balanced conditions with a slight upward bias rather than exhaustion.
On-Balance Volume (OBV): Showing early improvement, suggesting participation remains constructive and supportive of trend continuation.
Summary:
Trend structure remains healthy on the daily timeframe. Momentum is stable, participation is supportive, and no structural degradation is present at this time. This remains a structural read of current conditions, not a prediction.

Gold Futures: A Sharp Drop in Open Interest After Extreme MovesGold futures have seen very violent price action recently. After an exceptional 2025 — with prices nearly doubling — gold is now trading roughly 10% below its all-time high.
While price alone looks dramatic, the more important signal right now comes from Open Interest.
Open Interest is collapsing — and that matters
As shown in the chart, open interest has dropped sharply, reaching some of the lowest levels seen in the last few years. This decline happened during a period of elevated volatility and fast price moves.
A falling open interest tells us that:
Existing positions are being closed, not replaced
Leverage is being reduced
The move is driven more by liquidation than by new directional conviction
This is a key distinction. When price moves lower with rising open interest, it usually signals growing bearish positioning. Here, we see the opposite: participation is shrinking, not expanding.
What this usually implies
Historically, strong price moves combined with falling open interest tend to mark:
The end of an impulsive phase
A transition into consolidation or re-pricing
Reduced trend-following edge in the short term
In other words, the market is clearing positions and searching for a new equilibrium, rather than committing to a new directional trend.
Bottom line
The recent move in gold looks less like a structural trend reversal and more like a deleveraging event.
Until open interest stabilizes and volatility cools, gold futures are more likely in a transition regime than in a clean trending environment.
This analysis is for educational purposes only. It does not constitute investment or trading advice.

Bitcoin Structure Update (Daily)Bitcoin remains in a bearish structural regime on the daily timeframe.
Price continues to trade below the 200 EMA, with the 10, 20, and 50 EMAs all positioned beneath it. Shorter-term EMAs (10 & 20) maintain downward curvature, indicating that downside pressure remains unresolved and trend structure has not yet repaired.
Momentum & Participation
RSI: Downside pressure remains elevated, but momentum is beginning to decelerate following the most recent daily close. RSI is still deeply stretched and remains below key recovery thresholds, signaling early stabilization rather than confirmation.
Rate of Change (ROC): The pace of the decline is slowing, suggesting downside momentum is no longer accelerating. However, ROC remains negative, indicating that pressure has eased but has not yet transitioned into a positive regime.
Summary
Structure remains bearish. Momentum is showing early signs of deceleration, but no confirmed reversal or structural reclaim is present at this time. This remains a structural assessment of current conditions, not a prediction.

1h TF - Long on Dow Jones Industrial Average Index (Ticker DJI)TVC:DJI
Technicals:
Having the price consolidated between 48800 and 49600 during January, trade picture strongly depend on market sentiment and event occurence.
- Short-term Long scenario:
In case price decides to move above 49600 a descent amount of stop-losses will be collected, pushing / squeezing the price up to 50000. For that case a target is set according with recent price movements having reached a zone between 1.618 and 2.272 on fibo after breaking out from consolidation. After that price can find ressistance near ascending trend upper line. If further movement rejected, a probability of a short movement down to 48800 / 48400 increases
- Short-term Short scenario:
In my opinion this scenario is a positive one, as the price can go lower to collect some power for further impulse above 49600 and later do overhigh, signaling that industry is still ok. For that case beforewards price can go significantly lower that 49100 making risk-management for this particular position too high. For this reason the short stop is set only a few pips below recent bouncing candles and flying level (see orange circles on the screen)
Fundamentals:
- take care of 6th Feb friday`s report on employment in USA, cause the higher unemployment rate will mean that economy might struggle in nearest future, whereas the lower unemployment rate means directly the opposite
Conclusion:
- in my opinion the second scenario seems to be more likely as the US companies will continue to report in february on financials for recent 4th Quartal of 2025 as well as on earning estimation for 2026, letting the price being like soda in a bottle and consolidating before further breakout
- despite this I expect a stop-loss hunt in a nearest term and therefore open a short-term long on 1h tf with SL below recent bounce candles and TP targeting:
+ middle level of fibo 1.618 / 2.272 as well as
+ 1.53% breakout movement having multiplied recent breakouts benchmarks with 0.88 (because of 12% power reduction in a movement after breakout)
# - - - - -
⚠️ Signal - Buy ⬆️
✅ Entry Point - 49501.30
🛑 SL - 49161.27
🤑 TP - 50371.72
⚙️ Risk/Reward - 1 : 2.6 👌
⌛️ Timeframe - 1 day 🗓
# - - - - -
Good Luck! ☺️
# - - - - -
DISCLAIMER: Not financial advice. Everyone must make trading decisions at their own risk, guided only by their own criteria and strategy for opening or not opening a trade.

AMD | Oversold Into Range SupportAMD sold off hard despite a top-and-bottom-line beat, as the market focused on the quality of AI upside and how quickly that turns into earnings. In this tape, expectations matter more than the headline beat.
Technical Lens: Price is drifting back towards the lower bound of the sideways consolidation (~195–200 area on this view). RSI is oversold (~29), which often makes this zone a decision point rather than a straight-line move.
Catalysts: The next re-pricing catalyst is evidence that data-centre AI GPU revenue is scaling cleanly (less one-off driven) and that margins/operating leverage improve as volumes rise. Any clear proof of larger deployments or platform wins can push forward EPS estimates higher and re-open the re-rate conversation.
Takeaway: AMD is pressing into range support with oversold momentum — the next few sessions should reveal whether this is a stabilisation zone or a range breakdown attempt.

Estimated Stock Market Peak 2026"It's time to call 'bullshit' on the market."
The newswire has been busy lately, don't get distracted by; something feels off.
More than four years have passed since my last major stock market top analysis.
Why Bitcoin? Because it is one of the most cyclical assets, based on liquidity flows at the extreme end of the risk curve, leading the global market peak.
This was the first market cycle with high interest rates and without economic stimulus. Therefore, neither an expansion of the business cycle nor a comparable investment interest from retail, which ultimately led to a peak of apathy rather than euphoria. A typical sign of a later cycle environment, in times of economic uncertainty and risk aversion, with an absence of market breadth, in which only major caps temporarily lead and all other stocks and indicators lag behind. Without an expansion of the broader markets, the entire system risks collapse as soon as the blue chips lose momentum. Zombie companies survived on 0% interest rates, but now the bill is coming due. They have to refinance billions this year at significantly higher rates and will most likely not survive. Warren Buffett, on the other hand, is sitting on a historically high cash reserve of over $380b and doesn't want to "buy the dip", but rather first ride out the delayed effects of rapid interest rate hikes and market downturns on companies whose AI expenditures aren't based on actionable revenues.
Contrary to popular belief, rate cuts into a recession are not bullish.
The Fed could begin larger cuts once they realize the economy is falling off a cliff.
Markets will then respond by falling through the news narrative of an escalating potential war or energy crisis blackout bankrun leading to surging inflation and fears of a global recession.
Only when we hit rock bottom will the Fed have a reason to intervene and aggressively stabilize the market through QE and stimulus checks.
Meanwhile, the commodity supercycle is underway, countering the cryptocurrency market, which is based on tech and big risk-on sentiment speculation. Rising precious metals are a worrying warning signal for the economy, indicating the market being concerned about the stability of the system, predicting what lies ahead of us. A rotation is unlikely to occur immediately; instead, a deep retracement will likely have to take place first. Some of the weakness by stocks may become more pronounced whenever Gold gets a correction.
You will see the US stock markets similarly plunge, but then soar like an eagle as they become the last bastion of capitalism, as frightened money from all over the place, including sovereign bond markets, pours into equities one last time as exit liquidity like never before. It will be interesting to see how ByteDance, SpaceX, OpenAI, Anthropic, Databricks, Stripe, Canva, Revolut, Klarna and Kraken time their IPOs to coincide with the market peak.
The last crypto market capitulation in June 2022 was triggered by the disappearance of Luna(+UST), 3AC, BlockFi, Celsius and the short-term depegging of USDT, which are maximum fear events. This was followed by a five-month time-based capitulation and the absolute market bottom depression caused by the FTX insolvency.
Assumption of next market capitulation bottom:
Corporate Subprime Bitcoin Crisis of 2026
"The system works – but does it justify this valuation?"
Bitcoin was an asset, but it was treated like equity. The highest-probability risk is institutional treasury capitulation under debt and cash flow pressure.
2024–2025: Bitcoin was used as a balance sheet asset (leverage, convertible bonds, project financing). Many models only work when prices rise, and not in MSTR Ponzi schemes.
In 2026, refinancing becomes more expensive, cash flows are insufficient, covenants are triggered, and creditors demand de-risking. The accompanying stock market correction will certainly contribute to this.
= Everyone who needed to own Bitcoin has to sell. High volume and volatility, thin order book illiquidity, negative altcoin funding rates, large arbitrage, and unfavorable front page newspaper and magazines coverage of fear, uncertainty and doubt sentiment.
However, the maximum psychological effect only occurs when something unexpected happens and what is perceived as "safe" breaks down, resulting in existential consequences for private investors.
1. At least another ~1% USDTUSD decline due to altcoin capitulation selling, if not eventually, at a cycle bottom, the controlled Tether implosion restructuring to USDC (Circle)
2. A reputable, top-10, retail-loving coin (-90% Solana, Tron) loses significance/trust
3. Quantum anxiety, privacy wallet/custody layer shock due to wallet bug, smart contract freeze, multi-chain bridge problem, recovery failure
= At the end of the day, as always: Bitcoin hasn't failed – but everything around it.
Assuming the market continues to move at its current velocity relative to historical corrective structures, it seems logical that the loud and frightening crash as well as the associated surprise narrative, will occur during the Blood Moon sometime in February-March.
We will see which global fear narrative emerges while observing the bottoming process through technical indicators and on-chain data. Depending on the strength of the Q1 correction, possibly 5+ months later a bottom in August-October. You should start buying BTC as soon as the price drops below $48.5k, with a target range of around $39k. If the price retraces further, things might be different this time. I will provide you with a new update then. No financial advice.
This isn't about calling a precise top. It's about asymmetry and risk management. Don't be fooled into thinking the markets are doing well beneath the surface.
"Patience is bitter, but its fruit is sweet."
Thank you for reading.
Noteworthy to watch:
- 2029 Shmita year
- 2026 median housing market peak, 18-year real estate cycle recession
- 2026 George Tritch (Benner) cycle – time to sell
- 2026 Chinese Year of the Horse
- 2026 bearish stock market U.S. midterm election years
- 2026 longest ISM PMI<50 & Copper/Gold ratio contraction
- 2026 largest inverted yield curve & Gold/US02Y ratio above 200WMA
- U.S. initial jobless claims above 260k =recession
- JNK divergences overlaying SPX
- Energy rotation Oil and Gas, inflation rising
- DXY rising
- DOWJONES reaction at 34.5k-36k
- TOTAL3ES excluding Btc, Eth and Stablecoins, reaction at $270b
- ETH expanding flat bottom zone at $900

SPX | Anchored VWAP Decision PointUS equities are seeing a familiar pattern: index-level softness driven largely by a renewed tech/AI repricing, rather than uniform downside across all sectors. That usually makes the tape choppier around key levels, because breadth can look “fine” while the index still drifts lower.
On the chart, SPX is playing around the anchored VWAP (~6,864) and struggling to build traction back above it. Price is also compressing inside the local rising channel, while momentum is cooling (RSI sub-50), which often turns VWAP into a proper inflection point rather than just a “nice line on the chart”.
Catalysts: Big-tech earnings sensitivity remains high, and any shift in rate / growth expectations (plus headline risk) can easily be the trigger for a VWAP break or a reclaim.
Takeaway: ~6,864 anchored VWAP is the decision point — above it the structure can stabilise, below it the chart starts to look like a clean pullback path towards the lower dashed channel.

Kiwis Over Kimonos: The Technical & Macro Case for NZDJPY Longs📊 WEEKLY CHART (Big Picture Context)
Structure:
Long-term trend:
● Massive downtrend (Mar 2024 - Aug 2024): ~100 → ~80 (-20%)
● Basing/consolidation (Aug 2024 - Jan 2026): ~80-88 range
● Recent breakout (Jan 2026): Broke above 88 resistance, now testing 93-94 zone
Key Levels:
Resistance:
● 95.00 (psychological, also visible on chart - horizontal gray zone top)
● 98.00-100.00 (major supply zone from 2024 highs)
Support:
● 93.00-93.78 (current price, dotted resistance line)
● 88.00 (red horizontal line - broken resistance turned support)
● 86.00-87.00 (rising support, volume shelf)
Muh Momentum Indicators:
Gaussian Filter (Green/Red Line):
● ✅ GREEN (bullish signal per your rules)
● Trending upward (momentum building)
SMA50 (Purple Line):
● Currently around 87-88
● Price well above SMA50 (93.78 vs ~88) = long bias per your rules
Volume Profile (Left Side):
● Heavy accumulation at 87-88 range (thick horizontal bars)
● Thin volume above 93 (air pocket = easy to move higher)
Weekly Chart Verdict:
✅ Bullish structure:
● Broke out of 18-month base (80-88 range)
● Trading above SMA50 (long scanning mode)
● Gaussian Filter GREEN (trend up)
● Testing resistance at 93-94 (dotted line)
⚠️ Key decision zone:
● IF breaks above 94-95 = continuation to 98-100
● IF rejects here = pullback to 88-90 (retest breakout)
Macro alignment:
● ✅ Risk-on regime (PMI 52.6, breadth good, yields reversing)
● ✅ JPY weak (carry trade working)
● ✅ NZD high beta (rallies hard in risk-on)
📊 4-HOUR CHART (Entry Timing)
Structure:
Recent rally:
● Jan 14-21: Sharp rally from ~90 → ~93.5 (breakout move)
● Jan 21-28: Consolidation / mild pullback (~92-93.5 range)
● Jan 28-Feb 3: Breakout attempt (~93.5 → 93.95)
Key Levels:
Resistance:
● 93.95 (current high, dotted line)
● 94.50-95.00 (next major resistance zone)
Support:
● 93.00 (lower dotted line, POC from volume profile)
● 92.50 (Gaussian Filter GREEN line)
● 91.90 (SMA50 purple line, rising support)
Muh Momentum Indicators:
Gaussian Filter:
● ✅ GREEN and rising (bullish momentum)
● Currently around 92.50
SMA50 (Purple):
● Around 91.90 and rising
● Price above SMA50 (93.95 vs 91.90) = long bias
Volume (Bottom Panel):
● Volume declining as price rises (slight concern)
● BUT: Not spiking on selloffs (no panic, just consolidation)
4H Chart Verdict:
✅ Bullish setup:
● Clean uptrend (higher highs, higher lows)
● Gaussian GREEN + rising
● Price above SMA50
● Consolidation resolved to upside
⚠️ Volume concern:
● Declining volume on rally = needs confirmation
● Breakout above 94.50 needs VOLUME to be trusted
Setup:
● IF breaks 94.50 with volume → long entry
● IF rejects and breaks 93.00 → wait for pullback to 92.50-91.90
📊 DAILY CHART (Target Mapping)
Structure:
Clean uptrend since Nov 2025:
● Nov 2025: Bottomed at ~86-87
● Dec 2025 - Jan 2026: Grinded higher in rising channel
● Feb 2026: Testing 93.93 resistance (dotted line)
Key Levels:
Resistance:
● 93.93 (current, dotted line)
● 95.00 (psychological)
● 98.00 (major from weekly chart)
Support:
● 91.00 (rising trendline, black diagonal)
● 89.50 (SMA50 purple line, rising)
● 88.00 (major support, red horizontal line)
Muh Momentum Indicators:
Gaussian Filter:
● ✅ GREEN and curling up
● Around 91.50
SMA50:
● Around 89.50 and rising steadily
● Price well above (93.93 vs 89.50)
Volume:
● Recent spike (visible on right side) = breakout attempt
● Declining after spike = needs follow-through
Daily Chart Verdict:
✅ Strong uptrend:
● Higher highs, higher lows since Nov
● All moving averages rising
● Gaussian GREEN
● Above SMA50 (long bias)
⚠️ At resistance:
● Testing 93.93 (dotted line)
● Needs to break 94.50-95.00 to confirm continuation
Targets if breaks out:
1. 95.00 (psychological)
2. 96.50 (halfway to major resistance)
3. 98.00-100.00 (major supply zone from weekly)
🎯 TRADE SETUP (Combining All 3 Timeframes)
Macro + Technical Alignment:
FinEco Regime:
● ✅ Risk-on (PMI 52.6, breadth improving, yields reversing)
● ✅ JPY weak (JXY -0.53%, carry trade working)
● ✅ NZD high beta (rallies in risk-on)
● ✅ Yields reversing (easier conditions = bullish for risk)
● ✅ DXY weakening (-0.15% = tailwind for non-USD)
Technical:
● ✅ Weekly: Broke out of 18-month base, testing 93-94
● ✅ Daily: Clean uptrend, Gaussian GREEN, above SMA50
● ✅ 4H: Higher highs/lows, consolidation resolved upward
Your Framework:
● ✅ Price above SMA50 = long scanning mode ✅
● ✅ Gaussian Filter GREEN = bullish signal ✅
📋 LONG SETUP (High Conviction)
Entry Options:
Option 1: Aggressive Breakout Entry
Trigger: Break above 94.50 with volume
Entry: 94.50-94.70 (on breakout confirmation)
Targets:
1. 95.50 (first resistance)
2. 96.50 (measured move)
3. 98.00 (weekly resistance)
Stop Loss: 93.00 (below consolidation / Gaussian Filter support)
Risk/Reward: ~2.5:1 (risking 150 pips for 350-400 pips)
Confirmation needed:
● ✅ Volume spike on breakout (4H chart)
● ✅ Daily close above 94.50
● ✅ Gaussian Filter stays GREEN
● ✅ Risk-on continues (SPY holding, VIX low, yields stable/falling)
Option 2: Conservative Pullback Entry
Trigger: Pullback to 92.50-93.00 (Gaussian Filter / support zone)
Entry: 92.50-93.00 (on bounce)
Targets: Same as Option 1 (95.50 → 96.50 → 98.00)
Stop Loss: 91.50 (below Gaussian Filter + rising trendline)
Risk/Reward: ~3:1 (risking 130 pips for 350-500 pips)
Why this works:
● ✅ Better risk/reward (closer to support)
● ✅ Confirms buyers defend the breakout
● ✅ Aligns with Gaussian Filter (your indicator)
Invalidation (When to Abort):
❌ If any of these happen:
1. Breaks below 91.00 (rising trendline on daily)
2. Gaussian Filter flips RED (sell signal per your rules)
3. Breaks below SMA50 (~89.50 on daily) = flips to short scanning
4. Risk-off event:
○ VIX spikes >20
○ SPY breaks major support
○ Yields spike (10Y >4.40%)
○ Geopolitical crisis (Iran war, etc.)
✅ FINECO AI ASSISTENT'S FINAL VERDICT:
Setup Quality: 8.5/10
Strengths:
● ✅ Clean uptrend (higher highs/lows)
● ✅ Macro aligned (risk-on, JPY weak, yields reversing)
● ✅ Indicators confirm momentum (Gaussian GREEN, above SMA50)
● ✅ Broke out of 18-month base (weekly)
● ✅ High beta pair (big moves in risk-on)
Weaknesses:
● ⚠️ Volume declining on rally (needs confirmation)
● ⚠️ At resistance (93.95) = extended short-term

Why BTC is Heading to $43k!Looking at the weekly chart, the picture for Bitcoin is becoming increasingly bearish. We have a clearly defined Head and Shoulders pattern, and the recent price action suggests we are at a critical tipping point.
Technical Outlook: The "Right Shoulder" has just been completed right around the 2025 Open level.
My primary scenario involves a short-term corrective bounce towards the zone between the 2026 Open (~$88,000) and 2025 Open (~$94,000) to flip previous support into resistance.
Following this, I expect a continuation of the downtrend with a primary target at the 2024 Open level (the ~$42k - $45k area), representing a potential -44% move from current levels.
Fundamental Headwinds:
Institutional Exit: Over the last 3 months, we've witnessed a massive $6.18 billion outflow from BTC ETFs.
BlackRock Signal: Notably, even BlackRock's client base has shown a significant shift toward selling, which often precedes a deeper market correction.
The MicroStrategy Risk: With their average purchase price hovering around $76,052, the current market price puts them near a break-even point. If BTC sustains a move below $70k, the pressure on their balance sheet becomes a real "black swan" threat.
The 2nd Year Presidential Cycle: We are currently in the second year of Trump's presidency. Historically, the 2nd year of any US presidency over the last 50 years has been the weakest for high-risk assets.
This is typically the year when economic "skeletons in the closet" appear. I don't expect a sustainable bull run until 2027 (the 3rd year), when administrations historically pump the markets to ensure favorable re-election conditions.
Conclusion: The technical breakdown combined with institutional outflows and unfavorable cyclical timing points to a long-term correction. Watch the 2024 Open level as the ultimate magnet.
Resistance Zone: $88,000 - $94,000
Target: $43,000 (2024 Open)
Not financial advice. Trade at your own risk!

The Dollar as a Liquidity Gauge: Why the 20 EMA on DXY Matters Most people frame markets as “risk on / risk off.”
I prefer to think in liquidity conditions.
The U.S. Dollar Index (DXY) sits at the center of global markets.
Equities, crypto, commodities, and FX all respond — directly or indirectly — to how tight or loose dollar liquidity is.
This chart shows why a simple 20 EMA often explains more than narratives.
How I read DXY (simple framework)
• Above a rising 20 EMA
→ Dollar strength pressures global liquidity
→ Risk assets often struggle to expand
• Below a falling 20 EMA
→ Dollar pressure eases
→ Liquidity conditions improve across markets
• Sharp extensions away from the 20 EMA
→ Frequently followed by mean reversion — not due to opinion, but because momentum stretched too far, too fast
This isn’t about calling tops or bottoms.
It’s about understanding when the dollar acts as a headwind vs a tailwind.
What the recent move tells us
Notice how DXY:
• Broke down through short-term structure
• Accelerated away from the 20 EMA
• Is now reacting back toward that mean
That sequence alone helps explain why you often see:
• Equities turn green during dollar weakness
• Risk assets stall or pull back as DXY regains footing
No prediction required — the mechanics are visible.
Why this matters
The dollar doesn’t trade in isolation.
It quietly sets the environment other assets must operate within.
Tracking where DXY sits relative to its short-term trend helps you:
• Avoid emotional reactions to headlines
• Distinguish structural moves from reflexive ones
• Stay aligned with liquidity, not noise
I’ll continue using simple tools like EMAs and structure to explain how markets behave, not what they “should” do.
Markets evolve.
Liquidity leaves footprints.

This Is Not a Prediction — It’s What Price Knew Before the NewsThis is not a prediction.
It is an observation of how price behaves before narratives turn into headlines.
Lately, the uncomfortable reality is that we ourselves have become part of the news.
Not because we are large enough to move markets on our own,
but because the environment we operate in has become impossible for markets to ignore.
That said, there are forces far larger than any single event or group.
Factors that may not directly involve human lives, yet often carry even greater weight for capital flows.
The announcement of a new Federal Reserve chair is one such example.
Over the weekend, my analysis led to a conclusion on the chart that felt unusual.
From a structural and geometrical perspective, it was clean and consistent.
Yet finding confirmation in the real world was not straightforward.
That tension lingered — not because the chart appeared flawed,
but because price seemed to be processing information before it became visible in the news.
We already understand some fundamental truths.
News is a catalyst, not the cause.
Markets do not generate money.
Which means it is impossible for everyone to be positioned on the same side —
buyers cannot exist without sellers.
We also know that, particularly on lower timeframes, markets are effectively zero-sum.
One participant’s profit is another’s loss.
This is why rational exits and profit-taking are not optional decisions,
but structural necessities.
At the same time, the impact of war on gold and equity markets is well understood.
Not just through headlines, but through price behavior itself.
This brings us to the key question:
How can gold and silver move lower while equity markets push higher?
This is where the narrative around potential Iran–US negotiations becomes relevant.
The reality of conflict had already been fully visible to the world — and to the market.
Its effects were largely priced in long before escalation became a dominant headline.
In such an environment,
the idea of negotiations can temporarily reduce risk aversion.
Not because underlying risks have disappeared,
but because capital responds to perceived shifts in narrative.
For those accustomed to long-term geopolitical uncertainty,
market reactions to conflict and diplomacy tend to follow familiar patterns.
The result can be a deeper correction in gold,
alongside strength in equity markets.
Not necessarily because long-term direction has changed,
but because positioning is being adjusted.
This kind of price action often serves two purposes at once:
creating more favorable entry conditions in gold,
while allowing large participants to distribute exposure in equities.
Notably, this interpretation aligns closely with market geometry across multiple charts.
Even the lack of advance communication to key allies regarding the timing of military actions
may point less to disorder and more to deliberate opacity —
a condition that volatility thrives on.
It is difficult to believe that an experienced businessman would genuinely expect
such negotiations to deliver a meaningful or lasting resolution.
Is the current strength in equities a genuine signal of safety —
or simply the final window for capital to reposition?

GOLD COLLAPSE
Instrument: XAUUSD (Gold) | Date: 31-Jan-2026
Context: ATH impulse → Friday liquidation → post-break value migration
Inputs: Your 15m / 1H / 4H / 1D / 1W / 1M charts + FRVP/FVRP map + volume footprint
EDUCATIONAL ONLY — Not financial advice — Not trade signals.
══════════════════════════════════════════════════════════════════════
1) EXECUTIVE SYNTHESIS (WHAT WE CONCLUDED THIS SESSION)
• Gold printed an ATH shelf around 5595–5597 (weekly/monthly high marker) then
collapsed violently on Friday into the ~4860 region (your screen’s bid/ask zone).
• This sequence is structurally consistent with “blow-off → distribution → forced unwind.”
The key is NOT the candle shape; it’s the auction migration: value left the upper
acceptance band and rotated down into a new lower composite balance.
• FRVP/FVRP inference from your rails: the market is transitioning from the 51xx–55xx
distribution inventory into a 49xx–48xx composite value area. This implies:
(A) upside bounces face heavy overhead supply until acceptance reclaims key rails,
(B) downside becomes controlled by the decision rail cluster 4804/4771 and the
hard-defense band 4712–4686.
2) AUCTION LOGIC: ATH → COLLAPSE = VALUE MIGRATION (NOT RANDOM VOLATILITY)
• Upper distribution completed at/near ATH: late-stage extension produced “fresh
inventory” (late longs, momentum funds, options hedging), which is vulnerable to a
regime shock (USD/rates).
• Liquidation cascade mechanics:
- Break prior HVN/POC supports → accelerate through LVNs (thin participation zones)
- Find the next HVN/value shelf → stabilize → rotate (balancing/accumulation pocket)
3) FRVP/FVRP MAP (DISTILLED FROM YOUR WEEKLY/MONTHLY/DAILY/4H RAILS)
A) Overhead Supply / Repair Ceilings (resistance ladder)
R1: 4922–4923 (macro + LTF sell rail confluence)
R2: 4944–4948 (local highs / immediate overhead)
R3: 4992–4996 (monthly “repair ceiling” / acceptance test)
R4: 5047–5048 (weekly breakdown rail; reclaim changes regime)
R5: 5108 → 5255 (prior weekly acceptance band; heavy inventory)
R6: 5563 → 5595–5597 (late-stage cap / ATH shelf; only after full repair)
B) Active Supports / Defense Pools (downside ladder)
S1: 4866–4855 (sweep/reject absorption pocket)
S2: 4816–4796 (LTF buy rails / local low zone)
S3: 4804–4771 (monthly breakdown + decision rail)
S4: 4712–4686 (4H hard support band / next “must-hold” if balance fails)
S5: 4617–4606 (liquidation shelf / last line before daily demand)
S6: 4509–4495 (daily demand shelf; larger repair base if reached)
S7: 4358 (deep daily rail; tail support before weekly 39xx zone)
4) VOLUME FOOTPRINT TAKEAWAYS (WHY FRIDAY LOOKED LIKE THAT)
• The down leg displayed characteristics of “initiative selling” (urgent liquidation):
stacked sell imbalances and fast travel through low-acceptance zones.
• The stabilization zone near 4866/4855 printed “sweep + reject” signatures:
- Sweep = liquidity run through resting bids/stops
- Reject = close/reclaim back above the swept level
Institutional read: responsive buying/absorption (not the same as trend reversal).
• Conclusion: market likely moved into “balancing/accumulation pocket” at lower value,
while overhead inventory remains dominant until proven otherwise via acceptance.
5) KEY TECHNICAL DECISION POINT (NEXT 1–3 WEEKS)
• The session’s primary “decision rail” is the 4804/4771 cluster.
- Hold above it: repair-range probability increases (auction rotates, builds value).
- Accept below it: continuation liquidation becomes dominant (4712–4686 → 4606 → 4509).
6) WHAT DROVE THE ATH IMPULSE (LAST WEEK’S STACKED RISK PREMIUM)
We framed the ATH week as a multi-driver stack rather than a single data print:
A) Safe-haven rush + geopolitical premium
• Risk headlines and uncertainty created a “fear bid,” reinforcing gold’s role as a hedge.
B) “Debasement / policy independence” narrative + USD softness (pre-Friday)
• Market discourse leaned toward hedging USD credibility and policy unpredictability,
which historically increases gold’s convexity to negative headlines.
C) Positioning and momentum mechanics (microstructure fuel)
• Once successive psychological/technical levels broke, flows can shift from “allocation”
into “forced chase”: trend-following, vol-control, and options gamma hedging amplify
upside in a grind. This sets up fragility: when the regime flips, exits become crowded.
7) WHY IT COLLAPSED ON FRIDAY (REGIME FLIP → USD + REAL-RATE REPRICING)
• Session conclusion: the Friday collapse was driven by a market regime shock to the
rates/credibility narrative (Fed leadership succession storyline). Mechanism:
- USD strengthened and rate expectations repriced → gold de-levered rapidly.
• Structural point: after ATH, the market holds maximum “wrong-way inventory,” so a USD
spike can trigger forced selling, accelerating drops through LVNs until the next HVN.
8) CROSS-ASSET TRANSMISSION MAP (CONFIRMATION BOARD)
A) USD (DXY proxy)
• Primary lever: strong USD bid = headwind for gold; gold rallies tend to fail at repair
ceilings when USD is persistently rising.
B) Rates (nominal + real yield expectations)
• Higher real-rate expectations compress gold’s multiple; lower real-rate expectations
tend to support gold. The Friday tape behaved like a “real-rate/credibility shock.”
C) Equities (SPX/NDX) + Vol (VIX)
• When “USD up + rates up” drives the tape, both duration assets and gold can fall.
• Gold trends best in “risk-off with USD down” (confidence shock / debasement regime).
• “Risk-off with USD up” often yields choppy gold (spike then fade), not a clean trend.
D) Metals beta (silver)
• Silver behaves as high-beta precious metals positioning; it can confirm crowding and
the violence of the unwind when the trade reverses.
9) GEO-MACRO THEMES DISCUSSED (THEATERS AS GOLD RISK-PREMIUM CONTRIBUTORS)
We structured geopolitics as “theater → transmission → gold levels”:
• Arctic/Greenland/Europe reliability: functions as alliance reliability premium and trade
spillover risk; supportive when it weakens confidence/predictability.
• Russia/Ukraine/energy: inflation uncertainty + Europe growth risk can support gold,
but can also create a two-way response if it raises rates/real yields.
• Israel/Iran: classic war-risk premium; may produce spikes that fade if USD bid dominates.
• China/Taiwan + Asia physical: viewed as structural “floor builder” over time; does not
prevent drawdowns but increases odds of absorption at major value shelves.
• Venezuela/LatAm: typically a tail cluster amplifier; rarely a solo trend driver, but it
stacks into the broader risk premium when USD credibility is in question.
10) 3-MONTH OUTLOOK (FEB–APR 2026): INSTITUTIONAL SCENARIO TREE
A) Scenario A — BASE CASE “RE-AUCTION / REPAIR RANGE” (highest probability)
• Thesis: post-liquidation balance forms. Price oscillates between a lower floor band
(4804/4771 into 4712) and a repair ceiling band (4995 into 5048).
• Path: defend absorption pocket → probe resistances → accept/reject decides speed.
• Confirmation: sustained acceptance above 4995, then above 5048.
B) Scenario B — BULL CASE “V-SHAPE RECLAIM” (lower probability)
• Thesis: Friday was capitulation; absorption expands; shorts trapped.
• Requirements:
1) Hold above 4804/4771 (no sustained value acceptance below)
2) Quick reclaim of 4923 then 4995
3) Break/accept 5048 (weekly reclaim)
• Targets: 5108 → 5232 → 5307/5374 (ATH shelf only after multi-week repair).
C) Scenario C — BEAR CASE “VALUE BREAKDOWN CONTINUATION” (meaningful risk)
• Thesis: bounce is mainly short-covering; sellers reassert at 4923/4995.
• Sequence: failure at resistances → break 4804 → accept below 4771 → 4712/4686 →
4606 → daily demand 4509/4495 (tail 4358 if macro compounds).
11) US GOVERNANCE SHOCK SECTION (ORGANIZED BY SEVERITY ON GOLD)
We added a dedicated governance chapter requested by you, ranked by probability of
forcing a USD/rates regime shift (the most gold-relevant mechanism):
Severity 1 (Highest): FED SUCCESSION / POWELL FIASCO (Powell → Warsh narrative)
• Direct channel: USD + real-rate expectations repricing → immediate gold repricing.
• Technical link:
- Bull repair requires acceptance above 5066 then 5137/5232.
- Bear continuation opens if 4909 fails → 4795 → 4741/4713 → 4668 → 4606/4509.
Severity 2 (High): GOVERNMENT CLOSURE / FUNDING PARALYSIS
• Can raise volatility and growth risk; gold response depends on whether USD becomes the
liquidity refuge. Best gold regime is shutdown stress that weakens USD credibility or
pulls real-rate expectations down.
Severity 3 (Medium): ICE / MINNESOTA CIVIC INSTABILITY CLUSTER
• Usually a “legitimacy premium” that fades unless it escalates into sustained paralysis.
• Cross-asset signature matters:
- Vol up + yields down + USD not surging = gold supportive.
- Vol up + USD up + yields up = choppy (spike/fade).
Severity 4 (Low→Medium): EPSTEIN FILES RELEASE
• Typically narrative/trust shock only; becomes gold-relevant only if it catalyzes legal/
political paralysis that feeds into shutdown risk or broader legitimacy crisis.
12) EXECUTION PLAYBOOK (HOW WE SAID TO TRADE THIS LIKE A DESK)
Rule 1: Don’t trade the headline. Trade the regime.
• Regime = USD direction + real-rate direction + risk/volatility state.
Rule 2: Upside is not “real” until acceptance reclaims the repair rails.
• First: 4923 then 4995 acceptance; structural change only after 5048 reclaim.
Rule 3: Downside is not “real” until breakdown rails break AND fail retest.
• Key: 4804/4771; if accepted below, the next auction targets 4712/4686 then 4606.
Rule 4: Use footprint confirmation:
• Bottoming = aggressive sell delta + price stops going down (absorption) + reclaim LVN.
• Topping = aggressive buy delta + price stops going up (distribution) + breakdown HVN.
13) “WHAT TO WATCH NEXT” CHECKLIST (NEXT WEEK)
• Does the 4866/4855 pocket keep printing “sweep → reclaim → hold”?
If yes: stabilization/balance is real.
• Do rallies repeatedly fail at 4922/4923 or 4995?
If yes: overhead supply remains dominant; range/mean-reversion favored.
• Most important: 4804/4771 decision rail behavior.
Hold above = repair; accept below = continuation to 4712/4686 → 4606 → 4509/4495.
What actually happened with silver and gold?📉 🔥 Historic sell-off in precious metals
Silver plunged roughly 30% in a single session, one of the steepest drops in decades.
Gold also fell sharply, down ~10% on the same day.
This wasn’t a gradual pullback, it was an explosive repricing event tied to market structure and narrative shift.
📌 The main trigger, Fed politics and policy expectations
🎯 Fed chair nomination reset risk pricing
President Trump’s announcement of Kevin Warsh as the next Federal Reserve Chair triggered the move.
Warsh is widely viewed as someone who would not pursue aggressive rate cuts or “soft dollar” policy.
Markets interpreted the news as reducing the likelihood of sustained monetary easing.
This altered expectations about:
- future rate cuts
- the strength of the USD
- how attractive non-yielding assets like gold & silver are
💵 Dollar and rates link
Silver and gold rallied heavily earlier this year on the weak dollar / low-rate narrative (inflation fears + Fed independence concerns).
After the Fed chair news:
- USD strengthened (DXY saw among its biggest single-day gains in months).
- Stronger dollar = precious metals face headwinds because they’re priced in USD globally.
- That dynamic mechanically pressured the metals complex.
🧨 Structural and technical catalysts
There were additional amplifiers beyond the headline:
1) Overextension
Silver was coming off a parabolic run. Parabolic moves tend to have sharp corrections once the narrative shifts, especially in leveraged markets.
2) Leverage unwind and margin effects
Many speculative positions were highly leveraged.
Once price started dropping, margin calls and algorithmic stop-loss triggers can cascade into rapid, large moves.
This is exactly how big crashes can happen even without fundamental supply/demand changes.
3) Monthly liquidity dynamics
Friday, Jan 30 was the final trading day of the month for many accounts, liquidity tends to thin at month-end and amplify volatility.
🧠 Market behavior tells a macro story, not just a metal story
1) Narrative shift from debasing dollar / easy money to policy uncertainty
Before: markets discounted a scenario of future rate cuts and dollar weakening → commodities soared.
After: a perceived shift in Fed leadership removed some of that expectation → safe haven flows unwound.
This is why silver and gold can drop even as risk assets also weaken, it’s not a simple risk-off trade.
2) Silver’s structure makes it more volatile than gold
Industrial component + safe-haven component
Overextension + technical stops = exaggerated moves
This aligns with macro liquidity swings rather than fundamentals abruptly changing.
📌 How this fits within a macro narrative
Your macro framework emphasizes relationships and regime context, not isolated moves. This event reinforces that:
➤ Monetary policy expectations are still central
Today’s moves weren’t driven by CPI or GDP data, they were driven by policy narrative shifts.
➤ Markets can unwind risk assets outside classic risk-off
Here we saw:
- Dollar strengthening
- Metals collapsing
- Stocks weakening
- Volatility rising
This is not pure risk-off, nor pure risk-on, it’s a repricing of policy risk across decision trees.
➤ Carry and liquidity still matter
When narrative shifts quickly, the weakest crowded trades unwind first, in this case, highly leveraged precious metals. Even ahead of the broader regime shift.
🧩 What this means for the short–medium term
1) Silver and gold volatility will stay elevated
Sharp moves tend to be followed by whipsaw behavior
Positioning is de-risking, not necessarily reversing yet
2) Dollar strength matters
Metals are discounted as the dollar index rebounds
Watch DXY behavior closely, if it stabilizes lower again, metals may find a footing
3) Policy risk is now priced more dominantly than macro data
Traders are reacting to expectations of future rate trajectories
This can create overshoots in both directions
📌 Key factual takeaways
Silver’s ~30% drop was one of the largest single-day declines in decades, driven by Fed chair nomination news and immediate re-pricing of monetary expectations.
A stronger USD and rising yields created headwinds for precious metals, which are priced in dollars and do not yield interest.
Technical and leverage factors (stop-losses, margin calls, overextended RSI) amplified the sell-off.
This was not a fundamental supply shock, but a macro sentiment and positioning unwind.

Argentina’s Global Ascent: Decoding the USD/ARS ShiftArgentina is witnessing a historic pivot. Following a landslide midterm victory in late 2025, the administration has consolidated power. The USD/ARS pair now reflects this newfound political stability. This stability signals a departure from years of chronic volatility.
Geopolitical Realignment and the Ecuador Effect
Argentina’s geostrategy has shifted toward a firm Western alliance. The administration’s ties with the United States have unlocked critical financial backing. Recently, Ecuador’s $4 billion bond success served as a regional bellwether. Investors view Ecuador’s market return as a blueprint for Argentina. Both nations share a history of restructuring. However, Argentina's economy is four times larger. This scale attracts institutional appetite for high-yield emerging assets.
Macroeconomics: The Fiscal Anchor
Fiscal discipline is no longer a mere promise. The government achieved a consistent fiscal surplus throughout 2025. Inflation is projected to continue its downward trend throughout 2026. This aggressive disinflation strategy supports the peso’s relative strength. The Central Bank continues to rebuild reserves through strategic dollar purchases. While debt maturities remain high, the recent political mandate empowers the executive to maintain a lean budget.
Tech Frontiers: Infrastructure and Innovation
Technology is driving a structural shift in Argentina’s trade balance. Knowledge-based services (KBS) exports are reaching record highs. Major global tech players are exploring "Stargate" style infrastructure projects in the South. These data centers leverage the region’s cold climate and energy surplus. Such high-tech investments create a steady demand for local currency. Argentina is transitioning from a talent exporter to a global digital infrastructure hub.
Innovation and Patent Analysis
The high-tech sector is maturing beyond simple outsourcing. Patent filings in agritech and biotech have surged annually. Local unicorns now dominate global engineering markets. Patent analysis reveals a focus on AI-driven automation and blockchain-based logistics. These innovations protect intellectual property while diversifying the nation's export portfolio. This scientific progress acts as a long-term hedge against traditional commodity cycles.
Leadership and Corporate Culture
Management styles in Argentina are evolving rapidly. A new era has introduced a culture of radical transparency and efficiency. Business models now prioritize SaaS (Software as a Service) and cloud-native architectures. Leadership teams are adopting "Security-by-Design" to mitigate rising cyber risks. The cybersecurity market is expanding as firms protect digital assets. Companies are investing heavily in Security Operations Centers to ensure operational resilience.
Conclusion: A New Economic Model
Argentina’s path to market normalization is accelerating. New incentive regimes offer long-term stability for major projects. This regulatory certainty attracts energy and mining giants to shale and lithium deposits. The USD/ARS pair is no longer just a measure of crisis. It is now a metric of a nation’s profound structural transformation.

Bitcoin Macro Risk Given the macroeconomic and geopolitical backdrop, BTC is more likely to react negatively to Trump's speech today, as:
- An armada led by the aircraft carrier USS Abraham Lincoln has approached Iran.
- The USS Abraham Lincoln costs over $2.5 million per day to maintain.
- The USS Abraham Lincoln, the largest aircraft carrier in the world, costs the US approximately $1 billion to maintain.
- Trump's man is more likely to be the Fed's choice, meaning there's room for maneuver while Jerome Powell, who has a poor relationship with Trump, is in office, as Powell doesn't want to lower rates. Without rate cuts, the market is simply suffocating. It's also worth considering that Trump is a money-smart guy, and such spending is likely to trigger certain events.
- We have over $100 million in liquidity accumulated in BTC, which needs to be collected.
- Many are now expecting growth, so downward manipulation is more likely. Today's speech is more likely to disrupt all patterns and structures with its manipulative downward movement.
Full breakdown with levels and graphs on the website

THE FOUR HORSEMEN OF FINANCE -BTC/SP500/GOLD/COPPERTHE FOUR HORSEMEN OF FINANCE
BTC/SP500/GOLD/COPPER
"THE GREAT SHOWDOWN IN THE FINANCIAL ARENA: WHO WINS?" ⚔️
There are 4 assets on the table: GOLD | COPPER | SPX | BITCOIN
Our technical data screams that history's largest "Great Rotation" has begun. Leave your emotions aside. Let the data speak.
ROUND 1 & 2: THE "BUBBLE" vs THE "OPPORTUNITY"
Traditional markets are saturated. Bitcoin is historically cheap against them.
BTC vs S&P 500: RSI is at 26 (Technical Bankruptcy). Similar to 2015/2019 bottoms.
BTC vs GOLD: RSI is at an ALL TIME LOW (29).
2w chart BTC vs S&P 500
1w chart BTC vs S&P 500
1w BTC vs GOLD
1M BTC vs GOLD
Verdict: Wall Street and Gold are exhausted. Smart money is rotating into the only oversold asset: Bitcoin.
ROUND 3: THE ECONOMIC REALITY
Is Bitcoin expensive against the economy? NO.
BTC/COPPER: Technically oversold against industrial demand.
COPPER/GOLD RATIO: Deep in the danger zone (RSI 22). When this ratio rises from the dead, Bitcoin goes parabolic.
Meaning: We are at the exact pivot point where risk appetite wakes up.
THE VERDICT & THE TRAP
Those in stocks feel "Safe." Those in Bitcoin feel "Tired." This is the trap. The market transfers wealth from the impatient to the patient.
The Scoreboard:
S&P 500: Overvalued ❌
Gold: Saturated ⚠️
Bitcoin: OVERSOLD AGAINST EVERYTHING. ✅
Strategy: Follow the value, not the price. The "Great Rotation" flows to the scarcest asset—because this is exactly what happened in every previous cycle bottom. History is repeating itself.
PSYCHOLOGICAL TRAP
Those currently in stocks or gold feel "Safe." Those holding Bitcoin feel "Tired and Jaded." This is exactly what the market is: A transfer of wealth from the impatient to the patient.
The "Oversold" zones on the charts are "Pain" zones. But the biggest profits are always born from this pain.
STRATEGY
I am not a soothsayer; I am an analyst. The data tells me this: Global liquidity will exit swollen traditional markets (SPX, Gold) and flow into the asset with the highest "Value/Price" mismatch.
That asset, having bottomed out in all ratios, is Bitcoin. This is not investment advice; it is an "Asset Survival" guide.
"The crowd follows price; Professionals follow value." Value is currently at the bottom, while Price has not yet left the station.
Are you ready?

Macro Structure Snapshot – Rates, Dollar & Yield Curve Alignment1) Short-Term Rates (2Y)
Short-term yields remain flat and stalled, reflecting continued compression and equilibrium. Momentum is muted, signaling ongoing digestion rather than directional intent. This reinforces a neutral short-term rate regime, keeping near-term liquidity pressure contained.
2) U.S. Dollar Index (DXY)
The dollar continues to unwind lower, now trading near 97.45, with the 20 EMA showing clear downward curvature. Momentum remains negative, confirming continued cooling rather than stabilization. Structurally, this maintains a risk-supportive macro backdrop, as dollar weakness typically alleviates pressure across broader asset classes.
3) Long-Term Rates (10Y)
Long-term yields remain constructive, holding higher with the 20 EMA maintaining smooth upward momentum. This reflects improving structural participation and supports a gradual re-expansion in macro trend energy, particularly relative to the continued stalling in short-term rates.
4) Macro Alignment
Macro structure continues to reflect a controlled regime transition:
Short-term rates compressed
Dollar trending lower
Long-term yields stabilizing and advancing
This alignment supports a constructive macro backdrop, where volatility remains restrained while broader structure slowly rebuilds.
5) What I’m Monitoring
I’m watching for:
Continued 2Y compression vs 10Y expansion, and
Whether DXY downside momentum persists,
as this combination often precedes broader directional clarity across equities, commodities, and crypto risk cycles.
⭐️Final Clarity Note⭐️:
This remains a structure-driven environment, where macro alignment favors stability, gradual risk expansion, and regime transition, rather than abrupt directional shifts. Compression continues to be the dominant force, with energy slowly rebuilding beneath the surface.

SIL might be about to rip; “precious metals baton pass.”Given the often repeated “precious metals baton pass”, Gold -> Silver -> Silver Mining pattern it seems probable that SIL is starting to rip. This chart shows the 20, 50 and 200 SMA, an uptrend channel and coiling wedge. What this says to me is:
- All SMAs are curling up
- SIL is consistently running on the high side of the channel
- The coiling wedge is building energy to bust a move
- These are volume candles and you can see that volume has increased
If this trend is accurate we might see SIL hitting 127 to 141 by Feb 10th, an approx 14-27% gain.
“precious metals baton pass”
Gold usually breaks out first, silver follows with higher beta once the move is confirmed, and miners often explode last as margins expand and the market re-prices profitability—though cost inflation and political risk can cap the upside.
NAMM, BGL, both stocks related to the reopening of Gold mines in Namibia and Ghana shows there is renewed interest in mining and silver often an side product of other mining. While this post is about silver, consider GDX, GDXJ (rocket fuel), JNUG (2x leveraged), RING and SGDM for similar opportunities in gold mining.
