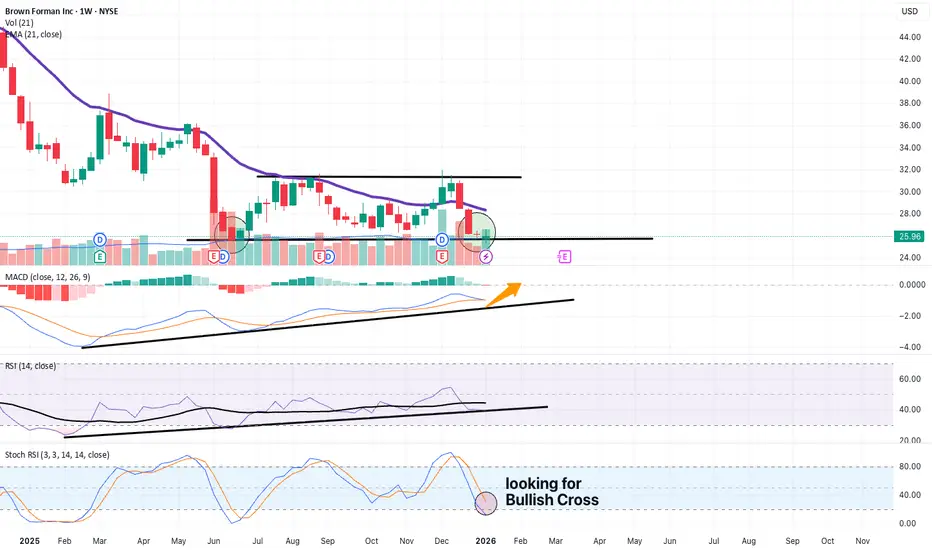
BF.B - Oversold Technicals flashing for this Alcohol CompanyHi guys. Technicals are looking like Oversold in my opinion for BF.B (Brown Forman Inc.)
Note this is for educational purpose only. Always do your own due diligence when taking trades.
So on the 1 week timeframe (Macro look). BF.B has been on the downtrend since August 2020.
Signs in my opinion show a slowdown and a consolidation zone forming. Which could also indicate potential bottoming of this stock.
We hit the $25.60 - 26.60 in June 2025. Then had a run up to around $31.00, hitting it twice. Now we are back down in the 25.60 - 26.60 zone.
This could be a double bottom. If the $25.60 - 26.60 zone holds as Support it maybe more likely.
There are also signs of Indicator Price Divergence where Price is in a downtrend but Indicators are in an Uptrend. This usually hints at price reflecting indicators so eventually price would move up to reflect indicator being in an Uptrend as well.
This is seen in the RSI and MACD indicators.
Volume and further Momentum indicators still show that this stock is still trying to figure itself out and momentum has not yet entered.
I would like to see A Bullish Stoch RSI cross with MACD flipping Green with clear movement upwards towards 0 level.
This would be key for taking positions as you don't want to enter a position only to hold if it continues lower. Clear signs are needed.
Another trade set up would be to take positions when there is a Consolidation pattern breakout with confirmation.
Macroanalysis
USD/INR at 90: Can the RBI Halt the Rupee’s Slide in 2026?The Indian rupee stands at a historic crossroads. As 2025 concludes, the currency hovers precariously near the 90.00 psychological barrier. While the Reserve Bank of India (RBI) maintains a defensive posture, a combination of record capital flight and geopolitical friction creates a challenging environment for the year ahead.
Geopolitics and the Tariff Storm
Trade tensions between Washington and New Delhi have intensified throughout 2025. The re-imposition of tariffs climbing as high as 50% on key Indian exports has strained the bilateral trade balance. Major sectors like jewellery, automotive parts, and electronics now face shrinking margins and reduced global demand.
This protectionist environment discourages foreign direct investment (FDI). Investors remain cautious as they await a potential trade deal. Without a diplomatic breakthrough, the "tariff overhang" will continue to pressure the rupee toward weaker levels in early 2026.
Record Capital Flight: The FII Exodus
The year 2025 marked a historic turning point for Indian capital markets. Foreign Institutional Investors (FIIs) pulled a record ₹1.58 lakh crore ($18 billion) from Indian equities. High domestic valuations and rising US Treasury yields prompted this massive rotation of capital back toward developed markets.
While Domestic Institutional Investors (DIIs) provided a cushion through steady SIP inflows, they could not fully offset the currency impact. This exodus has effectively removed a primary source of dollar supply, leaving the rupee vulnerable to every spike in global volatility.
Management & Leadership: The RBI’s Defensive Play
The Reserve Bank of India has adopted a "controlled depreciation" strategy. RBI leadership intervened frequently near the 90.00 mark, selling dollars through state-run banks to prevent a chaotic collapse. This proactive management provides the market with a "tacit floor."
Traders now view the 90 level as a critical pivot point. The central bank's leadership must balance currency stability with the need to keep Indian exports competitive. If the RBI softens its stance, the path of least resistance leads toward 91.50 by mid-2026.
Macroeconomics: A Tale of Two Central Banks
The Federal Reserve and the RBI are navigating diverging paths. In December 2025, the Fed delivered its third consecutive interest rate cut to 3.5%–3.75%. However, hawkish language in the Fed minutes suggests a slower pace of cuts for 2026.
In contrast, the RBI’s recent 25 basis point cut aims to boost domestic growth (forecast at 7.3% for FY26). This narrowing interest rate differential often makes the rupee less attractive for "carry trades," further supporting a bullish USD/INR trend.
Indicator Current Status Impact on Rupee
Oil Prices $61.70 (Brent) Positive (Lower import costs)
US Tariffs Up to 50% Negative (Export pressure)
FPI Flows Record Outflow Negative (Dollar scarcity)
GDP Growth 7.3% (Projected) Positive (Long-term resilience)
Technology and the Future of Trade
Innovation in "Cyber-traceability" and blockchain-based supply chains is becoming vital for Indian exporters. These technologies help firms bypass some regulatory hurdles by proving compliance with global standards.
Patent analysis reveals that Indian firms are rapidly filing for high-tech manufacturing processes. This shift toward high-value, patent-protected exports could eventually reduce India's structural trade deficit. However, the currency benefits of these innovations will take years to materialise.
2026 Prediction: Consolidation Before Clarity
The USD/INR pair will likely consolidate between 89.50 and 91.00 in the first quarter of 2026. The "invisible hand" of the RBI will prevent a vertical spike, but the lack of foreign inflows remains a major hurdle.
Smart traders should watch for the signing of a US-India trade deal. A successful agreement would act as the ultimate "Buy" signal for the rupee, potentially triggering a sharp recovery toward the 88.00 handle.

10-Year Treasuries Into FOMC: What to Expect1. Big Picture: What’s Been Driving Bonds?
Over the past several months, the U.S. Treasury market has been defined by diverging forces across the curve, the short end (2Y, 5Y) pricing near-term monetary policy outcomes and the long end (10Y, 30Y) reflecting inflation persistence, fiscal supply, and long-horizon term premium.
The short end has behaved like a proxy for rate-cut expectations, compressing aggressively whenever inflation cools or recession probability ticks higher. Meanwhile, the long end has been more sensitive to duration demand, bond auctions, and forward-looking macro risk, often moving independently when supply shocks or inflation surprises hit the tape.
The result? A curve driven by two narratives: policy timing vs long-run risk.
This sets the stage for next week’s meeting and the reaction likely depends less on the cut itself and more on the messaging around rate trajectory.
2. What did the Market do?
Following the U.S.–China tariff escalation in April (formerly referred to casually as the “Trump Tariff War,” though a better description is the Tariff Re-Escalation Phase), the ZN stabilized. Buyers stepped in between May to July 2025, compressing price toward the 112'08'0 region, which is a key daily resistance zone.
In early September, momentum shifted. Buyers overwhelmed offers and lifted prices through 112'08'0, and the move appears linked to expectations of a softer policy stance and improving forward inflation indicators during the first week of September.
Sellers responded at 113'07'0 area and market has been trapped in a three-month range between 113'25'0 high and 112'08'0 low.
This week, price rotated from the top of range and swept through the composite LVN 113'00'0 to 112'24'0, near the 1st 3 weeks of November composite VPOC.
3. What to Expect: Scenarios Into FOMC Week
Until the rate decision, compression seems likely.
Expect 2 way indecision before FOMC:
Expect two-way trade between 113'03'0 (LVN) and 112'24'0 (1st 3 weeks of Nov composite VPOC) as the market waits for the FOMC.
Bearish Scenario (Base case):
If sellers hold at 113'03'0, continuation lower toward 112'07'0 (range low / composite VAL)
Bullish Scenario:
If buyers reclaim 113'03'0 decisively, possible market move back up to 113'23'0 (Daily Range high), keeping the multi-month balance intact and potentially positioning for a breakout if FOMC guidance surprises dovish.
4. FOMC Risk: What Could Surprise the Market?
The market is currently pricing ~88.6% probability of a 25bps cut which means the cut itself is not the event. The surprise lies in the tone.
🟢 Bullish Bond Reaction (Yields lower) if:
Forward guidance hints at a sequence of cuts, not a one-off
Growth risks emphasized > inflation risks
Dovish dissent or language suggesting easing bias remains intact
🔴 Bearish Bond Reaction (Yields higher) if:
The Fed downplays future cuts or signals higher-for-longer
Inflation risk is prioritized
Dot-plot or press Q&A implies only one cut on table
Conclusion
Unless the press conference delivers a clear dovish or hawkish surprise, expect a similar indecisive, two-way response in the markets, similar to past FOMC market reactions.
What’s your call on ZN and the bond markets going into the week of FOMC? Drop a comment and give a boost so more traders can weigh in.
Disclaimer: This is not financial advice. Analysis is for educational purposes only; trade your own plan and manage risk.

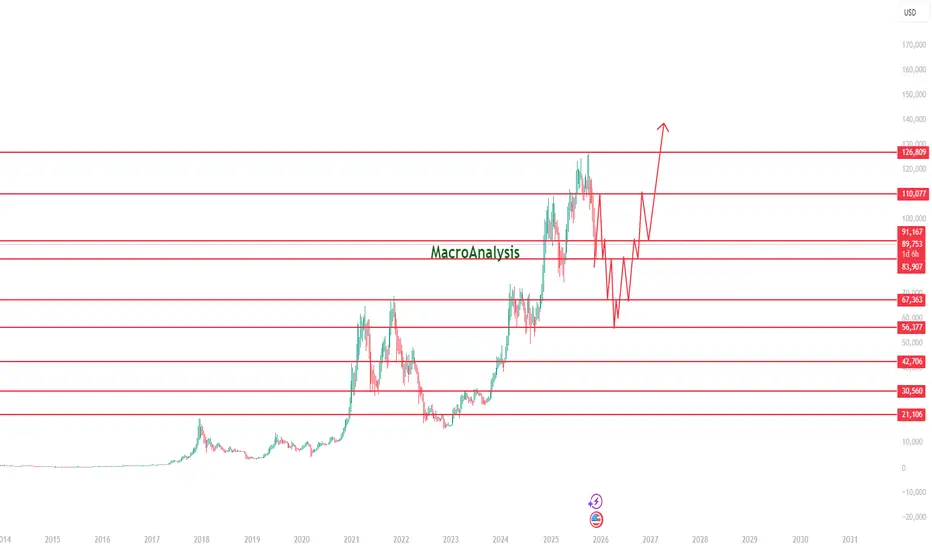
BTC Macro Roadmap: Multi-Year Support/Resistance Structure & ProThis chart presents a long-term BTC roadmap based on major weekly and monthly support/resistance zones, reflecting how BTC typically behaves during mid-cycle phases. Price has recently reacted to the 110K macro resistance, triggering a corrective leg that fits the broader rhythm of previous BTC cycles.
The projected path highlights a realistic multi-stage structure:
• Mid-Cycle Corrective Phase
BTC is forming lower highs and lower lows after the rejection from 110K, with a likely retest of key demand zones between 83K → 67K. Deeper liquidity sweeps into the 56K region remain possible before establishing a macro higher low.
• Accumulation Zone
Inside this lower region, BTC historically creates sideways, choppy movement—sweeping liquidity both directions as market participants reposition. This mirrors prior mid-cycle accumulation phases and sets the foundation for the next macro advance.
• Recovery Phase & Re-Accumulation
Once accumulation stabilizes, structure favors a recovery back toward 91K → 110K, driven by regained momentum and market strength. A successful breakout from this zone signals the beginning of the next expansion wave.
• Macro Expansion Phase
Clearing 110K opens the door toward 126K–140K, the next major macro resistance region and potential cycle extension target.
This idea isn’t a prediction—it’s a structural map, focused on how BTC historically behaves around cycle midpoints: parabolic advance → correction → accumulation → breakout → expansion. The chart emphasizes market memory, key levels, and BTC’s typical volatility during expansion phases.
Macro Levels to Watch:
• 110,077 – major resistance, recent rejection zone
• 91,167 / 89,688 – mid-level pivot controlling short-term direction
• 83,907 – key support that preserves bullish structure
• 67,363 – strong historical demand and liquidity magnet
• 126,809 – next major resistance above ATH
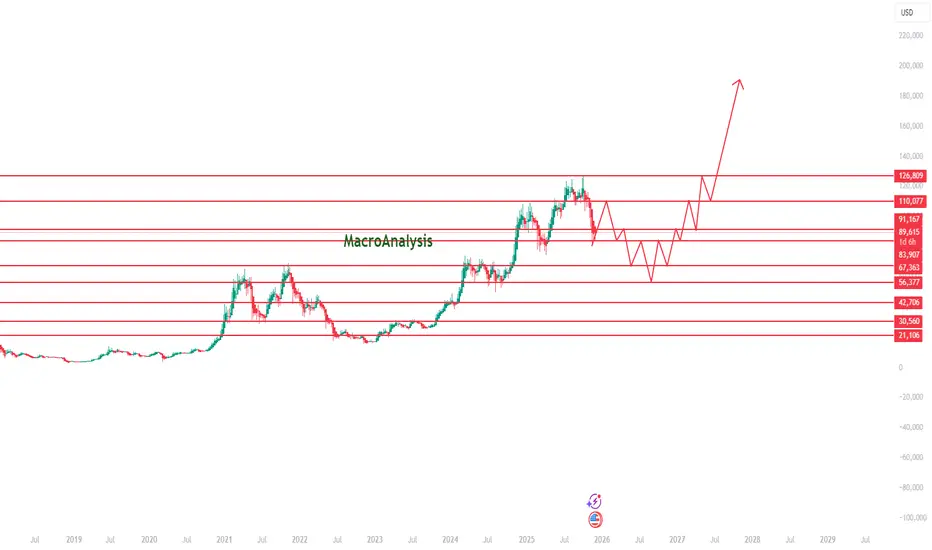
BTC Macro Roadmap: Multi-Year Support/Resistance StructureThis chart presents a long-term BTC roadmap based on major weekly and monthly support/resistance zones, reflecting how BTC typically behaves during mid-cycle phases. Price has recently reacted to the 110K macro resistance, triggering a corrective leg that fits the broader rhythm of previous BTC cycles.
The projected path highlights a realistic multi-stage structure:
• Mid-Cycle Corrective Phase
BTC is forming lower highs and lower lows after the rejection from 110K, with a likely retest of key demand zones between 83K → 67K. Deeper liquidity sweeps into the 56K region remain possible before establishing a macro higher low.
• Accumulation Zone
Inside this lower region, BTC historically creates sideways, choppy movement—sweeping liquidity both directions as market participants reposition. This mirrors prior mid-cycle accumulation phases and sets the foundation for the next macro advance.
• Recovery Phase & Re-Accumulation
Once accumulation stabilizes, structure favors a recovery back toward 91K → 110K, driven by regained momentum and market strength. A successful breakout from this zone signals the beginning of the next expansion wave.
• Macro Expansion Phase
Clearing 110K opens the door toward 126K–140K, the next major macro resistance region and potential cycle extension target.
This idea isn’t a prediction—it’s a structural map, focused on how BTC historically behaves around cycle midpoints: parabolic advance → correction → accumulation → breakout → expansion. The chart emphasizes market memory, key levels, and BTC’s typical volatility during expansion phases.
Macro Levels to Watch:
• 110,077 – major resistance, recent rejection zone
• 91,167 / 89,688 – mid-level pivot controlling short-term direction
• 83,907 – key support that preserves bullish structure
• 67,363 – strong historical demand and liquidity magnet
• 126,809 – next major resistance above ATH
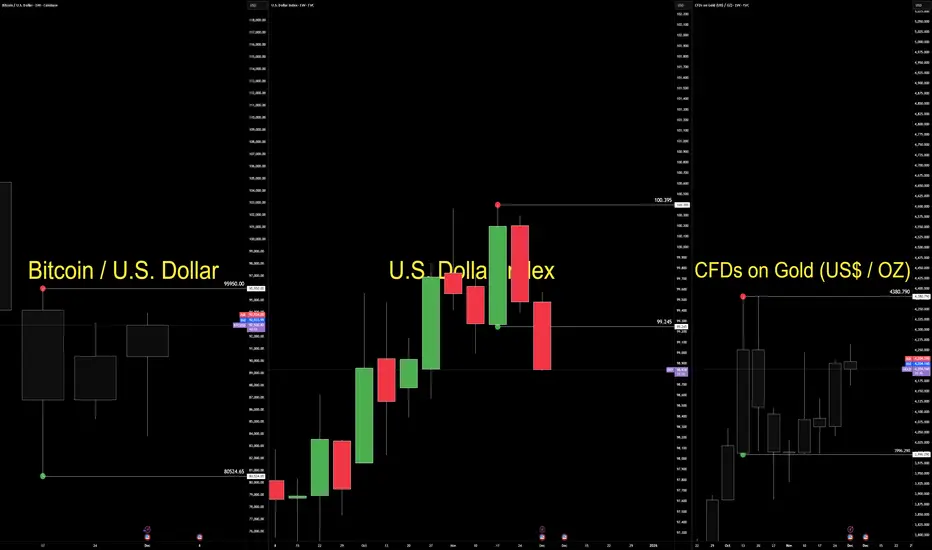
The Dollar Isn’t Falling. It’s Being Repriced.The dollar didn’t weaken because of a single headline.
It weakened because two forces aligned at the same moment—policy certainty and political uncertainty.
Futures now price a full December rate cut.
That removes the dollar’s yield premium and lifts liquidity expectations.
But the bigger shift is political.
Odds have increased that Kevin Hassett could replace Jerome Powell as Fed Chair.
Markets understand the implication: potential pressure on Fed independence.
Currencies respond quickly to credibility risk.
EURUSD strengthened.
Gold firmed.
Bitcoin stabilized despite its bearish structure.
Now the technical side.
The dollar still trades inside a bullish consolidation between 99.245 and 100.395.
Structure is intact, but behaviour has shifted under the surface.
Pressure is building inside the box.
Gold holds a weekly bullish consolidation above 3996.290.
Price is absorbing quietly—typical when investors hedge independence risk.
Bitcoin remains in a weekly bearish consolidation between 95,950 and 80,524.
A rare decoupling from the debasement narrative.
The macro story supports upside, but structure has not yet released.
This environment demands a behaviour-first lens.
Market Structure maps the containment.
Geometry shows the compression.
Volume Flow reveals participation rotation.
Order Flow exposes intent before trend.
Execution depends on pressure validation, not prediction.
Today is not a trend shift.
It is a credibility repricing.
The dollar hasn’t lost structure.
It has lost premium—while gold and crypto absorb the early rotation of capital into assets less dependent on institutional stability.
When policy becomes predictable and leadership becomes political, markets adjust before headlines explain why.
— CORE5DAN
Institutional Logic. Modern Technology. Real Freedom.
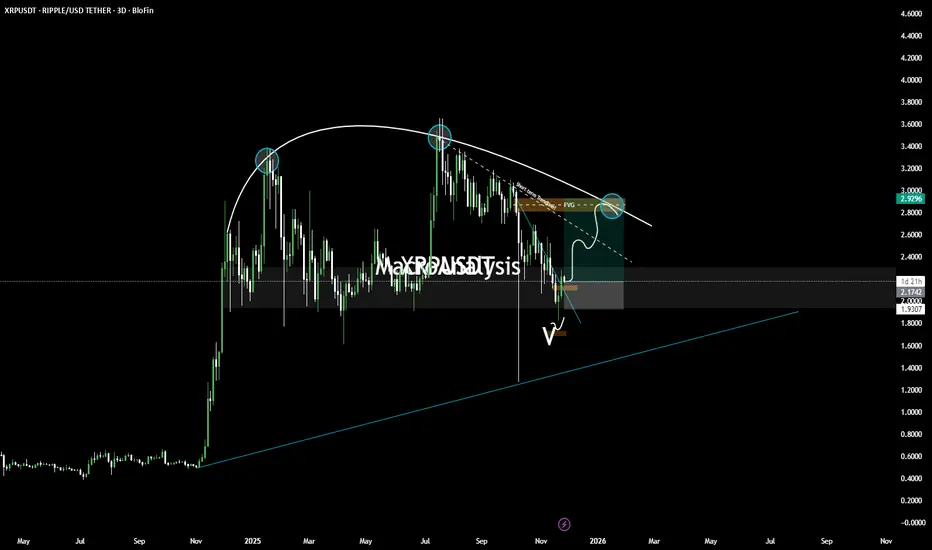
XRP — Major Macro Reversal Loading? XRP is completing a long-term structural pattern that has been developing for months. This setup includes a rounded top distribution, a full breakdown into major demand, and a potential reversal structure forming at the bottom.
This idea outlines both bullish and bearish pathways based on higher-timeframe confluence.
🔍 1️⃣ Rounded Top Distribution Completed
XRP formed a clear rounded top on the macro chart, with three major distribution points (highlighted).
Each point shows diminishing momentum and repeated rejection from the declining macro trendline.
This structure typically precedes:
Liquidity sweep lower
Long accumulation phase
Then high-timeframe reversal
We’re now entering the second phase.
🔍 2️⃣ Price Now Sitting in Major Higher-Timeframe Demand
Price has dropped directly into a large daily/3D demand block that held all previous macro corrections.
This zone aligns with:
Old imbalance fills
Breaker structure retest
Long-term ascending trendline below (blue line)
This is where macro buyers have stepped in before — and may do so again.
🔍 3️⃣ Bullish Scenario (Blue Path)
If price confirms demand strength, the bullish pathway is:
Sweep of local V-shaped liquidity
Retest of micro trendline (white dashed)
Break above the short-term breaker + FVG layer
Move toward the $2.95–$3.10 area (macro rejection zone)
This is the first major upside target.
A full reclaim above this level opens the door for a much larger trend reversal.
🔍 4️⃣ Bearish Scenario (White Path)
If demand fails, watch for:
Deviation above micro resistance
Rejection from FVG / breaker
Breakdown of V-swing formation
Deeper move toward long-term trendline support below
This would create a deeper macro accumulation before any major bullish cycle.
🎯 Summary
XRP is at a macro inflection point
We have:
Completed distribution
Full retest of long-term demand
Early signs of reversal structure
Clear upside targets and invalidation levels
This is a high-timeframe educational structure outlook, not a signal.
📘 Disclaimer
This post is for educational purposes only and reflects personal market analysis. It is not financial advice or a trade signal. Always DYOR and manage your own risk.
Bitcoin Bear Market 2026 | Macro Cycle & Rising Wedge BreakdownBitcoin Macro Cycle Analysis (2013–2029) | Rising Wedge Breakdown • 2026 Bear Market Targets • Historical % Drops & Next Accumulation Zone
Bitcoin historical data strongly follows multi-year macro cycles , where each bull market has been followed by a deep bear market correction:
📉 2nd Cycle (2017–2018)
Top: 19,666 (17 Dec 2017)
Bottom: 3,122 (15 Dec 2018)
Correction: –84.23%
📉 3rd Cycle (2021–2022)
Top: 68,997 (8 Nov 2021)
Bottom: 15,479 (9 Nov 2022)
Correction: –76.64%
📉 4th Cycle (2025–2026 – Ongoing)
Top: 126,272 (6 Oct 2025)
Rising Wedge + Distribution Phase breakdown confirms bearish structure shift
Based on historical cycle behavior and on-chain indicators, Bitcoin has entered the 4th major bear market
📍 Projected Bottom Zone (2026)
Primary Support Zone:
➡️ $40,000 – $42,000 – $45,382
(Aligned with Wedge Breakdown + Macro Support)
Percentage-Based Targets:
–68.16% drop: → ≈ $40,000
–74% historical drop scenario: → ≈ $31,000 (max capitulation zone)
📅 Expected Bottom Window:
September – October 2026
→ Historically the strongest long-term buying opportunity .
📈 5th Cycle Expectations (2026–2029)
Bitcoin has been following a Long-Term Rising Wedge (Bearish Continuation / Reversal Pattern) since 2021.
This pattern is expected to fully complete by April 2029 → leading into a new long-term top and then the 5th bear market .
⭐ Why This Analysis Matters
Combines **cycle history**, **on-chain metrics**, **pattern analysis**, and **macro support zones**
Helps identify high-probability long-term Bitcoin accumulation levels
Useful for swing traders, long-term investors, and cycle-based portfolio strategies
🔔 If You Find This Analysis Helpful
👍 Like • 💬 Comment • ⭐ Save
It motivates me to share more high-quality Bitcoin cycle research!

PRE-LONDON CONDITIONS — DXY Range-Bound, Yields Slide, ES HeavyU.S. Dollar Index (DXY) holds a tight 98.99–99.59 range in a third consecutive inside bar.
U.S. 10-year yield drops ~1.01% in Asia.
U.S. 2-year yield falls ~1.27%.
S&P 500 futures (ES) extend lower toward the 6.571 fractal.
Gold tests support after filling imbalance.
Volatility remains elevated.
DXY — Dollar Index
Dollar stays inside 98.991–99.591.
Inside-bar stack remains unbroken.
Price sits near the 0.6 premium zone.
Neutral until London breaks the range.
Yields — 10Y & 2Y
10Y yield: -1.01% in Asia → long-end compression.
2Y yield: -1.27% → dovish policy tone.
Curve: both ends lower → risk-off positioning.
ES — S&P 500 Futures
ES moves lower toward 6.571.
Yesterday’s high-volatility expansion continues.
Tone remains defensive.
Gold — Safety Premium
Gold fills imbalance and presses into support.
Break = active safety flows.
Hold = passive bid.
Volatility
VIX closed pre-London.
Futures hold elevated regime.
Conditions favor fast intraday expansions.
Calendar Risk
Medium-tier data ahead.
Yesterday’s partial data production repeats → limited visibility.
Expect flow-driven moves until major prints arrive.
Execution View
DXY bias neutral inside range.
Yields down + ES down = risk-off.
Gold support = key inflection.
London expansion outside 98.99–99.59 sets direction.
Trade second move, not first spike.
Summary:
Dollar trapped. Yields lower. ES heavy. Gold at support.
Fragile pre-London environment; London’s first expansion defines the session.
— CORE5DAN
Institutional Logic. Modern Technology. Real Freedom.

BTCUSD | NEUTRAL BIAS | DAILY TIMEFRAME Bitcoin isn’t trending — it’s negotiating value.
Price is sitting deep in the discount zone of the broader bullish range while resting directly on the naked point of control at 94,353.90.
This is negotiation, not momentum.
Next week’s US Dollar data will decide whether participation expands or stays muted.
MSM — Market Structure Mapping (The Framework)
Price has rotated into the 74,420 → 126,402 deep-discount region.
Today’s candle prints inside-bar behaviour, meaning the market is compressing and trying to rebalance yesterday’s distribution lower.
This is not breakout behaviour — it’s value discovery.
VFA — Volume Flow Analytics (The Participation Map)
The 94,353.90 NPOC is the key behaviour hinge.
As long as price interacts with this level, participation remains cautious and undecided.
Value is being weighed — not chased.
OFD — Order Flow Dynamics (The Behavior)
Order flow leans bearish on the daily timeframe.
Yesterday’s 99,836 high → 93,984 low shows sellers pressing, but without meaningful delta expansion or aggressive continuation.
Intent here is defensive, not dominant.
PEM — Precision Execution Modeling (The Engagement Rules)
Market is in a controlled daily pullback phase.
The high-probability behaviour target sits below the 91,362 liquidity pool, where stops, inefficiency, and unfinished business remain.
Execution here must stay rule-driven — wait for confirmation, not anticipation.
- NEXT WEEK’S US DOLLAR DRIVERS TO WATCH
Bitcoin’s next move depends less on patterns and more on USD participation.
Key US events:
1. Industrial Production & Manufacturing Data
Weak = USD eases → crypto gains breathing room.
Strong = USD firm → risk assets remain cautious.
2. Housing Starts & Building Permits (High-Impact)
Often shift USD volatility and near-term sentiment.
3. FOMC Minutes + Fed Speaker Schedule
Hawkish tone → Dollar strength → BTC hesitation.
Dovish tone → Dollar ease → BTC participation improves.
4. US Budget & Broader Macro Releases
These feed directly into FX algos → crypto indirectly reacts through risk appetite.
Bitcoin will respond to flows, not predictions.
CORE5 Rule of the Day:
Don’t trade what you hope. Trade what participation confirms.
— CORE5DAN
Institutional Logic. Modern Technology. Real Freedom.

BTC/USD WEEKENDERBTC remains in a controlled downtrend, trading within a bearish range between 116.432 and 98.952, holding near the key 100.996 level. Thursday’s daily low was liquidated and sharply reclaimed — confirming absorption on both sides of the market. Price structure has now printed a fourth consecutive inside day, showing compression while red daily highs remain exposed. Yesterday’s New York session stretched higher into the close, keeping short-term bias constructive within the broader range.
The current plan into the weekend is to monitor for a measured retracement toward the 105.000 area — a zone aligning with short-term equilibrium inside the larger bearish range. This level provides a clean reference for liquidity behavior and potential continuation signals into next week.
The IMF warned this week of rising global risk complacency, with high debt and inflated assets raising the chance of a sharper correction. Meanwhile, crypto shows quiet structural strength beneath the surface. Whales absorbed around 30,000 BTC and 400,000 ETH this week near the 100.996 volatility low, aligning with steady ETF inflows and falling exchange balances.
Smart money moves first — absorption always precedes expansion.
Discipline defines conviction, not direction.
— Institutional Logic. Modern Technology. Real Freedom.

Why Bitcoin’s 4-Year Cycle Might Be Its Biggest LimitationFor years, traders have treated Bitcoin’s 4-year halving as sacred — a mechanical driver of boom and bust. But what if the real reason these cycles repeat isn’t the code… but the crowd?
Mechanically, Bitcoin’s issuance schedule is a smooth, predictable decline. The halving simply adjusts the slope of supply — it doesn’t dictate price. Yet, like clockwork, markets rise and fall every four years. Why?
Because we expect them to.
This expectation creates a self-fulfilling feedback loop:
- Pre-halving optimism fuels accumulation and speculative positioning.
- Post-halving euphoria drives parabolic rallies as new participants flood in.
- Overvaluation and leverage eventually unwind, triggering brutal corrections.
The halving became the metronome of market psychology — a narrative so powerful that it shaped behavior more than fundamentals ever did.
🧠 The Institutional Shift
Now, that narrative is being rewritten.
Institutions don’t trade on memes or cycles — they trade on models, liquidity, and risk.
Unlike retail investors, institutions hate volatility. They don’t chase euphoria; they manage exposure.
- ETFs and funds accumulate steadily through structured inflows.
- Option and futures desks hedge risk dynamically, suppressing volatility.
- Algorithmic allocators rebalance based on Sharpe ratios, not halving hype.
This structural participation acts as a volatility dampener — flattening the amplitude of Bitcoin’s historic boom-bust waves.
🌍 From “Halving Cycle” to “Liquidity Cycle”
As Bitcoin matures, the real driver of its price action is shifting away from internal events and toward macro liquidity conditions :
- When global liquidity expands (rate cuts, QE, easing credit), Bitcoin thrives.
- When liquidity contracts (rate hikes, QT, risk-off sentiment), Bitcoin cools.
In this new phase, the halving’s scarcity still matters — but it’s no longer the heartbeat.
Instead, Bitcoin is syncing to the rhythm of global capital flows.
📈 The New Market Identity
We’re watching Bitcoin transition from a reflexive narrative asset to a macro-integrated store of value .
If this continues, the implications are profound:
- Shallower drawdowns and fewer liquidation cascades.
- More consistent accumulation across cycles.
- Higher institutional allocation as volatility compresses.
Ironically, the same psychological loop that once fueled Bitcoin’s meteoric rise may now be what caps its potential.
The halving didn’t make Bitcoin cyclical — investor behavior did .
And as smart money takes over, that feedback loop may finally be breaking.
🚀 What This Might Mean for Future Bull Runs
If institutions continue to dominate Bitcoin’s liquidity, the next bull runs may look less like fireworks and more like steady expansion — smoother, slower, but more sustainable.
Instead of 12-month parabolas followed by multi-year winters, we could see:
- Extended accumulation phases where price grinds higher over longer horizons.
- More efficient corrections that reset leverage without catastrophic selloffs.
- Reduced retail blow-off tops as narrative-based speculation loses power.
That doesn’t mean the explosive upside is gone — it means the path to higher valuations might look more like a compound growth curve than a recurring bubble.
The next phase of Bitcoin’s evolution isn’t about chasing the halving — it’s about understanding liquidity, positioning, and psychology on a global scale.
- The crowd traded Bitcoin like a story.
- Institutions are turning it into a system.

Gold XAUUSD Macro map for 27 to 31 Oct 2025Macro map for 27 to 31 Oct 2025
Concentration of policy and inflation prints means policy expectations and real yields will drive the United States dollar, global equities, bitcoin, and gold. The hinge events are Wednesday FOMC, Thursday US GDP advance and German data, Friday US Core PCE and Chicago PMI. Secondary drivers are BoJ policy guidance and ECB tone, plus BoC.
Watch list
Real ten year yield and the DXY dollar index after FOMC and PCE
EUR front end versus USD front end after ECB and FOMC
VIX around the FOMC window and into PCE
US liquidity windows around 14:00 Eastern on Wednesday and 08:30 Eastern on Thursday and Friday
Gold outlook for next week
Set up
Gold trades the sign and size of moves in real yields and the dollar. Policy guidance and inflation prints are therefore the core drivers. A patient or cautious Fed, softer Core PCE, and any rise in macro uncertainty support gold through lower real yields and safe haven demand. A hawkish tilt and firmer PCE pressure it by lifting the opportunity cost of holding a non yielding asset.
Baseline view
The tape prefers a slow glide toward price stability without a growth accident. That backdrop keeps real yields contained or drifting lower and supports gold on dips. The opposite mix lifts real yields and weighs on the metal. Flows often scale in after the first spike around FOMC and PCE once spreads and liquidity stabilize.
Scenarios and probabilities
Upside continuation or breakout. Probability forty. Triggers are a patient FOMC and cooler PCE that push real yields down. A softer dollar would reinforce the move.
Balanced consolidation inside the recent weekly band. Probability thirty. Triggers are mixed signals across events and no major shift in real yields.
Pullback to prior support. Probability thirty. Triggers are firmer PCE or hawkish communication that lifts real yields. Dollar strength would confirm.
Key confirms and risks
Track the ten year real yield and the DXY. If real yields fall while the dollar is flat the setup still favors gold. If both rise, risk control becomes priority. Liquidity can thin quickly in the first minutes after data and during press events. Use predefined risk units and avoid adding into fast markets.

BTCUSD 1W Chart – The Cyclical Geometry of Bitcoin MarketsA close examination of Bitcoin’s long-term structure reveals a striking symmetry between its bull and bear phases. The last two bear markets each lasted 364 days, while the two subsequent bull runs expanded for 1,064 days — a rhythm so precise it reflects the mechanical heartbeat of Bitcoin’s market cycles.
Following the 2020 halving, Bitcoin rallied +2,105% over 1,064 days, peaking at $69,000 in 2021. The previous cycle delivered an even greater +18,044% rally, followed by an -84% correction that defined the next macro bottom.
The current cycle, post Halving 2024, continues to mirror this same time symmetry with remarkable accuracy. If history holds, the projected top should arrive roughly 1,064 days after the Halving — around late 2026 — with a potential target zone between $143K and $146K, adjusted for performance decay over time.
However, if the market breaks this cyclical rhythm, it would mark the first major deviation in Bitcoin’s historical pattern. Such a break would not just disrupt the four-year cycle theory — it could signal the birth of a Supercycle, a multi-year parabolic expansion phase driven by institutional adoption, sovereign participation, and macro liquidity shifts.
Until then, all evidence still supports an ongoing reaccumulation phase within the broader bull structure.
Bitcoin’s 364-day downtrend → 1,064-day expansion remains one of the cleanest repeating geometries in financial history a rhythm that could either repeat once more or evolve into something far greater.
-CryptoPASOK

Powell Signals the End of QT — Relief Rally or the Calm Before?First, let’s look at the key points from Powell’s remarks at the 67th Annual Meeting of the National Association for Business Economics (NABE):
* The future path of monetary policy will depend on the assessment of data and risks.
* The balance sheet remains a vital tool of monetary policy.
* Fed officials will discuss the composition of the balance sheet.
* Balance sheet reduction (QT) could come to an end in the coming months.
* Inflation remains on an upward trajectory.
* The labor market shows signs of notable downside risks.
From this set of statements, my conclusion is that if the Fed and Powell start speaking more decisively about ending QT and halting balance sheet reduction, it would be highly significant.
It would indicate that the Fed is becoming increasingly concerned about the future of the labor market — and likely signals more aggressive and deeper rate cuts ahead.
Halting the balance sheet reduction while simultaneously cutting rates could provide some support to the U.S. economy and ease pressure on equities and financial markets.
However, if QT is paused but unemployment continues to rise, we should expect a sharp downturn in financial and equity markets.
Overall, given Powell’s dovish tone, my trading bias remains bearish, unless a strong technical reversal emerges.
That said, the U.S.–China trade tensions currently carry even greater importance in shaping market direction.

I'm still long biased @ $XAUUSD (but deleveraging)Technical View
A potential bullish cup & handle pattern is forming, often seen as a continuation signal.
Price has already broken out of a bearish channel, which suggests that buyers have taken control.
Triangle and wedge formations point to pressure building upward.
The broader macro channel remains intact, so the larger trend has not been broken.
Clear invalidation levels are visible near 3,730 and 3,612, which provides trade structure from a technical perspective.
Overall, the technical picture continues to lean bullish.
Macro View
US CPI remains sticky while jobless claims are softening, hinting at stagflation dynamics.
The Federal Reserve is under pressure to cut rates, with real interest rates already negative.
Historically, when real rates are negative, gold tends to outperform bonds as a store of value.
Global central banks remain net buyers of gold as they diversify away from Treasuries.
This combination is similar to the 1970s stagflation backdrop: falling rates with inflation uncertainty often encouraged capital flows into gold.
Opinion
Technicals suggest upward momentum. Macro factors also support a bullish bias. The main caveat is that positioning in gold is already heavy, which can lead to sharp short-term volatility. Directionally, however, the long bias aligns with both the charts and the macro backdrop.
Disclaimer
This post reflects only my personal market observations and opinions, shared for educational and informational purposes. It should not be considered financial advice, investment recommendation, or a call to action. Trading financial markets involves risk, and you should carefully assess your own situation and risk tolerance before making any trading decisions. Past performance or historical patterns do not guarantee future results. Always do your own research and consult a licensed financial professional if needed.

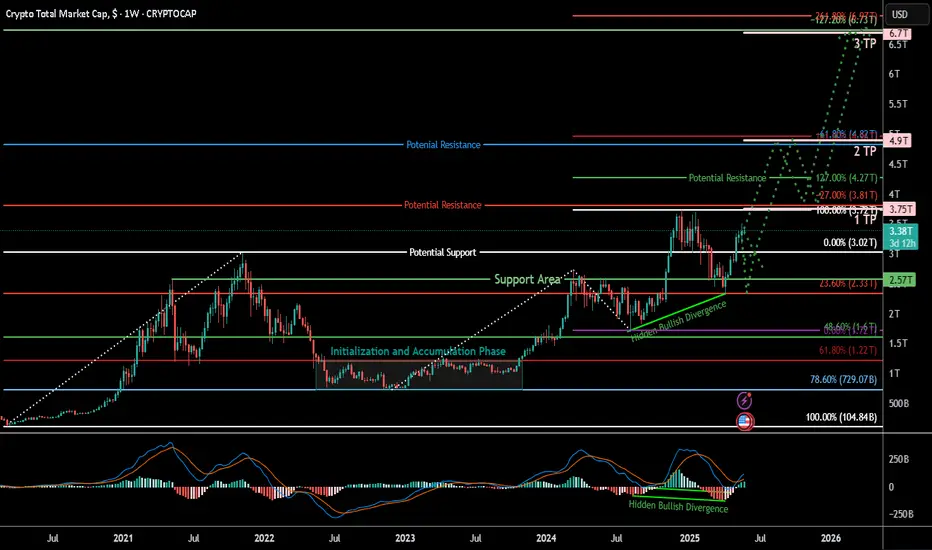
TOTAL Crypto Market Cap: Structural Breakout Aligns with Macros## 📊 TOTAL – Crypto Market Cap Ready for Expansion Phase?
---
### 🧵 **Summary**
The crypto market is showing signs of strong macro strength, with TOTAL reclaiming major support levels and forming a structurally bullish setup. Our multi-Fibonacci confluences and hidden bullish divergence point toward the possibility of a sustained breakout and new expansion leg toward \$4.9T and beyond.
This bullish view is further supported by powerful macro fundamentals expected over the next 8–10 months, including:
* Central bank rate cuts and liquidity expansion
* U.S. and EU regulatory clarity (stablecoins, ETFs, MiCA)
* Strong institutional adoption and geopolitical shifts
* Ethereum scaling upgrades and Bitcoin halving cycle effects
Together, these narratives form a compelling foundation for a broad-based market cap expansion.
---
### 📈 **Chart Context**
This is a **weekly chart of the TOTAL crypto market cap**, providing a bird’s-eye view of market cycles, macro structure, and capital flow across the entire ecosystem.
---
### 🧠 **Key Technical Observations**
* **Reclaim of \$3.02T level** (key support/fib level) signals macro bullish momentum.
* Market is forming **higher lows and bullish continuation structures**.
* **Support zones:** \$3.02T (reclaimed), \$2.57T (key pivot),
* **Resistance/TP zones:**
* **TP1 – \$3.75T** (100% trend-based fib + -27% retracement expansion)
* **TP2 – \$4.9T** (161.8% trend-based fib + -61.8% retracement expansion)
* **TP3 – \$6.9T** (261.8% fib extension target)
---
### 🧶 **Fibonacci Confluences and TP Logic**
We’ve employed both **standard Fibonacci retracement** and **trend-based extension** tools to build our target structure. The **1TP and 2TP zones** are defined by confluences between:
* **Retracement expansion levels** of **-27% and -61.8%**
* **Trend-based extension levels** of **100% and 161.8%**
If price reaches 2TP (~~\$4.9T) and **retraces toward the parallel legs** (100%–127%), this would confirm structural symmetry and open the door for a final push toward \*\*TP3 (~~\$6.9T)\*\* — the 261.8% extension.
---
### 🔍 **Indicators**
* **MACD Crossover** and rising histogram bars
* **Hidden Bullish Divergence** between MACD and price – a classic continuation signal
* Weekly trendline breakout from accumulation zone
---
### 🧠 **Fundamental Context**
While not directly charted, key macro catalysts like ETF approvals, global liquidity cycles, monetary easing, and increasing institutional interest will likely play a role in the next phase of expansion. This chart captures the structural readiness for that narrative.
## 📊 Fundamental Context (Extended Outlook: Mid-2025 to Early 2026)
Below is a detailed breakdown of upcoming macroeconomic, geopolitical, and crypto-specific developments sourced from:
* Bitwise Asset Management
* Fidelity Digital Assets
* ARK Invest
* CoinDesk, Reuters, Axios, WSJ
* CapitalWars, Cointelegraph, Coinpedia
* European Commission (MiCA regulations)
* U.S. Congressional records and SEC announcements
These events are chronologically aligned to support a structured macro bullish thesis for TOTAL market cap.
Bullish Crypto Catalysts (June 2025 – Feb 2026)
Summer 2025 (Jun–Aug): Monetary Easing and Regulatory Breakthroughs
Central Bank Policy Pivot: By mid-2025, major central banks are shifting toward easier policy. Market expectations indicate the U.S. Federal Reserve will stop tightening and begin cutting interest rates in 2025, with forecasts of up to three rate cuts by end-2025
bitwiseinvestments.eu
. Declining inflation and rising unemployment are pushing the Fed in this direction
bitwiseinvestments.eu
bitwiseinvestments.eu
. Easier monetary policy increases global liquidity and risk appetite, historically providing a tailwind for Bitcoin and crypto prices
bitwiseinvestments.eu
. In fact, global money supply is near record highs, a condition that in past cycles preceded major Bitcoin rallies
bitwiseinvestments.eu
. Should economic volatility worsen, the Fed has even signaled readiness to deploy fresh stimulus, which would inject more liquidity – “another tailwind for Bitcoin price growth”
nasdaq.com
.
Liquidity and Inflation Trends: With inflation trending down from earlier peaks, central banks like the Fed and European Central Bank are under less pressure to tighten. This opens the door for potential liquidity injections or QE if growth falters. Analysts note a strong correlation (often >84%) between expanding global M2 money supply and Bitcoin’s price rise
nasdaq.com
. There is typically a ~2-month lag for liquidity increases to flow into speculative assets like crypto
nasdaq.com
nasdaq.com
. The monetary easing expected in mid-2025 could therefore boost crypto markets by late summer, as new liquidity finds its way into higher-yielding investments. One projection even models Bitcoin retesting all-time highs (~$108K by June 2025) if global liquidity continues upward
nasdaq.com
– underscoring how “accelerated expansion of global liquidity” often aligns with crypto bull runs
nasdaq.com
.
U.S. Stablecoin Legislation: A landmark regulatory catalyst is anticipated in summer 2025: the first comprehensive U.S. crypto law, focused on stablecoins. The Senate has advanced the Guiding and Establishing National Innovation for U.S. Stablecoins (GENIUS) Act to a final vote
coindesk.com
. Passage of this bill (expected by mid-2025) would create a federal framework for stablecoin issuers, resolving a major regulatory gray area
coindesk.com
. Analysts call this “one of the most important regulatory developments in the history of crypto” – potentially even bigger than the approval of spot Bitcoin ETFs in impact
coindesk.com
. By enforcing prudential standards on stablecoin reserves and permitting licensed issuance, the law would legitimize stablecoins as a core part of the financial system. Bitwise predicts that clear rules could trigger a “multi-year crypto bull market,” with stablecoin market cap exploding from ~$245B to $2.5 trillion as mainstream adoption accelerates
coindesk.com
coindesk.com
. A U.S. law would also likely set a global precedent, encouraging other regions to integrate crypto-dollar tokens into commerce. Bottom line: expected stablecoin regulation in summer 2025 is a bullish game-changer, improving market integrity and unlocking new liquidity for crypto markets
coindesk.com
.
Regulatory Clarity in Europe: Meanwhile, Europe’s comprehensive MiCA regulations have fully taken effect as of late 2024, so by summer 2025 the EU has a unified crypto framework. This gives legal clarity to issuers, exchanges, and custodians across the 27-nation bloc
pymnts.com
skadden.com
. The harmonized rules (covering everything from stablecoin reserves to exchange licensing) are expected to expand Europe’s crypto market size by 15–20% in the coming years
dailyhodl.com
. With MiCA in force, firms can confidently launch crypto products EU-wide, and institutional investors have more protection. U.K. regulators are on a similar path – e.g. recognizing stablecoins as payment instruments – further globalizing the pro-crypto regulatory trend. By mid-2025, this regulatory thaw in major economies is improving investor sentiment. Goldman Sachs recently noted that 91% of crypto firms are gearing up for MiCA compliance – a sign that industry is preparing to scale under clearer rules
merklescience.com
merklescience.com
. Overall, the summer of 2025 marks a turning point: governments are embracing sensible crypto rules (rather than harsh crackdowns), reducing uncertainty and inviting institutional capital off the sidelines.
Initial ETF Impact: The first wave of U.S. spot crypto ETFs – approved in late 2023 and January 2024 – will have been trading for over a year by mid-2025
investopedia.com
. Their success is already far exceeding expectations: BlackRock’s iShares Bitcoin Trust amassed a record $52 billion AUM in its first year (the biggest ETF launch in history)
coindesk.com
, and other Bitcoin funds from Fidelity, ARK, and Bitwise quickly joined the top 20 U.S. ETF launches of all time
coindesk.com
. These products have unleashed pent-up retail and institutional demand by offering a regulated, convenient vehicle for crypto exposure
coindesk.com
. By summer 2025, ETF inflows are still robust, and many Wall Street analysts expect a second wave of approvals. Indeed, 2025 is being called “the Year of Crypto ETFs”
coindesk.com
. Observers predict dozens of new funds – including spot Ether, Solana, and XRP ETFs – could win approval under revamped SEC leadership in the post-2024 election environment
coindesk.com
. If so, late 2025 could see a broad menu of crypto ETF offerings, widening investor access to the asset class. This steady drumbeat of ETF launches and inflows adds a structural source of buy-pressure under crypto markets throughout 2025. (Notably, Bloomberg data showed over $1.7B poured into spot crypto ETFs in just the first week of 2025, on top of 2024’s flows
etf.com
.) In short, the ETF effect – “shocking the industry to its core” in year one
coindesk.com
– is set to grow even stronger in 2025, channeling more traditional capital into crypto.
U.S. Political Shift (Post-Election): The outcome of the Nov 2024 U.S. elections is a crucial backdrop by mid-2025. A new administration under President Donald Trump took office in January 2025 and immediately signaled a markedly pro-crypto policy stance. Within his first 100 days, Trump’s appointments to key financial agencies (SEC, CFTC, OCC) effectuated a “180° pivot” in crypto regulation from the prior administration
cnbc.com
. Industry observers describe a sharp policy reversal – where previously the sector faced hostility, now it’s courted as an engine of innovation. President Trump has publicly vowed to be “the first crypto-president,” hosting crypto industry leaders at the White House and promising to boost digital asset adoption
reuters.com
. He even floated creating a strategic Bitcoin reserve for the United States
reuters.com
– a striking show of support for Bitcoin’s role as a reserve asset (though it remains to be seen if this materializes). More tangibly, regulatory agencies have begun rolling back onerous rules. For example, the SEC under new leadership scrapped a prior accounting guideline that made bank crypto custody prohibitively expensive
reuters.com
. And the Office of the Comptroller of the Currency (OCC) has “paved the way” for banks to engage in crypto activities like custody and stablecoin issuance
reuters.com
. These changes in Washington brighten the outlook for crypto markets: with regulatory uncertainty fading, U.S. institutions feel more confident to participate. In essence, by mid-2025 the world’s largest capital market (the U.S.) is shifting from impeding crypto to embracing it, a narrative change that cannot be overstated in its bullish significance
coindesk.com
reuters.com
.
Geopolitical Easing and BRICS Actions: Global macro conditions in summer 2025 may also improve due to geopolitical developments. If major conflicts (like the Russia-Ukraine war) de-escalate or move toward resolution by late 2024 or 2025, it would remove a key source of risk-off sentiment. Lower geopolitical risk and easing of war-driven commodity shocks would help cool inflation (especially energy prices) and bolster global growth – factors that support risk asset rallies (crypto included). On another front, the BRICS nations (Brazil, Russia, India, China, South Africa + new members) are continuing their de-dollarization agenda in 2025. At the BRICS summit in October 2024, they discussed creating a new gold-backed reserve currency (“the Unit”) as an alternative to the U.S. dollar
investingnews.com
. They also announced a BRICS blockchain-based payment network (“BRICS Bridge”) to connect their financial systems via CBDCs, bypassing Western networks
investingnews.com
. Going into 2025, these initiatives are expected to progress (with Russia currently chairing BRICS). While a full-fledged BRICS currency may be years away (and faces hurdles
moderndiplomacy.eu
), the bloc’s move to settle more trade in non-USD currencies is already underway (by 2023, roughly 20% of oil trades were in other currencies)
investingnews.com
. Implication: A shift toward a more multi-polar currency world could weaken U.S. dollar dominance over time
investingnews.com
. For crypto, this trend is intriguing – as nations seek dollar alternatives, Bitcoin’s appeal as a neutral, supranational asset may rise. In sanctioned or economically volatile countries, both elites and the public might accelerate adoption of crypto for cross-border value storage. For example, U.S. sanctions on Russia and China have already catalyzed talk of reserve diversification
investingnews.com
. Fidelity analysts note that “rising inflation, currency debasement and fiscal deficits” globally are making Bitcoin strategically attractive for even nation-states and central banks
coindesk.com
coindesk.com
. Summing up: a backdrop of improving geopolitical stability (if realized) plus a weakening dollar regime provides a bullish macro and narrative case for borderless cryptocurrencies as we enter the second half of 2025.
Fall 2025 (Sep–Nov): Institutional Inflows, Adoption & Tech Upgrades
Surging Institutional Adoption: By autumn 2025, the cumulative effect of regulatory clarity and market maturation is a wave of institutional adoption unlike any prior cycle. In traditional finance, major U.S. banks and brokers are cautiously but steadily entering the crypto arena. Reuters reports that Wall Street banks are now receiving “green lights” from regulators to expand into crypto services, after years of hesitance
reuters.com
reuters.com
. Many top banks have been internally testing crypto trading and custody via pilot programs
reuters.com
. As one example, Charles Schwab’s CEO said in May 2025 that regulator signals are “flashing pretty green” for large firms, and confirmed Schwab plans to offer spot crypto trading to clients within a year
reuters.com
. Banks like BNY Mellon, State Street, and Citigroup – which collectively manage trillions – are expected to roll out crypto custody solutions by 2025, often via partnerships with crypto-native custodians
dlnews.com
. The OCC has explicitly authorized banks to handle crypto custody and stablecoins (under proper safeguards), removing a key barrier
reuters.com
. And the SEC’s friendlier stance under new leadership means banks no longer face punitive capital charges for holding digital assets
reuters.com
. The net effect is that by late 2025, institutional-grade crypto infrastructure is falling into place. More pension funds, endowments, and asset managers can allocate to crypto through familiar channels (regulated custodians, ETFs, prime brokers). Even conservative banking giants are warming up: Bank of America’s CEO stated the bank “will embrace cryptocurrencies for payments if regulations permit” and hinted at possibly launching a BOA stablecoin for settlement
reuters.com
. Likewise, Fidelity and BlackRock’s crypto units are expanding offerings after seeing outsized demand. This institutional legitimization dramatically expands the pool of potential investors in crypto markets, supporting a higher total market capitalization.
Crypto ETF Expansion: In Q4 2025, the roster of crypto-based ETFs and funds is likely to broaden further. As noted, analysts foresee 50+ crypto ETFs by end of 2025 under the pro-industry U.S. regulatory regime
coindesk.com
. By fall, we may see Ethereum spot ETFs (building on the successful Bitcoin products) and even funds for large-cap altcoins. For instance, Nate Geraci of The ETF Store predicts spot Solana and XRP ETFs are on the horizon in the U.S.
coindesk.com
. Internationally, Canada and Europe already have multiple crypto ETPs – their continued growth adds to global inflows. With a year of performance history by late ’25, crypto ETFs will likely start seeing allocations from more conservative institutions (insurance firms, corporate treasuries, etc.) that needed to observe initially. Fidelity’s strategists noted that in 2024 much of the ETF buying came from retail and independent advisors, but 2025 could bring uptake from hedge funds, RIAs, and pensions as comfort grows
coindesk.com
coindesk.com
. In summary, fall 2025 should witness accelerating capital inflows via investment vehicles, as crypto solidifies its place in mainstream portfolios. This sustained demand – “2025’s flows will easily surpass 2024’s” according to one strategist
coindesk.com
– provides a steady bid under crypto asset prices, reinforcing a bullish trend.
Nation-State and Sovereign Adoption: A notable development to watch in late 2025 is the entry of nation-states and public institutions into Bitcoin. Fidelity Digital Assets published a report calling 2025 a potential “game changer in terms of bitcoin adoption”, predicting that more nation-states, central banks, sovereign wealth funds, and treasuries will buy BTC as a strategic reserve asset
coindesk.com
. The rationale is that with rising inflation and heavy debt loads, governments face currency debasement and financial instability, making Bitcoin an attractive hedge
coindesk.com
. By Q4 2025, we could see early signs of this trend. For example, there are rumors that Russia and Brazil have explored holding Bitcoin reserves
fortune.com
, and Middle Eastern sovereign funds flush with petrodollars might quietly accumulate crypto as diversification. In the U.S., President Trump and crypto-friendly lawmakers like Senator Cynthia Lummis have openly discussed establishing a U.S. Bitcoin reserve or adding BTC to Treasury holdings
coindesk.com
. Lummis even introduced a “Bitcoin Reserve” bill in 2024, which if enacted would set a precedent for national adoption
coindesk.com
. While such bold moves might not happen overnight, even small allocations by governments or central banks would be symbolically massive. It would validate crypto’s role as “digital gold” and potentially ignite FOMO among other nations (a game theory dynamic Fidelity’s report alludes to). Thus by late 2025, any announcements of central banks buying Bitcoin or countries mining/holding crypto (similar to El Salvador’s earlier example) could spur a bullish frenzy. At minimum, the expectation of this “sovereign bid” provides a narrative supporting the market. As Fidelity’s analysts put it: not owning some Bitcoin may soon be seen as a greater risk for governments than owning it
coindesk.com
. Ethereum & Crypto Tech Upgrades: The latter part of 2025 is also packed with technological catalysts in the crypto sector, which can boost investor optimism. Chief among these is Ethereum’s roadmap milestones. Ethereum core developers plan to deliver major scaling improvements by end-2025 as part of “The Surge” phase
bitrue.com
. This includes fully rolling out sharding – splitting the blockchain into parallel “shards” – combined with widespread Layer-2 rollups, aiming to increase throughput to 100,000+ transactions per second
bitrue.com
. If Ethereum achieves this by Q4 2025, it would vastly lower fees and increase capacity, enabling a new wave of decentralized application growth. For users, that means faster, cheaper transactions; for the market, it means Ethereum becomes more valuable as utilization can skyrocket without bottlenecks. Progress is well underway: an intermediate upgrade (EIP-4844 “proto-danksharding”) was implemented earlier to boost Layer-2 efficiency, and the next major upgrade (code-named Pectra) is slated for Q1 2025 focusing on validator improvements and blob data throughput
fidelitydigitalassets.com
. After that, the final sharding implementation is expected. By late 2025, Ethereum’s evolution – including MEV mitigation (The Scourge) and Verkle trees for lighter nodes (The Verge) – should make the network more scalable, secure, and decentralized
bitrue.com
. These upgrades are bullish for the ecosystem: a more scalable Ethereum can host more DeFi, NFT, and gaming activity, attracting capital and users from traditional tech. Investors may speculate on ETH demand rising with network activity. Beyond Ethereum, other protocols (Solana, Cardano, Layer-2s like Arbitrum, etc.) also have roadmap milestones during this period, potentially improving their value propositions. Overall, the tech backdrop in late 2025 is one of significant improvement, which supports a positive market outlook – the infrastructure will be ready for mainstream scale just as interest returns.
Bitcoin Halving Aftermath: Although the Bitcoin halving took place in April 2024, its bullish impact historically materializes with a lag of 12-18 months. That puts late 2025 into early 2026 right in the window when the post-halving cycle may reach a euphoric phase. By fall 2025, Bitcoin’s supply issuance will have been at half its prior rate for ~18 months, potentially leading to a supply-demand squeeze if demand surges. ARK Invest notes that previous halvings (2012, 2016, 2020) all coincided with the early stages of major bull markets
ark-invest.com
. Indeed, by Q4 2025 we may see this pattern repeating. ARK’s analysts observed in late 2024 that Bitcoin remained roughly on track with its four-year cycle and expressed “optimism about prospects for the next 6–12 months” following the April 2024 halving
ark-invest.com
. That optimism appears well-founded if macro conditions and adoption trends align as discussed. By November 2025, Bitcoin could be approaching or exceeding its previous all-time high ( ~$69K from 2021) – some crypto analysts foresee six-figure prices during this cycle. Importantly, a rising Bitcoin tide tends to lift the entire crypto market cap. Late 2025 could see a broad rally across altcoins, often referred to as “altseason,” as new retail and institutional money, emboldened by Bitcoin’s strength, diversifies into higher-beta crypto assets. The expectation of the halving-driven bull cycle can itself become a self-fulfilling sentiment booster: investors position ahead of it, providing additional buy pressure. In summary, fall 2025 is poised to be the crescendo of the Bitcoin halving cycle, with historical analogues (2013, 2017, 2021) suggesting a powerful uptrend in crypto prices. Reduced BTC supply + peak cycle FOMO + all the fundamental drivers (ETF flows, low rates, tech upgrades) make this timeframe particularly conducive to a bullish market cap expansion.
Winter 2025–26 (Dec–Feb): Peak Momentum and Continued Tailwinds
Bull Market Momentum: Entering winter 2025/26, the crypto market could be in full bull mode. If the above developments play out, total crypto market capitalization may be approaching new highs by late 2025, driven by strong fundamentals and investor FOMO. Historically, the final leg of crypto bull markets sees parabolic gains and surging liquidity inflows. We might witness that in Dec 2025 – Feb 2026: exuberant sentiment, mainstream media coverage of Bitcoin “breaking records,” and increased retail participation. Unlike the 2017 and 2021 peaks, however, this cycle has far greater institutional involvement, which could imply more sustainable capital inflows (and possibly a larger magnitude of inflows). Key macro factors are likely to remain supportive through early 2026: central banks that began easing in 2024-25 may continue to hold rates low or even consider renewed asset purchases if economies are soft. For instance, if a mild U.S. recession hits in late 2025, the Fed and peers could respond with quantitative easing or liquidity facilities, effectively “printing” money that often finds its way into asset markets, including crypto
nasdaq.com
. China’s PBoC could also inject stimulus to boost growth, adding to global liquidity. Such actions would prolong the “risk-on” environment into 2026, delaying any end to the crypto uptrend. Additionally, global equity markets are projected to be strong in this scenario (buoyed by low rates and easing geopolitical tensions), and crypto’s correlation with equities means a rising stock tide lifts crypto too – as was observed in May 2025 when stock rallies coincided with BTC and ETH jumps
blockchain.news
blockchain.news
.
Investor Sentiment and Retail Revival: By early 2026, investor sentiment toward crypto could be the most bullish since 2021. With clear regulatory frameworks, high-profile endorsements (even governments buying in), and tech narratives (Web3, AI+blockchain, etc.), the stage is set for a positive feedback loop. Retail investors who largely sat out during the harsh 2022–23 bear market may fully return, spurred by “fear of missing out” as they see Bitcoin and popular altcoins climbing. This broadening of participation (from hedge funds down to everyday investors globally) increases market breadth and can drive total market cap to climactic heights. Notably, the availability of user-friendly investment onramps – e.g. spot crypto ETFs through any brokerage, crypto offerings integrated in fintech apps and banks – makes it much easier for average investors to allocate to crypto in 2025-26 than in past cycles. The removal of friction means inflows can ramp up faster and larger. Social media and pop culture hype also tend to peak in late-stage bulls; we might see Bitcoin and Ethereum becoming water-cooler talk again, drawing in new demographics. All of this contributes to strong sentiment and capital inflows in winter 2025/26, reinforcing the bullish outlook.
Continued Policy and Geopolitical Tailwinds: The policy landscape is expected to remain a tailwind into 2026. In the U.S., if the pro-crypto Trump administration stays aligned with its promises, we could see additional positive actions: perhaps tax clarity for digital assets, streamlined ETF approvals for more crypto categories, or even federal guidelines for banks to hold crypto on balance sheets. Such steps would further normalize crypto within the financial system. Regulatory coordination internationally might also improve – for example, G20 nations in 2025 have been working on a global crypto reporting framework and stablecoin standards, which, once implemented, reduce the risk of harsh crackdowns in any major economy. On the geopolitical front, the BRICS de-dollarization efforts might bear first fruit by 2026, such as increased trade settled in yuan, gold, or even Bitcoin. If Saudi Arabia (a new BRICS invitee) starts pricing some oil in non-USD, that could weaken dollar liquidity at the margins, and some of that displaced value might flow to alternative stores like crypto or gold. Additionally, by 2026 the world will be looking ahead to the next U.S. Presidential election cycle (2028) – typically, in the lead-up, administrations prefer supportive economic conditions. This could mean fiscal stimulus or at least no new financial regulations that rock markets, implying a benign policy environment for risk assets. In Europe, 2026 will see MiCA fully operational and possibly updated with new provisions for DeFi and NFTs, further integrating the crypto market. In sum, early 2026 should carry forward many of 2025’s positive drivers – ample liquidity, regulatory support, and growing mainstream acceptance – giving little reason to suspect an abrupt end to the bullish trend during this window.
Bitcoin Halving Cycle Peak: If history rhymes, the crypto market might reach a cycle peak somewhere around late 2025 or early 2026. Past bull cycles (2013, 2017, 2021) peaked roughly 12-18 months after the halving; a similar timeframe would put a possible top in the Dec 2025 – Feb 2026 period. That could mean Bitcoin at unprecedented price levels and total crypto market cap in multi-trillions, barring any unforeseen shocks. ARK Invest’s analysis as of late 2024 remained optimistic that Bitcoin was “in sync with historical cycles” and poised for strong performance into 2025
ark-invest.com
. By early 2026, those cycle dynamics (diminished new supply vs. surging demand) might reach a crescendo. One metric to watch is the stock-to-flow or issuance rate – post-halving Bitcoin’s inflation rate is below 1%, lower than gold’s, which can drive the digital gold narrative to its zenith at this point. Moreover, Ethereum’s upcoming transition to a deflationary issuance (with EIP-1559 fee burns and Proof-of-Stake) means ETH could also be seeing declining supply into 2026, potentially amplifying its price if demand spikes. Thus, both of the top crypto assets would have increasing scarcity dynamics during the period when interest is highest – a recipe for a dramatic run-up. Importantly, capital rotations within crypto during peak phases often send smaller altcoins skyrocketing (as investors seek outsized gains), temporarily boosting total market cap beyond just Bitcoin’s contribution. All told, the early 2026 period could represent the euphoric apex of this cycle’s bull market, supported by solid macro and fundamental fuel laid in the preceding months. Even if volatility will be high, the overall outlook through February 2026 remains strongly bullish for crypto’s total market capitalization, given the confluence of loose monetary conditions, favorable policy shifts, geopolitical diversification into crypto, institutional FOMO, and major network upgrades powering the narrative.
✨ Philosophical Reflection
In the ever-unfolding rhythm of cycles—accumulation, expansion, distribution, and reset—crypto mirrors the deeper architecture of nature and consciousness. Just as seeds lie dormant in winter awaiting the kiss of spring, so too does capital bide its time in the shadows before surging into momentum. The Fibonacci spirals found in shells, storms, and galaxies reappear in price action—offering not just numbers, but a language of emergence. What we witness in the TOTAL market cap is not just a breakout—it is a reawakening. A collective pulse of belief, liquidity, and intention. In this confluence of technical geometry and macroeconomic tides, the market becomes more than price—it becomes a story, a symbol, a signal. We don’t just analyze this chart—we read it like a sacred map, charting the ascent of value, vision, and velocity.
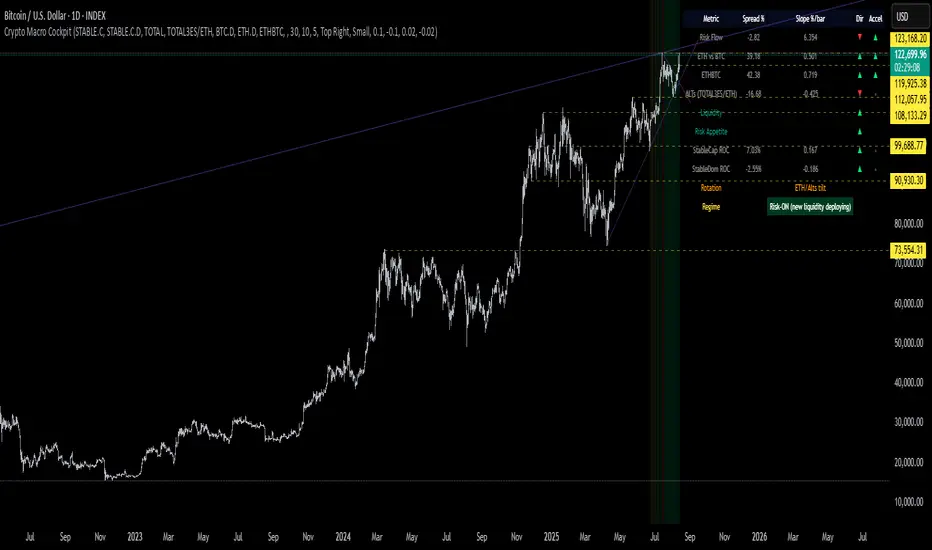
Crypto Macro Cockpit: Risk-ON Regime ConfirmedThis chart presents a live macro overlay for crypto markets using the new Crypto Macro Cockpit, a Pine Script-based dashboard that blends traditional flow metrics with institutional-era proxies.
We're currently reading a Risk-ON regime as fresh liquidity deploys into the system—confirmed across stablecoin metrics and sector rotation.
🔍 Key Insights
Risk Flow: Stablecoin cap is rising slower than total market cap → suggests active deployment (Risk-ON)
Liquidity Context: StableCap ROC at +7%, confirming real dry powder growth
Rotation: ETH vs BTC and ETHBTC both accelerating upward → ETH/Alts tilt
TOTAL3ES/ETH ratio: Softening short-term → confirms engineered altseason with ETH as the core liquidity channel
Macro Regime: Risk-ON (new liquidity deploying)
🧠 Thesis
This aligns with the Trojan Cycle thesis:
Institutional liquidity enters through safe, regulated channels (e.g. stablecoins), while synthetic altseasons are engineered to engage and extract liquidity from retail participants.
Legacy macro tools like M2 are no longer as effective. In today’s structure, stablecoin metrics offer real-time, blockchain-native liquidity signals.
- Stablecoin Market Cap reflects actual capital inflow (dry powder entering)
- Stablecoin Dominance proxies sentiment: declining = risk-on, rising = risk-off
- Their spread vs Total Market Cap reveals whether capital is being deployed or parked
As institutions and ETFs reshape market dynamics, this cockpit adapts.
M2 is out. Stablecoins are in.
⚠️ Disclaimer
This is not financial advice.
This script and dashboard are informational tools meant to support macro-level context and regime awareness—not trade signals.
Always do your own research.
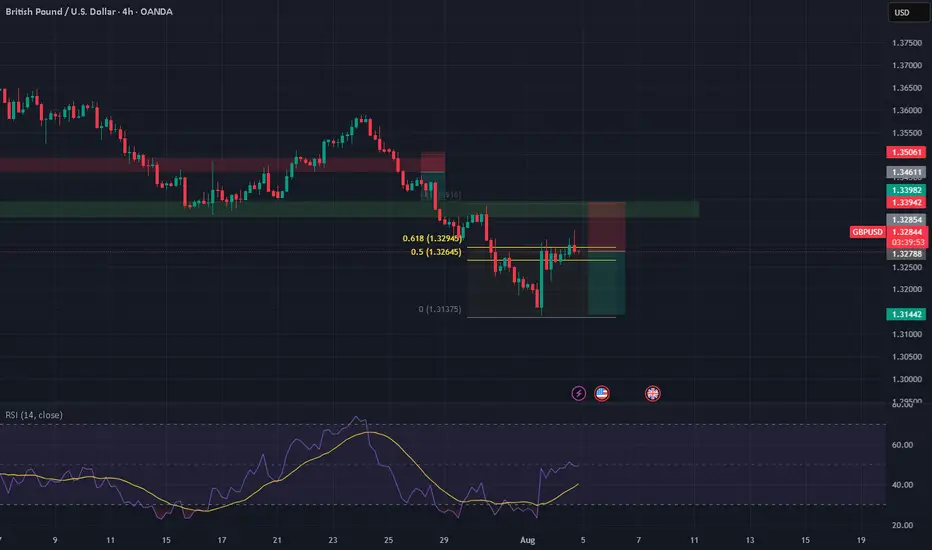
GBPUSD – Short Setup at Fibonacci Golden Pocket ZonePair: GBPUSD
Timeframe: 4H
Bias: Bearish retracement sell
🔍 Technical Outlook:
GBPUSD has retraced sharply from its recent low (1.3137) and is now testing a major resistance zone within the Fibonacci golden pocket (0.618–0.65 retracement) from the recent swing high to low:
This zone aligns with prior supply, creating a high-probability short setup.
🧠 Fundamentals + Sentiment
🇬🇧 GBP – Bearish Tilt
BOE's hawkish rate cut (25bps) failed to boost confidence due to internal voting splits and soft macro data.
Weak retail sales and flattening Services PMI signal slowing momentum.
CFTC data: Longs decreasing, net positioning weakening.
🇺🇸 USD – Defensive Strength
Fed holds at restrictive 4.25–4.50%, remains data-dependent.
US macro data like ISM Services and labor market stable.
USD gains from risk-off flows (VIX at 20.42), especially as GBP weakens.
🌐 Confluence Points:
❄️ Risk-off mood: favors USD safe-haven appeal
📉 GBP weakening across fundamentals
💡 Golden pocket = optimal area for trend continuation sell
📊 RSI suggests momentum exhaustion
✅ Conclusion:
GBPUSD is at a key sell zone, sitting within the Fibonacci golden pocket and prior supply. Unless bulls reclaim 1.3335, the path of least resistance is down. This is a textbook retracement short in line with macro and technical confluence.
NZDJPY – Bearish Momentum BuildingPair: NZDJPY
Timeframe: 4H
Bias: Bearish
🔍 Technical Setup:
NZDJPY has broken sharply from its recent consolidation and is now testing a critical 4H support zone near 87.00. A decisive break below this zone would open the path toward lower support levels.
📍 Entry Trigger: Break and close below 86.95
🎯 Target 1: 85.95
🛑 Stop Loss: Above 87.35
📉 RSI: Near oversold, confirming strong bearish pressure
This setup reflects a classic bearish continuation with momentum and structure aligned.
🧠 Fundamental + Macro Confluence:
🔻 New Zealand (NZD):
RBNZ cut rates to 3.25% citing weak inflation, growth slowdown, and spare capacity.
Employment data remains fragile; upcoming releases add downside risk.
NZD is under pressure due to falling export demand amid global trade tensions.
CFTC positioning shows longs reducing, net positioning weakening — sentiment turning bearish.
🔺 Japan (JPY):
Bank of Japan is gradually tightening — while still accommodative, the bias is shifting hawkish.
JPY benefits as risk-off sentiment grows — fueled by weak equity markets and rising VIX (20.42).
CFTC shows a massive drop in NNCs, aligning with institutional flows favoring JPY strength.
🌐 Risk Sentiment:
VIX > 20 confirms risk-off sentiment, bolstering safe-haven demand for JPY.
NZD, being a high-beta risk currency, weakens as global risk appetite fades.
Seasonal bias also aligns with weakness in NZD and strength in JPY.
📌 Final Take:
Macro, sentiment, and technicals all align for further downside in NZDJPY. Watch for a clean H4 close below 86.95 to confirm entry. This pair offers strong confluence — from central bank divergence to institutional flows and global volatility.

GBPJPY – Bearish Continuation Setup AheadPair: GBPJPY
Timeframe: 4H
Bias: Bearish
🔍 Technical Overview:
GBPJPY has broken down with high momentum and is now hovering at a 4H support zone (195.30). A clean break and close below this level opens the door for a deeper move toward the next support areas:
Entry Trigger: Break below 195.30
🎯 Target 1: 194.05
🎯 Target 2: 192.50
🛑 Stop Loss: Above 195.95 (previous resistance-turned-supply zone)
📉 RSI: 27.63 (Oversold but momentum-driven selloff suggests more downside)
🧠 Macro + Fundamental Confluence:
🏦 Central Bank Policy:
BOE (Bank of England) cut rates by 25bps (to 4.25%) in a hawkish tone, with internal disagreement (7–2 vote), signaling uncertainty and potential for further divergence.
Despite the “hawkish cut,” the market interpreted it cautiously, especially with falling UK economic momentum and weak retail data.
💴 Bank of Japan:
BoJ is slowly tightening policy — signaling an eventual exit from ultra-loose conditions.
Real interest rates remain negative, but the direction is now incrementally hawkish, strengthening the JPY across the board.
💡 Market Sentiment:
VIX at 20.42 = Risk-Off Environment → capital flows into safe-haven JPY, out of GBP.
With Nasdaq bullish, but volatility ticking up, JPY benefits from its safe-haven role.
📊 CFTC Positioning:
GBP: Longs decreasing, shorts rising, NNCs decreasing → Bearish bias
JPY: Longs flat, but massive drop in NNCs → institutional positioning is turning defensive
🧾 Economic Weakness:
UK Services PMI showing signs of stagnation
CPI and Retail Sales remain weak, suggesting limited scope for further GBP upside
Japan's latest Household Spending and Economy Watchers Survey show stabilizing conditions, supporting yen strength
📌 Final Take:
Fundamentals support the breakdown as monetary divergence and global sentiment drive capital into the JPY. Watch for confirmation via H4 close below 195.30 before entering the trade.
🧭 Trade idea aligns with macro, technicals, seasonality, and institutional flows.

USDJPY: Breaking Out With Macro Backing 🟢 USDJPY | Breakout Opportunity Above Resistance
Timeframe: 1H
Bias: Bullish
Type: Break and Retest
📊 Technical Setup
USDJPY is currently consolidating at a key 4H resistance zone (147.75–147.90). A clean breakout and retest of this area will confirm bullish continuation.
• Entry: Above 147.90 (after confirmed candle close + retest)
• SL: Below 147.30
• TP: 148.90 / 149.60
• RR: ~1:2.5
• Indicators: RSI showing strong upside momentum, holding above 50
🧠 Fundamentals + Macro Confluence
• USD Strength: Strong macro & delayed rate cuts support USD upside
• JPY Weakness: BOJ remains dovish; risk-on sentiment weighing on JPY
• COT + Conditional Score: USD score increased to 17, JPY dropped to 8
• Risk Sentiment: VIX at 14.2 = RISK ON → bearish JPY bias
🧭 Gameplan
“Wait for confirmation above resistance before entering”
🔔 Set alerts around 147.90 and monitor lower timeframes for retest and bullish candle structure.

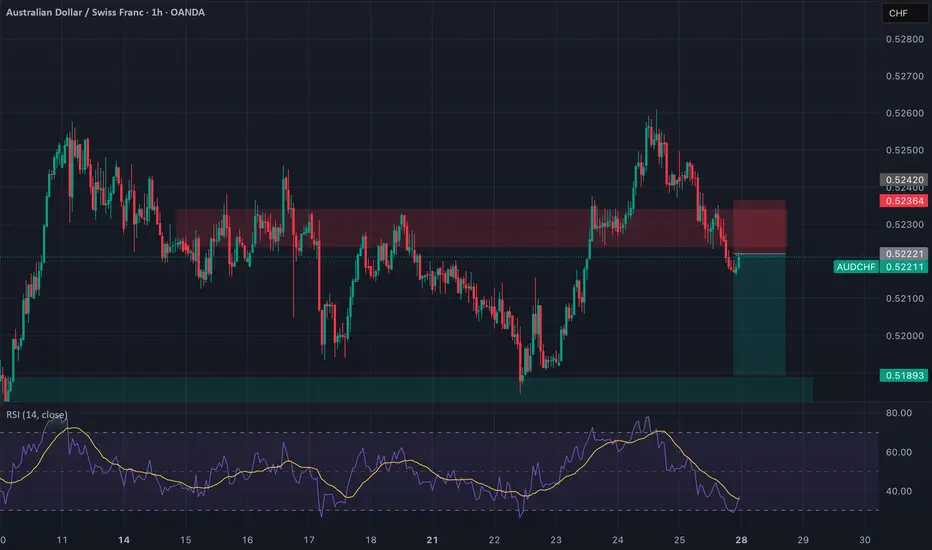
AUDCHF: Broken Support, Bearish Flow In Play Timeframe: 1H
Bias: Bearish
Type: Support Turncoat → Breakdown Play
📊 Technical Setup
AUDCHF previously broke the 4H resistance (0.5236) which flipped to support. However, price has now broken below this support, confirming it as a failed demand zone.
• Entry: Market execution or retest of 0.5236
• SL: Above 0.5245
• TP: 0.5189
• RR: ~1:2
• RSI: Below 50 and heading lower = momentum supports downside
📉 Macro & Fundamental Confluence
• AUD Weakness: RBA dovish, conditional score declining, bearish seasonality
• CHF Slightly Less Weak: Despite SNB dovish stance, CHF is outperforming AUD
• COT + Sentiment: AUD CFTC weakening, CHF holding steady
• Risk Sentiment: RISK ON environment reduces CHF demand but AUD still underperforms
🧭 Gameplan
“Support failed to hold. Bearish pressure intensifies. Target previous swing low zone.”
🔔 Watch for retest of 0.5236 for better RR setup before continuing short.