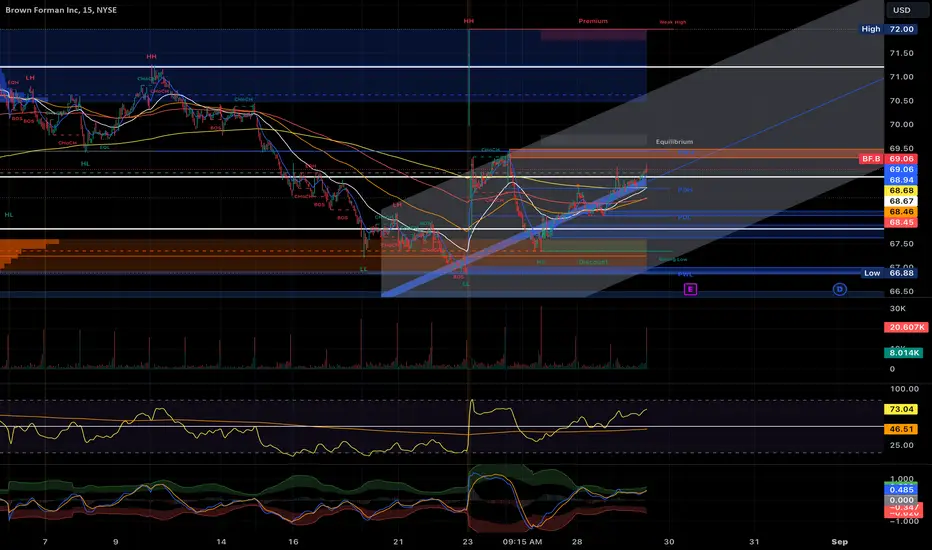
$BF.B earnings play All my technicals are pointing upside….the sell off at close is for the earning tomorrow BEFORE open. If earning are good i expect this keep moving back $70. I want to see if i cant get an entry around $39. If the earnings and future guidance are blah or less than spectacular i could see a return to
Next report date
—
Report period
—
EPS estimate
—
Revenue estimate
—
2.15USD
1.02 BUSD
4.17 BUSD
288.69 M
About Brown Forman Inc
Sector
CEO
Lawson E. Whiting
Headquarters
Louisville
Website
Employees (FY)
5.7 K
Founded
1870
FIGI
BBG000BD2NY8
Brown-Forman Corp. engages in the production and distribution of alcoholic beverages. The firm offers whiskey, scotch, tequila, vodka, liquor, and wine. Its brands include Jack Daniel, Woodford Reserve, Old Forester, Early Times, Canadian Mist, Coopers' Craft, Slane Irish, Finlandia, Korbel, El Jimador, Sonoma Cutrer and Chambord. The company was founded by George Garvin Brown III in 1870 and is headquartered in Louisville, KY.
$BF.A with a Neutral outlook following its earnings #Stocks The PEAD projected a Neutral outlook for $BF.A after a Negative Under reaction following its earnings release placing the stock in drift D with an expected accuracy of 75%.

$BF.B with a Bullish outlook following its earnings #Stocks The PEAD projected a Bullish outlook for $BF.B after a Positive Under reaction following its earnings release placing the stock in drift A with an expected accuracy of 83.33%.

Brown-Forman USA Sun Storm Investment Trading Desk & NexGen Wealth Management Service Present's: SSITD & NexGen Portfolio of the Week Series
Focus: Worldwide
By Sun Storm Investment Research & NexGen Wealth Management Service
A Profit & Solutions Strategy & Research
Trading | Investment | Stocks | ETF | Mutua


BFB - Brown-FormanCAPITALCOM:BFB
Idea is simple:
Long position from the current price ($71.1) (you can w8 to close higher than 71)
Stop - $70.3 (-1% risk)
Profit - 3 takes:
1st take $73 (2.8% upside)
2nd take $77 (8.3% upside)
3rd take $82 (14.7% upside)
Profit/Risk - from 2.8 to 14.7
You can split position to 3 pa

Brown-Forman CorpChart pattern: Bull flag
Entry: 82.24$ (this would end the secondary downtrend of the correction)
Stop: 67.74$
Target: 106$-130$
Stopmanagement: SAR Parabolic weekly Chart default settings
Risk:Reward-Ratio: 1.4:1

Brown Forman Long term analysis of Brown Forman, will probably break out of symmetrical triangle this summer. $130 Targets before we look to restest 200ema weekly.

BUY to BROWN-FORMAN CORP DailyHello traders, BROWN-FORMAN CORP is in a bullish configuration with a candle carrying water and stable volume traded. On the TIMEFRAME M1 we see a hammer candle upside down with a large negotiated purchase volume, it is heading towards its last lower precedent. To fill a bullish breakout gap, swallo

the b[AI]te's weekly insights -- BF.B 2021-02-08center stage image
stock
our system found that BF.B received the best image over the course of last week.
comment image
we see a strong positive correlation with our image indicator. We therefore assume that prices are driven emotionally and might not reflect an accurate picture of the comp

See all ideas
An aggregate view of professional's ratings.
Trade directly on the supercharts through our supported, fully-verified and user-reviewed brokers.


Curated watchlists where BF.B is featured.


Frequently Asked Questions
The current price of BF.B is 45.77 USD — it has increased by 1.55% in the past 24 hours. Watch Brown Forman Inc stock price performance more closely on the chart.
Depending on the exchange, the stock ticker may vary. For instance, on NYSE exchange Brown Forman Inc stocks are traded under the ticker BF.B.
BF.B stock has risen by 4.21% compared to the previous week, the month change is a 6.59% rise, over the last year Brown Forman Inc has showed a 35.08% decrease.
We've gathered analysts' opinions on Brown Forman Inc future price: according to them, BF.B price has a max estimate of 64.00 USD and a min estimate of 40.00 USD. Watch BF.B chart and read a more detailed Brown Forman Inc stock forecast: see what analysts think of Brown Forman Inc and suggest that you do with its stocks.
BF.B reached its all-time high on Sep 2, 2020 with the price of 83.40 USD, and its all-time low was 0.08 USD and was reached on Sep 17, 1974. View more price dynamics on BF.B chart.
See other stocks reaching their highest and lowest prices.
See other stocks reaching their highest and lowest prices.
BF.B stock is 2.78% volatile and has beta coefficient of 0.71. Track Brown Forman Inc stock price on the chart and check out the list of the most volatile stocks — is Brown Forman Inc there?
Today Brown Forman Inc has the market capitalization of 21.30 B, it has decreased by 2.22% over the last week.
Yes, you can track Brown Forman Inc financials in yearly and quarterly reports right on TradingView.
Brown Forman Inc is going to release the next earnings report on Aug 28, 2024. Keep track of upcoming events with our Earnings Calendar.
BF.B earnings for the last quarter are 0.56 USD per share, whereas the estimation was 0.42 USD resulting in a 34.07% surprise. The estimated earnings for the next quarter are 0.46 USD per share. See more details about Brown Forman Inc earnings.
Brown Forman Inc revenue for the last quarter amounts to 964.00 M USD, despite the estimated figure of 1.02 B USD. In the next quarter, revenue is expected to reach 990.55 M USD.
BF.B net income for the last quarter is 266.00 M USD, while the quarter before that showed 285.00 M USD of net income which accounts for −6.67% change. Track more Brown Forman Inc financial stats to get the full picture.
Yes, BF.B dividends are paid quarterly. The last dividend per share was 0.22 USD. As of today, Dividend Yield (TTM)% is 1.91%. Tracking Brown Forman Inc dividends might help you take more informed decisions.
Brown Forman Inc dividend yield was 1.77% in 2023, and payout ratio reached 39.45%. The year before the numbers were 1.21% and 48.35% correspondingly. See high-dividend stocks and find more opportunities for your portfolio.
As of Jul 27, 2024, the company has 5.70 K employees. See our rating of the largest employees — is Brown Forman Inc on this list?
EBITDA measures a company's operating performance, its growth signifies an improvement in the efficiency of a company. Brown Forman Inc EBITDA is 1.25 B USD, and current EBITDA margin is 29.91%. See more stats in Brown Forman Inc financial statements.
Like other stocks, BF.B shares are traded on stock exchanges, e.g. Nasdaq, Nyse, Euronext, and the easiest way to buy them is through an online stock broker. To do this, you need to open an account and follow a broker's procedures, then start trading. You can trade Brown Forman Inc stock right from TradingView charts — choose your broker and connect to your account.
Investing in stocks requires a comprehensive research: you should carefully study all the available data, e.g. company's financials, related news, and its technical analysis. So Brown Forman Inc technincal analysis shows the buy rating today, and its 1 week rating is sell. Since market conditions are prone to changes, it's worth looking a bit further into the future — according to the 1 month rating Brown Forman Inc stock shows the neutral signal. See more of Brown Forman Inc technicals for a more comprehensive analysis.
If you're still not sure, try looking for inspiration in our curated watchlists.
If you're still not sure, try looking for inspiration in our curated watchlists.