Ready for something insane? This is not a prediction I'm willing to bet on, but...
If we were to do a fib extention of Wave 1-Wave 2, we find that on wave 3, IOTA went all the way to over 5.618. FIVE .
So... if we were to do a measured move using the same fib level for our next extention, where do you think we'd end up?
$30 .
One can only dream, right?
Measuredmove

$BTC - Bitcoin - Measured Move Up - Ties into Wave 5 Target 3I believe this is what will fuel the fire all the way up to the Wave 5 Target 3 of $9426.
Measured moves up shown here.
If you haven't already, check out my Elliot Wave Analysis linked in Related Ideas.

IF AT FIRST YOU DON'T SUCCEED SHORT! BEARISH CYPHER ON EUR/USD.So my first attempt to Short EUR/USD failed. That's ok. You can't and won't win them all in the trading business. The market does what it wants.
That said, in my previous post, I mentioned another shorting opportunity in the form of a Bearish Cypher Pattern on the 4H chart . Well, price action is now confidently moving very strongly towards the completion of the identified pattern (we still need to see it complete though).
In further support of the bearish expectation, I anticipate the bullish move currently seen in price action - as mentioned in my previous post (see 2618 Second Chance link below)-, as a relief rally after the break of the Daily Chart H&S (see EUR/USD-THE END OF THE BULLISH TREND link by @ Akil_Stokes below).
Further analysis indicates an equal measured move (EMM-) into the kill zone (yellow rectangle with purple border) of the Cypher pattern .
There is also Fib confluence with the EMM and the pattern completion in the forms of:
- 38.2 % Fib retracement from the Head of the H&S to the C point of the Cypher
- 61.8% Fib retracement from the peak of the Right Shoulder of the H&S to the C point of the Cypher
-161.8% Fib extension from C to B to C of the Cypher which incidentally also falls in line with the completion point D of the Cypher
As a final analysis icing on the cake as it were, we're seeing overbought Stochastics across time frames (Daily, 4H, 1H and even Monthly with the Weekly being the only outlier.
IF price action can complete the Cypher pattern , THEN I can begin looking for an entry reason (most likely on lower time frames) into this anticipated trade (e.g lower low lower close (L.L L.C) candle, double top (D.T) in the completion area...).
Stops would ideally be above the X point. However, if the Risk profile is too great (which with the size of my account it usually is with Cyphers and Gartlies on any time frame), my ideal approach (I still consider myself new to trading so I trade with a smaller account and as such I don't trade off the 4H or Higher), I would look for a lower time frame reason for entry in the form of the above mentioned examples (D.T, L.L L.C candle...), to provide an ideal and reasoned basis for setting my stops/responsibly and reasonably managing my risk, while providing a practical basis to get involved in the trade.
IF indeed we get the anticipated bearish move (remember market does what it wants) my targets would initially be 38.2%, 50% or 61.8% retracement of C to D (the highest point established not the anticipated completion point). My next targets could then be a retest of the lows at C.
As a swing trade looking to ride this down to the measured target of the H&S , I'd be looking at about the 1.1247-50s (IF anyone does take this trade, be sure to measure targets for yourself. My method of measurement may be highly different than yours and produce different targets).
So that's my analysis. Thanks for letting me share. Happy Hunting and Good Luck in your trades today, this week and for the rest of the year.
DISCLAIMER: Like most of you here, I consider myself to be new to trading and I'm in the process of learning just like you. Any ideas posted here are my own opinion based on my personal approach to analysing and approaching the markets and do not constitute trading advice or recommendation to trade any financial instrument. You are responsible for the trades you take and are aware of the risks associated with trading. Please do your own homework and analysis and be sure any trades you take meet your own personal rules and plans. Trading involves significant risk and you could lose more than you initially invested (I love trading disclaimers. They have really kept me grounded, kept me positive and optimistic and helped me realise that while there is risk there is also opportunity if approached and managed responsibly and as a business. It was the prime driver for my seeking an education in trading)

A break out of the trading rangeThe USDSEK daily Forex chart broke out of a trading range last Thursday. Following this move was a slight pullback on Friday. I anticipate a measured move to 8.50828, and then I will reevaluate my position.

double top and channel break outGot a double top, RSI over bought on the first test.
Consolidation at previous structure
expecting a break out to the down side atleast an equal measured move
strong confluence of fib inversion and fib extension
previous major structure

GBPUSD - EQUAL MEASURED MOVE INTO STRUCTUREFollowing up on this weekends video, here's a look at how the GBPUSD is progressing. If you remember I was looking for a potential retracement back into our previous level of structure & a chance to take advantage of a short-term shorting opportunity.
If the market puts in another equal measured move higher, it would leave price right the highs of a previous level of consolidation. At this level I would expect to see some relief. As always we want to be predictive in our analysis, yet reactive in our execution so I'll be waiting to see how price reacts first before getting involved.
Good Luck this week traders!! And if you'd like a video explanation you can click one of the links below.
Akil

POTENTIAL COUNTER TREND OPPORTUNITY ON EURUSDI've tried to keep this as clean as possible but, there's so much going on in this chart so please bear with me.
Price action on EURUSD has come into a previously identified support level anticipated to be a rally point following the break down below the neckline of an H&S identified on the Daily Charts (not shown/addressed here). This support level was anticipated to give the market some pause before resuming it's intended direction to complete the H&S at measured targets.
That said, an interesting opportunity has arisen in the form of stochastic (12,3,3) bullish divergence on the 4 hr chart at this support level. This provides some confidence in my anticipated short term bullish expectation. In support of my prediction:
1. We have an equal measured move completing at the neckline of the H&S at about 1.1860
2. There is fib confluence at the EMM zone in the form of a 50% retracement from most recent major swing high to current lows, 38.2% retracement from high of the Head at 1.20885 to current lows and a 161.8% inversion of current lows to swing high at 1.18094 (CURRENT LOWS = 1.17163)
As an added support to this prediction, there is a Potential Bullish Bat pattern setting up on the 1 hr chart (), which, IF it can complete will THEN provide a good entry opportunity and also participate in setting up a double bottom on the 4 hr chart.
My targets would be at:
T1 - Highs of the Bat at 1.1757
T2 - Previous structure at about 1.1790 and
T3 - EMM at 1.1860
Feedback on my analysis would be quite welcome and appreciated.
Usual disclaimers expressed. I am not a licensed professional (I am in-fact still learning how to trade). All views and opinions are my own and do not constitute trading advice. Please seek professional advice before risking your scrilla on any trades.
Good luck with your trades today

Minimum Bitcoin target is 24000 BTCCNYMeasured move target is 24000 BTCCNY, went long at 18555ish.
follow me on twitter/blog for live trade updates and analysis

Cup and Handle?Large round cup followed by 50% pullback? Yes
Descending Volume Profile? Yes
Targets = Measured move and/or 1.618 fib and/or R2 pivot
more info on C&H here: www.youtube.com

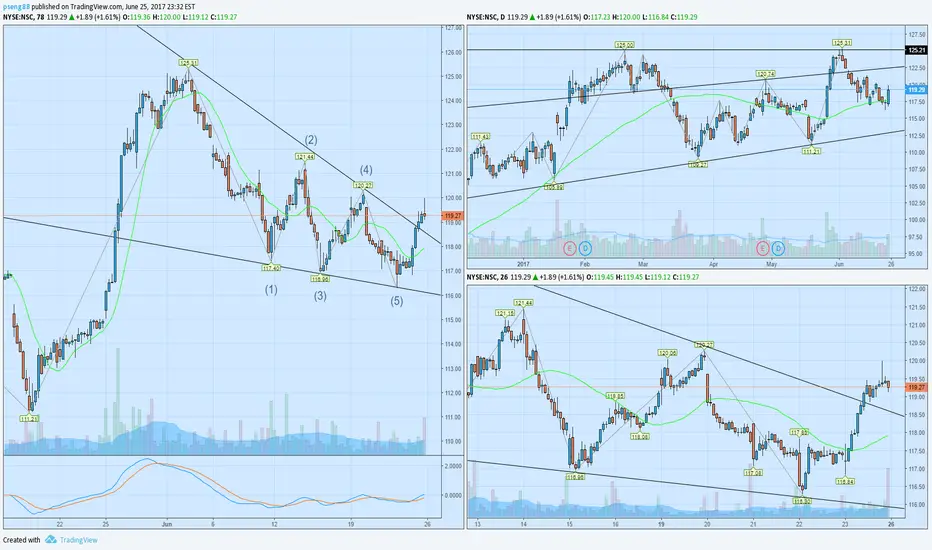
$nsc ready for next swing higher!upward sloping channel bouncing strongly off 50 day
breaking out of falling wedge-measured move is $8- potential energy to breakout out resistance area of 125.0x area
looking for minor pullback for a better entry for better r/r
rai inverse head and shoulder breakouthigher timeframe showing strong uptrend and excellent trend strength
intermediate timeframe showing trend alignment and showed the breakout of resistance area 67.0x area after completing inverse h and s pattern with strong positive volume pressure
measured move from head of pattern to neckline is a .55 move which should give projected target of 67.55 and extension level .618 at 67.8x area
consolidation in this previous range should provide enough momentum and relative strength has room to run
setting stop underneath breakout candle in case of a false breakout move

audjpy gartley set upnice 1 to 1 measured move ending at gartley completion. If you want to enter aggressively do so at completion of the pattern. You can also look for the rsi to be over sold near completion. If you are move conservative you can look for a double top w/ rsi divergence .

EURAUD shortPrice didnt respect the last resistance level, so aiming for 1.463x area for new short. Would also complete the measured move.

AUDJPY - Position TradeMonthly perspective for a possible sell trade. Position trades are usually held for months and even years.
Personally as I Swing Trader I don't hold trades this long, but it gives me more confidence when taking short positions on my timeframes.


GBPUSD Under Equilibrium: The Measured Move ConceptSorry been a bit busy lately. Have been in this short, didn't take the time to pin the idea here. I wanted to magnify the measured move concept here (after the fact yeah I know). But really it's because it helps find a point out of your trades or (if you don't want out) at least help identify where we are in the larger perspectives.
For those still short, I would highly advise not to move the stoploss down too far. Price could rally to the Equilibrium and slightly above. Thanks and good luck!

NZD/USD 30min measured move and 240 min CypherPrice is starting to break down 240 min chart. On the 30 min we have a potential measured move. I'm looking for price to retrace back to the .382 fib (.70451) and then continue to the 1.618 fib ext to .6980. The measured move from the .382 to the 1.618 ext is exactly the same length. Also, the .382 fib level has acted as former support. I would have my stop just above the .618 at .7070 to give the trade some room to develop. The Cypher on the 240 min chart is still valid has well. If price closes on the 240 min above .69843, the Bearish Bat is still valid too. Good luck trading out there.

EURUSD - Strucuture Trading+++ Don't forget to LIKE & Follow+++Here are my thoughts about EURUSD on 4H.
Price failed to make a higher high higher close above previous minor structure(red line) and if you drop 1 time frame lower you will see a Double Top with RSI being OB on the right Top + bearish divergence - nice trading opportunity for shorting EURUSD. If price goes higher you can take the opportunity for hopping on the bearish move.
If you look left price made a NSH - this NSH confirmed a bullish rotation in price on 4H, so currently I'm looking where I can go long. There is equal measured move(orange lines) that is completing right at previous zone(look where is NSL). There is 1.618 Fibo Extension too - that is almost perfectly aligned with the measured move.
I will be waiting for RSI to go in oversold condition and then I'll be looking for entry reasons based on my trading plan. You can wait for a Double Bottom with stops below structure level(NSL) and target previous minor structure.
Good Luck!
If you'd like to see more good trading ideas from me, click the "Like" button!
You can get my trading ideas immediately, just make sure to follow me.

ETHUSD AB=CD Measured Move?Seems like a logical place to take profits. One may also wait for a close outside of the current price channel as confirmation to sell.

long at 552.50 with a P/L ratio of 3.59 (measured move)long at 552.50 with a P/L ratio of 3.59 (measured move). Next phase of moon cycle

NZDUSD Long. Measured move, "stairway to heaven"NzdUsd has been in a uptrend since late september of 2015.
Recent weeks priceaction broke a KEY resistance area and price looks to be in a "stairstep pattern" with equal moves up and down.
So IF price repeat itself 1 more time we should have a good risk vs reward setup on our hands.
Order: Buystop at 0.6812 Stoploss: 0.6750 TP: 0.7045
1 : 3.45 RvR

Possible transition mid-term from bearish to bullish trendShort term - Short bias
Long term - Overextension and possible transition/reversal
Price looks a bit overextended on the weekly chart with a strong 2 bar reversal on the daily chart.
Momentum on the other hand is still in favor of the bears so another sell at the measured move objective around 1.89000 is clearly justified as long as we stay underneath 1.90000 on a daily closing basis.
But I think this pair is due for some bullish correction long term so if we see some strong bullish rejection from the 1.86000 area I am open to buy at this area with stops below the last swing low.

Measured move objective (ABCD) coming in at major supportSteadily gaining since the end of last year, this pair has recently broken through a key resistance level around 0.79000 after putting in a daily breakout pattern.
The swings on the 4 hour chart are very harmonic and even in size. They are increasing in time though. If we get a weak pullback into the zone around 0.79000 which lines up with the measured move objective for the pullback I am looking to go long with my first target around 0.80000 even and second target at 0.80800.
