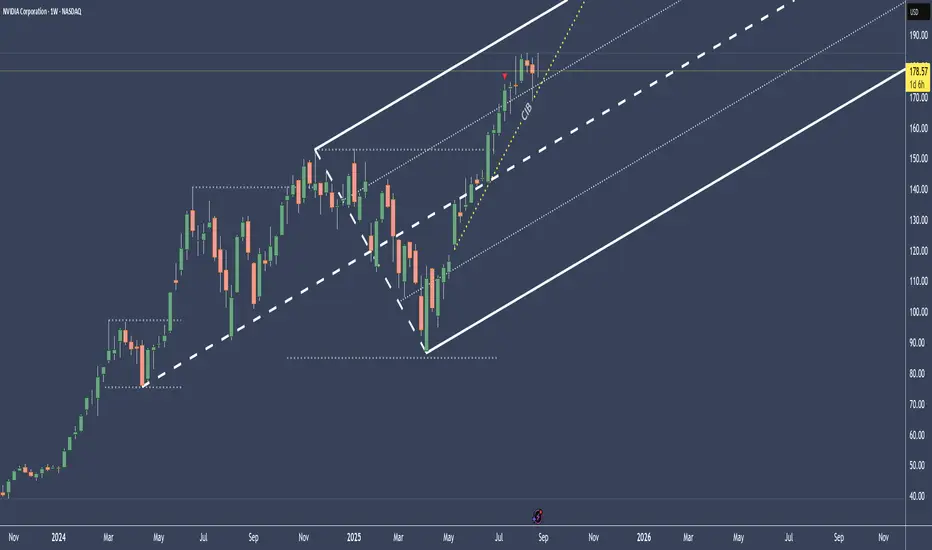
NVDA - Watch the show, until the Sh** hits the FanThe expected “end of hype” around Nvidia stems from its current inability to forecast H20 chip sales to China, forced production halts, and growing political friction—despite its strong financial performance elsewhere.
The tension between U.S. export policy and China’s technological self-reliance is creating real operational and strategic obstacles for Nvidia.
In this weekly chart we still have an upward projection.
Nonetheless do we all know what a Game NVDA is playing by selling to its one companies.
The air is thin, very thin up there.
And after the Earnings Report we all know how the books are pimped.
A breach of the CIB line would make me go "hmmm....", and starting to look for a short.
Until then, just relax and watch the show.
Medianline
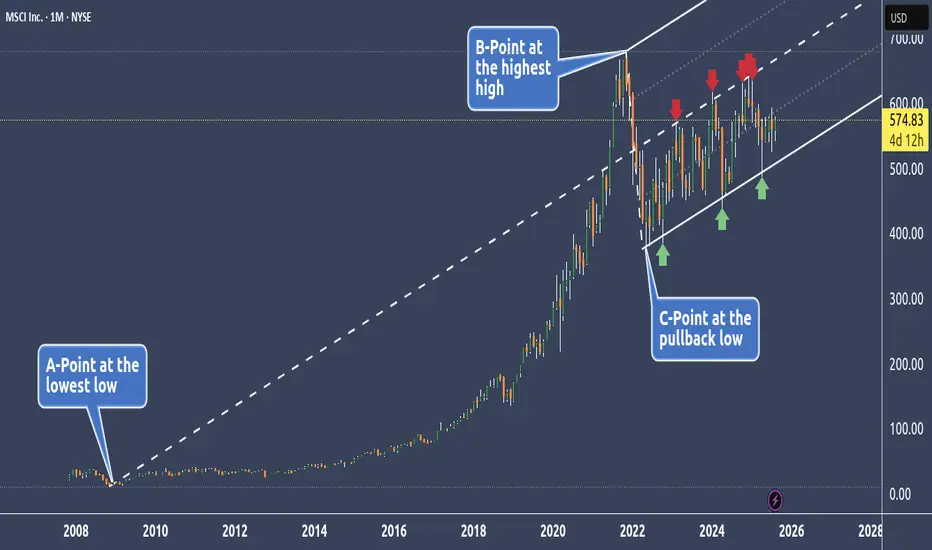
MSCI -Trading Within A Rolling ChopI love it how the Forks catch the most important angle for the underlyings.
Within the fork we can clearly see, that the L-MLH and the Centerline catch the High & Low of the rolling Chop, which is tilted to the upside.
Until the L-MLH is broken, there is no Short in sight, and we just can buy the Low and sell the High, with stops below structure or below the L-MLH.
Sometimes trading is simple - but it's seldom easy §8-)
WMT - Walmart turns southI attached the A-Handle of the fork to the GAP from November 2025, because a GAP is also a Pivot.
As we see, price reacts not bad at the Centerline.
Price failed to make a new high.
Then it broke the Centerline and retested it.
No we are trading in the midst of the old accummulation zone where Buyers hung out.
A nice bounce would be a good short opportunity.
Breaking the support zone also, but with lower Risk/Reward ratio.
Observing WMT for a potential short.

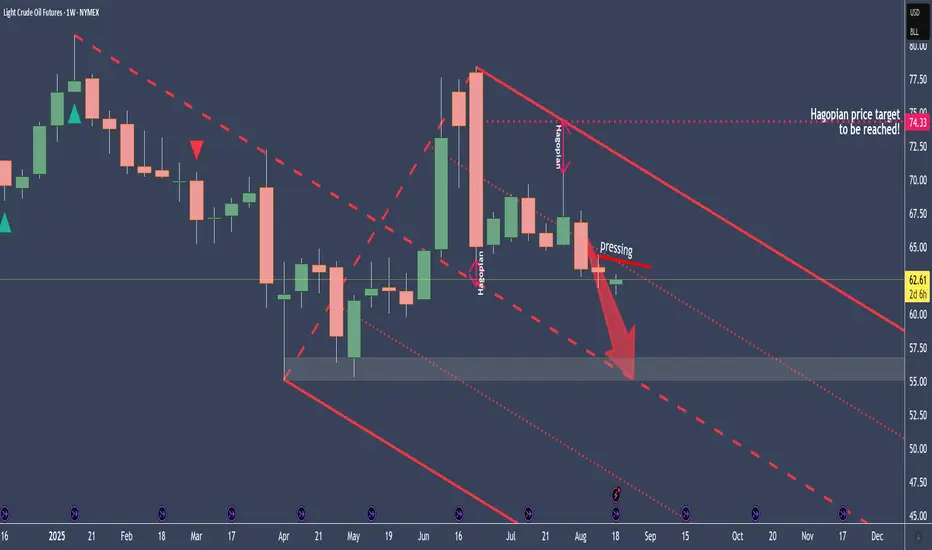
Crude Oil - Why I see it at $56 in the coming weeksCrude is trading below the centerline.
The pressing shows that the “election whales” don’t want higher prices at the moment.
Why?
No idea, and it doesn’t matter either.
All I’m interested in is where I can find a good entry to short crude. For example, a pullback to the pressure line, with a money management stop, or behind one of the weekly candles. It’s all a question of how much risk you’re allowed to take according to risk management.
Let’s see if we get an entry to join the sleigh ride down to the centerline.
NQ - If you're curious to where Nasdaq is going todayNot much to babble.
This is my intraday Chart.
TGT at the Centerline...where else? §8-)
Trade save. NO FOMO!!!
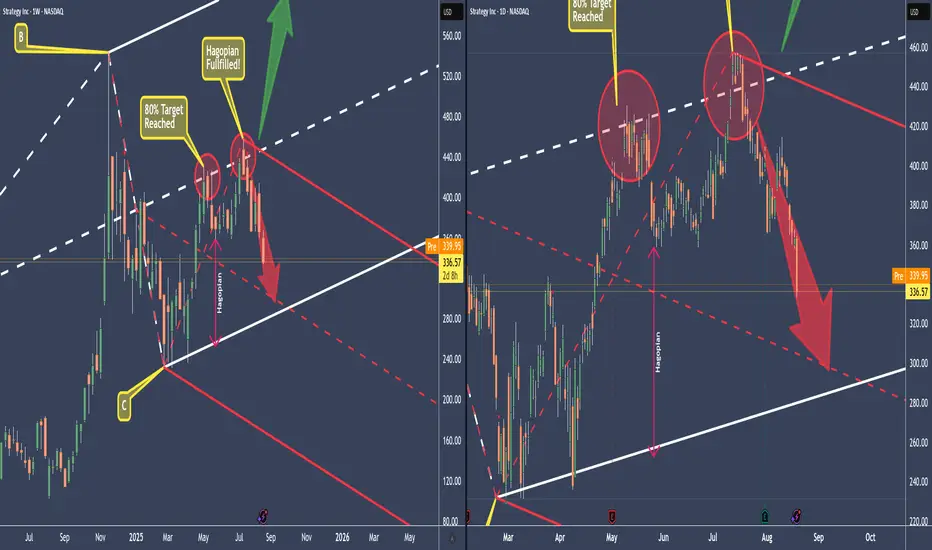
MSTR Ponzi is paying for my yearly steak & lobster subscriptionWe can see that from the white Centerline, MSTR has only been heading south. In contrast, Bitcoin has held up quite a bit better so far.
If you go back through my posts, you’ll see that I’ve been warning for a long time that MSTR is basically feeding itself. That simply can’t end well!
Either way – we gratefully take our profit and wait until we reach the lower centerline. Because we know there’s about an 80% chance that the price will fall back into temporary equilibrium, the Centerline
And if you’re not too greedy, well then you take 70%–80% of the profits now and let the rest run.
Anyone who was able to learn something from this trade or even make profits is welcome to boost and comment. §8-)
YT video will be available tomorrow.
...and on we go.
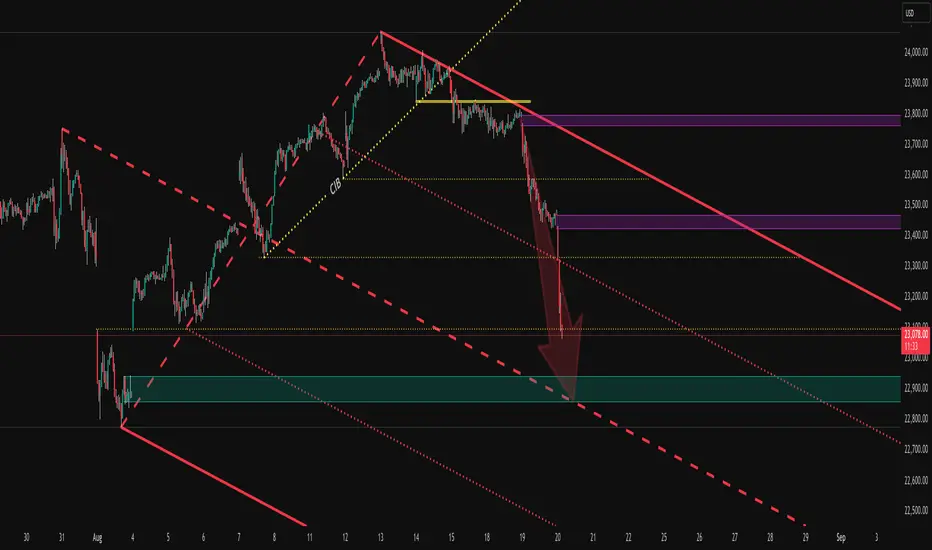
NQ – Nasdaq follows the witch’s SPY prophecyNot only is the S&P 500 following the oracle in the SPY, but the Nasdaq has also given us a short signal. So, the scenario is the same as with SPY: short down to the Centerline.
For the indicator traders, I’ve also added the EMA(10) and EMA(20). Look at how well they’ve provided support so far. If the EMA(20) cracks, things will get hot. And if the CIB line (Change In Behavior) also breaks, then all hell breaks loose!
As already mentioned in the SPY post, it wouldn’t be a shame to take at least 50% of the profits you’ve accumulated so far. Because if it goes further up, e.g. above the U-MLH, you still have 50% left to benefit. If it goes down, we’ve already bagged 50%.
BTW: At the 1/4 line, we can usually expect support.
Exciting times, when maybe it’s better to sit still and keep your hands to yourself.
I’ll create the YT video with details tomorrow.
Happy profits to you all!

SPY – No hocus-pocus – Now the witch is hunting the bullsHappy Hump-Day y'all!
In the last post (see linked chart), I explained what the witch sees in the future.
A possible scenario that is long overdue: the markets are letting out air.
With the candles from yesterday and the day before, we have confirmation that the S&P 500 is heading south. That has consequences that not many want to see right now.
The bulls will be overrun, panic selling will kick in and drive the markets into the ground even faster. The current profit target is still the Centerline, as marked with the red arrow.
Whoever doesn’t cash in at least 50% of their gains now will end up in the witch’s cauldron §8-)
Let’s see how this develops.
The YT Video will be up tomorrow - gotta feed the witches cat §8-)
May the broom be with you!

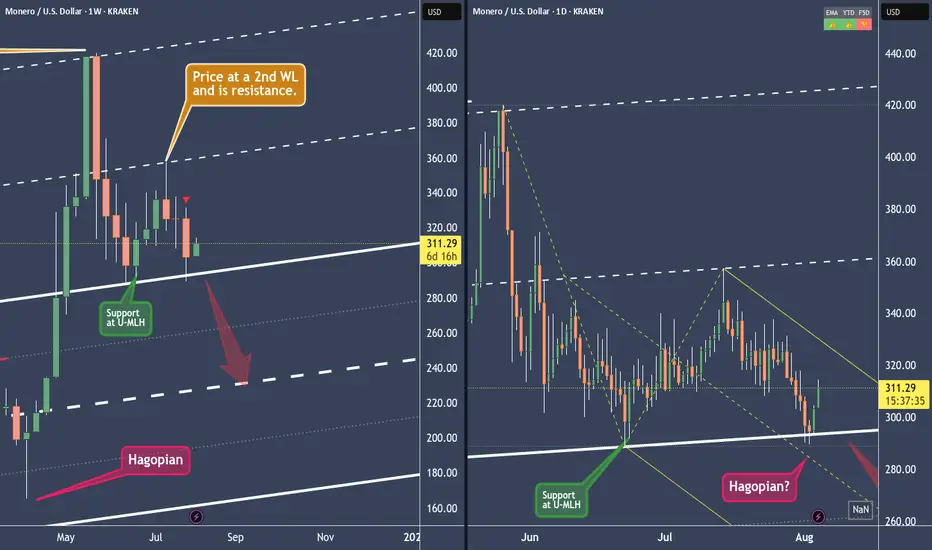
XMRUSD - Monero is strong. But strong enough?Can Monero break the U-MLH of the yellow Fork to stop the down-drift?
In the last post we see that Monero has the potential to reach the white Centerline at around $240. At least this is the view on the weekly Chart.
On the other hand we see support at the U-MLH in the daily Chart.
Until the U-MLH of the yellow Fork isn't breached by a open and close outside, the weekly short projection is in play.
GSL - Global Shipping Lease With Exceptional SignalsGlobal Ship Lease (GSL) stands out as a financially solid, deeply undervalued shipping play with improving earnings and favorable macro tailwinds.
If the stock breaks out above the Cup-& Handle pattern, it could be an attractive long opportunity.
For value-focused traders, the combination of low multiples, strong fundamentals, and technical setups makes GSL hard to ignore.
Global Ship Lease has nearly fully chartered its fleet—96% for 2025 and 80% for 2026—giving it strong cash flow visibility amid market turbulence.
On to the technical side:
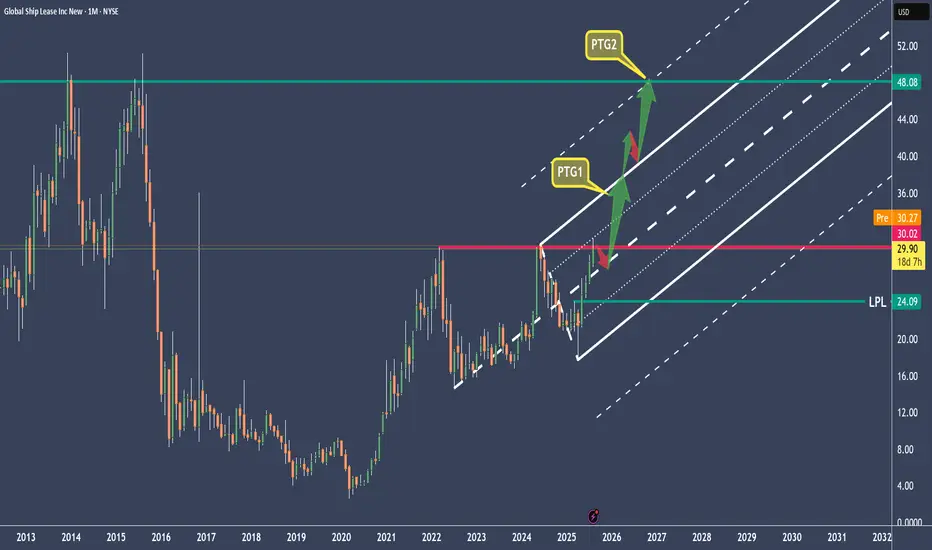
From 2022 until now, the stock has traded within a large range of 14.62 – 29.90 and is now facing, for the third time, a breakout from the currently formed cup & handle pattern.
In anticipation of today’s breakout on news, I take this as my starting gun to begin building a position. I will be monitoring the stock closely intraday and trading accordingly.
Within the fork, we can see the price hitting the 1/4 line and getting slightly sold off. Ideally, we’d see a pullback to the CL or below. In the longer term, provided the fundamentals support the price, I would build larger positions at the LPL (Last Pivot Low).
The target for this stock is at least the U-MLH as PTG1 = 50% target at $36, and next the WL1 (PTG2) as the 100% target at around $48.
It goes without saying that this trade is not a quickie.
Good luck, and thanks for a like!
DOGEUSD Has reached it's (first?) targetAfter reaching the Centerline, price eitheradvances to the Upper Extreme (U-MLH), or it reverses and it's target is the L-MLH, the lower Extreme of the Fork.
An Open & Close below the Centerline would indicate further progress to the downside.
A stop above the last high with a target around 2 would be the trade I would take.

ETHUSD - Ethereum can't crack the Warning lineWe can see ETHUSD nibbling at the WL.
This currently looks like a short-term pullback.
If Ether pulls back, we will at least see the U-MLH.
After that, the centerline would be the next target before further support can be expected.

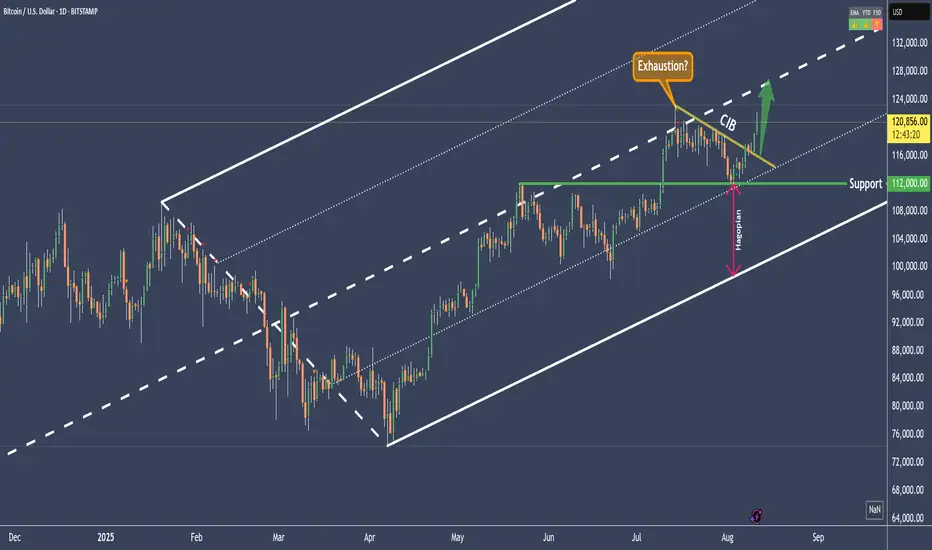
BTCUSD - Bitcoin potential at least 125'400Bitcoin is trading within the Pendulum Fork.
After the CL was reached, the price should have gone to the L-MLH.
However, this was not achieved, and instead a HAGOPIAN was left behind.
In most cases, this HAGOPIAN will drive the price higher than where it came from.
Since we know that in about 80% of all cases the market moves to the CL, we also have a good chance this time of reaching the high of at least 125,400. Personally, I see the target quite a bit higher, but let’s see what BTCUSD has in store for us.
Thanks for the likes peeps §8-)
Reddit - Impressive But I Stalk A ShortReddit is currently delivering excellent figures – revenue and user base are booming, profits have returned, and AI partnerships are creating strong conditions for growth. However, the current share price reflects this upward momentum with (over-)enthusiasm. Exciting for speculative investors, but those focused on value should wait for a pullback.
And that’s exactly the hook for why I’m lying in wait for a short trade.
Let’s take a look at the technical side – the chart analysis:
We can see that several CIB lines (Change in Behavior) have been broken.
And bam! – the market hits our 80%-probability profit target.
We know what that means: the market is in equilibrium.
And when the market acts like a couch potato, we also know it can’t stay that way for long.
So, what are the options?
Up or down.
Up?
Could happen – human greed is boundless and goes further than the moon, as we’re currently seeing.
Down?
If we take the fundamental analysis into account, and our common sense also tells us that Reddit is overheated, then this short idea is definitely worth investigating.
I see two possibilities:
1. Speculative short:
Here I would go with options, since shorts are always trickier than longs. You simply have more time to be right.
2. Wait for a trigger signal:
If we see the market leave the couch (the CL), we look at the bars and find a good entry with a sensible risk/reward, targeting:
a) the 1/4 line
b) the L-MLH
Happy hunting!

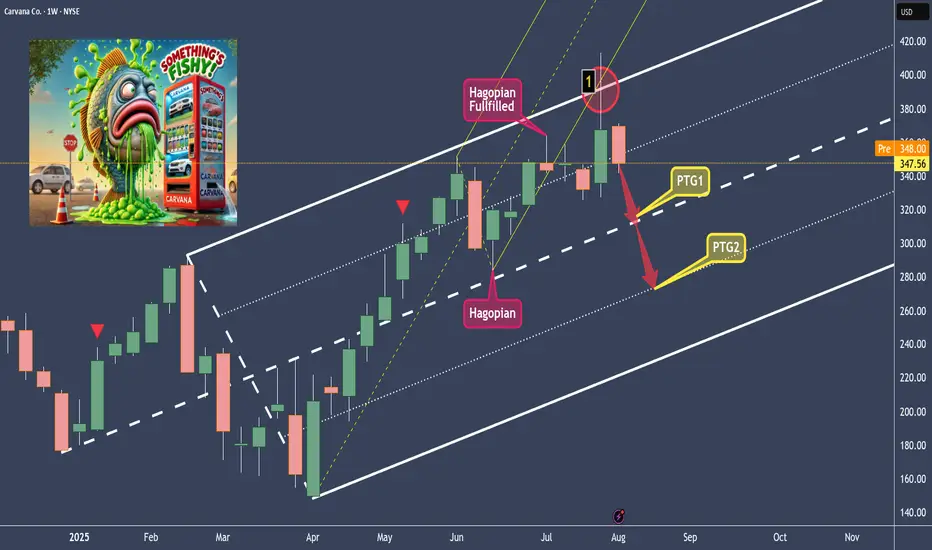
CVNA - Stinky Fish Short SetupAs can be seen from past analyses of CVNA, they have rarely played out as expected. And yet – this time too, I will be trading CVNA short.
Why again?
Because it’s a setup that follows the rules of the Forks.
Setups are one part of a system.
Just one part – nothing more.
A setup has a statistical probability of generating a profit. But this probability only works if we play it as often as possible.
It’s like the lottery: if you don’t play, you can’t win. And just when you don’t play, you would have won ;-)
OK – in the lottery, the odds are inversely against the player.
This setup, however, has a positive expectancy. And that’s why I will also initiate a short this time.
Here are the triggers:
At (1) we see that the market suffered a sharp sell-off at a confluence point. This didn’t happen for no reason! At least from the perspective of technical analysis, specifically the rules of forks, the market reached an upper extreme – the U-MLH.
In addition, we also see one of the fork rule-book patterns occurring:
"If the market closes outside the fork, we can expect a test/retest back to the line."
Here, the yellow fork is meant:
The market opens and closes outside the L-MLH, reverses, and promptly tests the L-MLH before continuing down in the breakout direction.
So:
a) Yellow fork test/retest after breaking out of the fork
b) Reaching the U-MLH and sharp sell-off
= Short setup
The natural target is the equilibrium – the center-line (PTG1).
And another target for me, based on my experience, is the 1/4 line (PTG2) if the market breaks the CL.
I will execute my entry on a daily basis, possibly with options or a combination with the underlying.
Wishing you all much success!
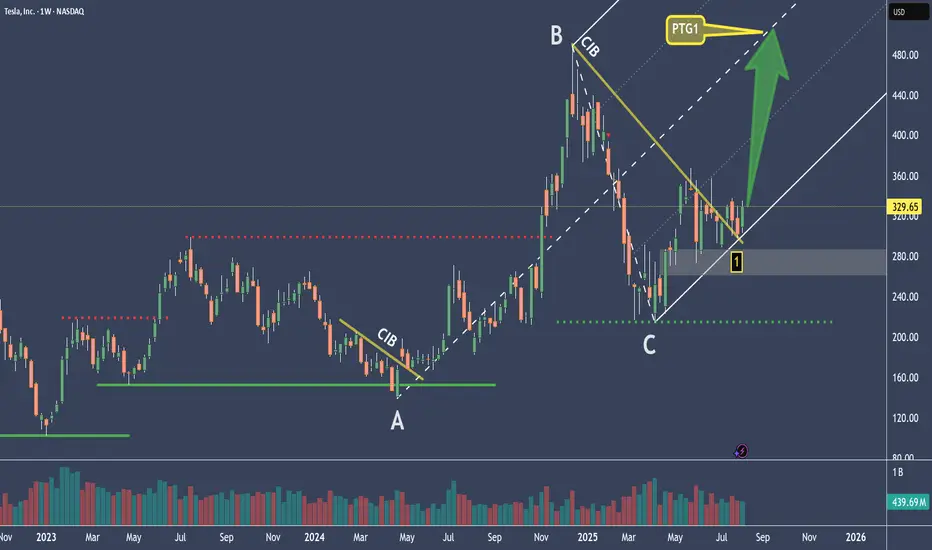
TESLA Is Counting Down The Clock – Moonshot?The red and green lines nicely illustrate what true support and resistance look like.
At the moment, it appears that the market has formed support again (1), but we can’t really confirm this since we don’t have a higher high that has been broken. So we can only assume that the base is at the C point.
We’ve been trading within the fork for several months now, which suggests that we’re once again in a longer-term upward movement.
If that’s the case, then we look for a nice profit target (PTG1) at the CL, because we know there’s over an 80% chance of reaching it.
An open and close outside the fork would be an exit signal, and could indicate a possible reversal to a short position.
I’ll explain further details in the YT video.
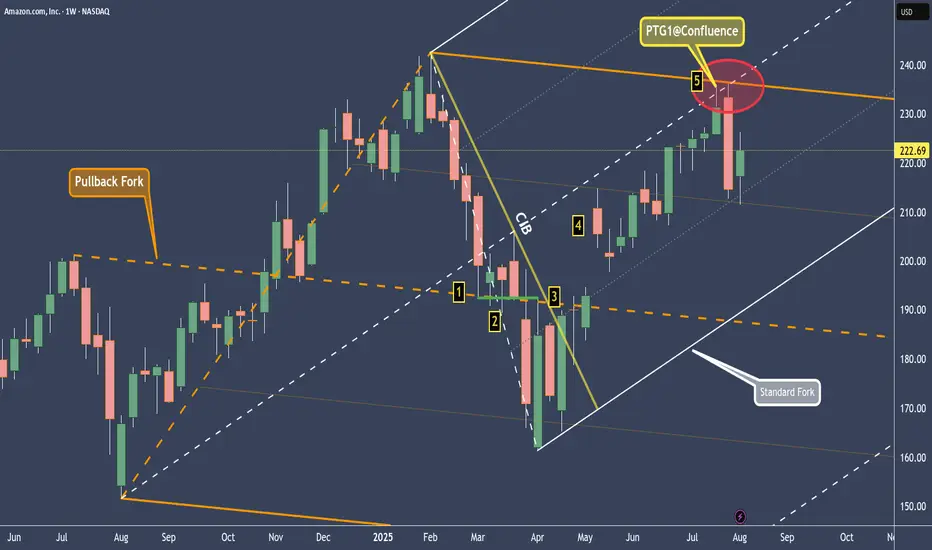
AMZN - Amazon Hit The 80% profit Target. Trend change ahead?On this chart we have 2 forks.
Orange: the pullback fork
It shows us where the equilibrium is — at the centerline, which the market respected to the tick (1).
After that, there were several bars that formed support (2).
When the CIB line was broken (3), the market gapped above the orange centerline and made its way up to the white centerline (5), the target that we can expect in around 80% of all cases.
Note the confluence point where the centerline of the white fork and the upper median line parallel (U-MLH) of the orange fork meet.
A day later, we saw a sharp sell-off within just one bar! Is this now another trend reversal?
No, clearly not.
For a trend reversal to occur, the market would have to break the white L-MLH (lower median line parallel). As long as the market is trading within the white fork, we remain long.
I’ll make a YT video soon, covering the details.
Wishing you all a successful new trading week.
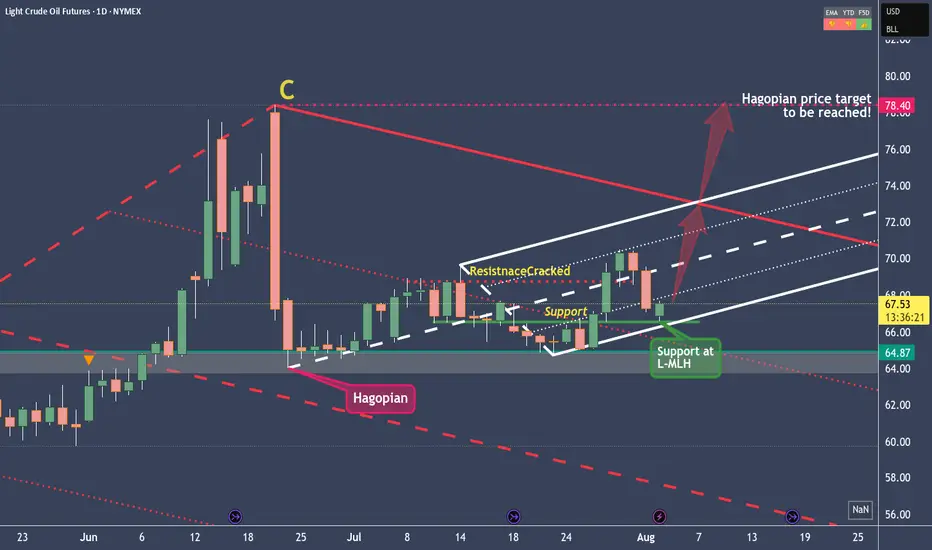
Crude Oil setting up for a Long Trade to $78.40In the long term, Crude Oil is in a short position.
We can see this from the red pendulum fork, which projects the price movement downward.
However, in the short- to medium-term, we're long, as clearly illustrated by the white fork. Supporting the case for higher prices is the Hagopian signal that occurred on June 24, 2025.
This essentially means that the market is expected to rise beyond the point it came from—specifically, the C-point of the red fork. The target would therefore be around $78.40 in the coming weeks or months, which does seem quite ambitious.
But as long as price remains within the boundaries of the white fork, we're in an upward mode, and the potential profit target of $78.40 remains valid.
Also, the fact that Crude Oil is finding support exactly at the L-MLH (Lower Median Line Parallel) of the white fork gives me further confidence in a long trade.
Crude: Long and: Don't forget to watch the follow-up Video.
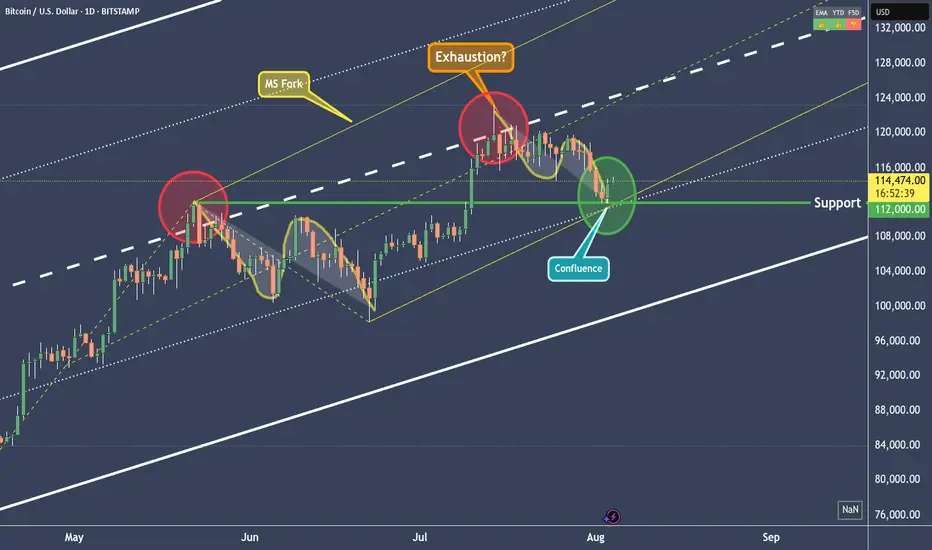
BTCUSD - Right to the point!In the last post (see the Linked Chart), I showed why BTCUSD would fall, and I also pointed out where the first price level for a possible pause might be.
On Friday, that level was reached, and the market seems to be turning *on the dot*. Will we now see higher prices again, or even a new all-time high? Let’s take a closer look:
The “confluence” point is marked by the white fork and the yellow modified Schiff fork. This point lies exactly on the 1/4 line. And this line often indicates temporary levels where at least a pause in the movement can be expected.
When we look at what Bitcoin did at this price level in mid-June, it seems likely that it will rise again. The overall pattern, from the centerline to the 1/4 line, looks extremely similar (see the A-B-C Wave Pattern)!
And yet, I’m not entirely convinced by the picture. Because this was the second time we reached the centerline.
For the brave, this wouldn’t be a bad entry point—or an opportunity to increase the position after this pullback. A possible stop for traders could be placed just below the current low, with targets at the centerline of course.
But why not just lean back, enjoy the profits, and switch into observation mode for now…
I will also make a video that explains the details and connections more clearly.
Happy Monday and stay patient to fight the FOMO! §8-)
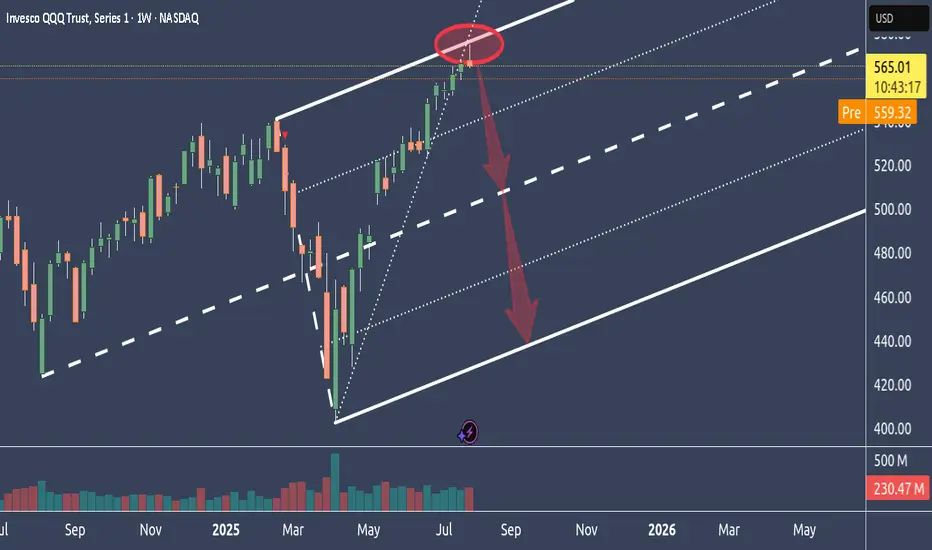
Why NQ is probably tanking big timeIn this weekly chart, we see QQQ, which represents the Nasdaq.
As we can see, it had a hell of a run up.
Too far too fast IMO, and it reached the stretch level at the Upper Medianline Parallel.
The natural move is now to let go, take a breath and trade down to center again, which is the Centerline.
After all the most major and most important earnings results are over, and Funds have pumped up their gains through manipulative Options plays, it's time to reap what they have planted and book the gains.
It's all in line with, all moves are at the point, and everything is showing in a simple chart.
Unless price is opening and closing outside of the U-MLH, it's time to load the Boat and sail to the South.
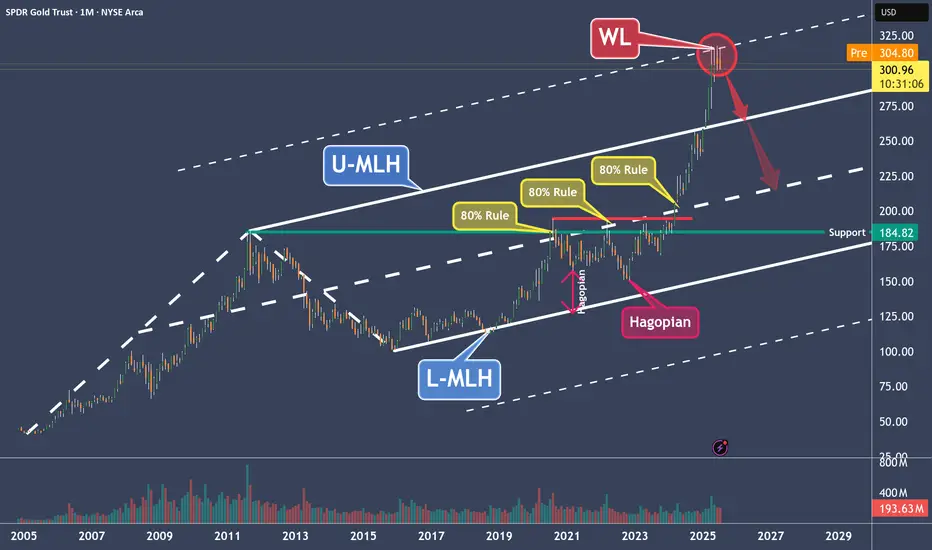
GLD – Why Gold Is a Clear Short to MePrice moved from the Lower Median Line (L-MLH) up to the Centerline, fulfilling the 80% rule.
Then we had two Hagopians, which sent price right back to the Centerline.
After the breakout above the Centerline, the next target was the Upper Median Line Parallel (U-MLH), which was reached rather quickly.
Finally, price broke above the U-MLH and was pulled up toward the Warning Line (WL).
Is this the end of the happy story?
I think so—because Gold has now reached its 2nd standard deviation, and there’s probably no more gas left in the tank.
The Trade:
- A logical target is the U-MLH.
- A secondary target is the Centerline.
At the very least, if you're long, this might be a good time to take some profits—because no tree grows to the moon.
For further details, I will follow-up with a Video explanation - See my Signature.
XMRUSD - Monero And It's Warning-LinesToday we’re analyzing Monero, with a focus on a new aspect of Median Lines — the Warning Lines, or WL for short.
Warning Lines are simply extensions of the distance between the Center Line (CL) and one of the Median Line’s outer boundaries, either the Upper Median Line Parallel (U-MLH) or the Lower Median Line Parallel (L-MLH).
So why are they important for us in our trading?
As you can see, WL1 and WL2 mark important price levels. WL2 is where price reversed, while WL1 acts as resistance.
Just like with the standard lines, our full trading rule set applies to Warning Lines too. This includes scenarios like a Hagopian, a breakout or "Zoom Through," and the Test and Re-Test.
Now, looking at the current analysis:
The price was rejected at WL1 after falling from WL2. This shows strong resistance at WL1, and now the price is heading toward the U-MLH.
If the price breaks below the U-MLH and starts opening and closing within the Fork again, there’s a strong chance it will move back toward the Center Line in the near future.
That could be your signal to take more profits, close the position, or possibly even short Monero.
Personally, I find it difficult to short crypto due to the high risk of manipulation by whales in the market. I prefer not to get caught in a short position if the price suddenly gaps to the upside. So I probably look to take a new position or add to an existing one, since it is a fair level where price found it's center.
That’s it for today.
Did you learn something new?
Great. See you next time, and trade safe.

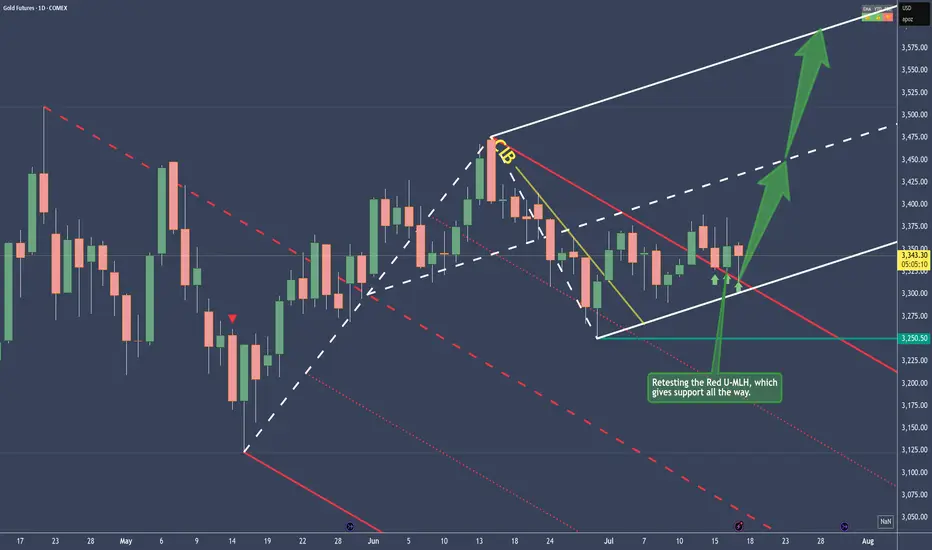
Gold - Bullish and here's whyPrice traveled within the Red Fork, until it broke the CIB Line, which is indicating a Change In Behavior.
From there on, sideways action, until the break of the Red U-MLH happened.
After the close above the Red U-MLH, price has tested it the 3rd time now. At the time of writing, the Bar looks like a PinBar. So it has good sepparation from the bottom, or a long Down-Wick. That's indicates good strenght.
To me this looks like a good long trade, but as everytime, play it save and don't let greed eat your brain ;-)