COPPER Multi-year Support held. Strong Buy Signal.Last time we had a look on Copper (HG1!) was almost 2 months ago (July 17, see chart below) and it delivered an instant return on our sell as it got rejected at the top of the Rising Wedge, quickly hitting our 4.700 Target:
The price just broke above its 1W MA50 (blue trend-line) again this week after completing 5 weeks below it. With the 1W MA200 (orange trend-line) intact as Support, the multi-year Rising Wedge should now technically initiate its new Bullish Leg.
Check also the 1W RSI, which just hit and rebounded on its 2-year Support Zone.
We expect a new Higher High on the Rising Wedge, targeting $6.000.
-------------------------------------------------------------------------------
** Please LIKE 👍, FOLLOW ✅, SHARE 🙌 and COMMENT ✍ if you enjoy this idea! Also share your ideas and charts in the comments section below! This is best way to keep it relevant, support us, keep the content here free and allow the idea to reach as many people as possible. **
-------------------------------------------------------------------------------
💸💸💸💸💸💸
👇 👇 👇 👇 👇 👇
Metals

XAUUSD – A New Bullish Wave Has BegunXAUUSD – A New Bullish Wave Has Begun
The Daily chart shows that gold has decisively broken above the flat resistance around 3,500 , marking a strong breakout after months of consolidation. This move completes the Ascending Triangle formation, confirming that buying pressure is in control.
In the short term, after the recent surge, the market may retrace slightly toward the 3,500–3,520 zone to retest this new support. If this level holds, the bullish trend is likely to continue, paving the way for further upside.
Key levels to watch:
Major Support: 3,500–3,520
Immediate Resistance: 3,575–3,600
Next Target: 3,700–3,750-3,800 if momentum remains strong
Technical signals remain aligned with the bulls. Any pullback should be seen as an opportunity to join the prevailing uptrend.
Do you think gold will push toward the 3,700 mark in this bullish wave?

#PAXGUSDT #1D (ByBit) Head & Shoulders near breakdownPax Gold printed a shooting star and is losing 50MA now, on daily.
Seems on the verge of a big retracement down towards 200MA support, once neckline is broken.
⚡️⚡️ #PAXG/USDT ⚡️⚡️
Exchanges: ByBit USDT
Signal Type: Regular (Short)
Leverage: Isolated (9.0X)
Amount: 4.9%
Entry Targets:
1) 3349.94
Take-Profit Targets:
1) 3049.06
Stop Targets:
1) 3500.75
Published By: @Zblaba
LSE:PAXG BYBIT:PAXGUSDT.P #1D #PaxGold TVC:XAU
Risk/Reward= 1:2.0
Expected Profit= +80.8%
Possible Loss= -40.5%
Estimated Gaintime= 1.5 months

XAU/USD | Gold Breaks $3500 – New ATH Hit! What’s Next?By analyzing the gold chart on the 12-hour timeframe, we can see that today, gold finally managed to print a new All-Time High (ATH)! As anticipated, price broke above $3500 and rallied up to $3508, hitting our previous bullish target and sweeping the liquidity resting above the key $3500 level.
After reaching $3508, gold entered a correction phase, dropping to $3470, but quickly bounced back and climbed to $3494. At the time of writing, gold is trading around $3478, showing a bearish reaction — but it's best to wait and see whether price gets rejected again from this level or not.
If gold is to undergo a deeper correction, the next potential downside targets are $3465, $3454, and $3420. This analysis will be updated — stay tuned for more confirmations from the market!
MY LATEST ANALYSIS :

GOLD: Local Bearish Bias! Short!
My dear friends,
Today we will analyse GOLD together☺️
The market is at an inflection zone and price has now reached an area around 3,554.68 where previous reversals or breakouts have occurred.And a price reaction that we are seeing on multiple timeframes here could signal the next move down so we can enter on confirmation, and target the next key level of 3,569.31.Stop-loss is recommended beyond the inflection zone.
❤️Sending you lots of Love and Hugs❤️

GOLD 4H CHART ROUTE MAP UPDATEHey Everyone,
After wrapping up our 1H chart idea, here’s the update on the 4H chart we shared Sunday. Absolute perfection. We saw the EMA5 cross and lock above 3424, which opened 3499, target hit. Then another EMA5 cross and lock above 3499 opened 3561, also hit perfectly, right to the point.
We were able to map a range target without any historical data, relying on the law of averages and it played out beautifully.
From here, we now need an EMA5 cross and lock above 3561 to open 3615. Failure to lock will likely see lower Goldturns tested for support and bounce.
We will keep the above in mind when taking buys from dips. Our updated levels and weighted levels will allow us to track the movement down and then catch bounces up.
We will continue to buy dips using our support levels taking 20 to 40 pips. As stated before each of our level structures give 20 to 40 pip bounces, which is enough for a nice entry and exit. If you back test the levels we shared every week for the past 24 months, you can see how effectively they were used to trade with or against short/mid term swings and trends.
The swing range give bigger bounces then our weighted levels that's the difference between weighted levels and swing ranges.
BULLISH TARGET
3424 - DONE
EMA5 CROSS AND LOCK ABOVE 3424 WILL OPEN THE FOLLOWING BULLISH TARGETS
3499 - DONE
EMA5 CROSS AND LOCK ABOVE 3499 WILL OPEN THE FOLLOWING BULLISH TARGET
3561 - DONE
BEARISH TARGETS
3347
EMA5 CROSS AND LOCK BELOW 3347 WILL OPEN THE FOLLOWING BEARISH TARGET
3277
EMA5 CROSS AND LOCK BELOW 3277 WILL OPEN THE SWING RANGE
3234
3171
EMA5 CROSS AND LOCK BELOW 3171 WILL OPEN THE SECONDARY SWING RANGE
3089
2996
As always, we will keep you all updated with regular updates throughout the week and how we manage the active ideas and setups. Thank you all for your likes, comments and follows, we really appreciate it!
Mr Gold
GoldViewFX

golden resistanceprice breaking through 3430 big static resistance
not just breakout but daily chart holding above that level
fed fomc will decide this move will sustain till 4k or just fakeout
if fed fomc dovish then 4k high chance
if fed fomc hawkish then it could be fakekout move

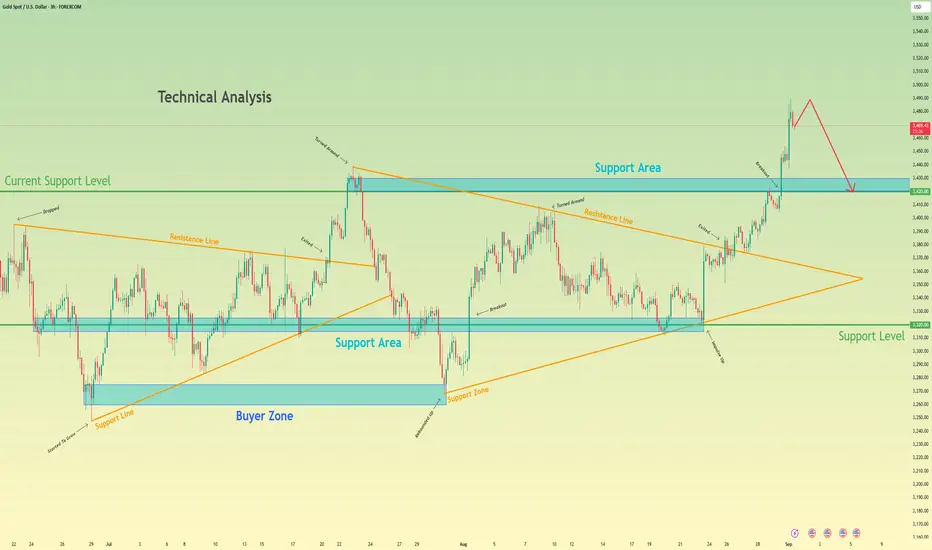
Gold may make correction, after strong upward movementHello traders, I want share with you my opinion about Gold. The prolonged period of consolidation for Gold has decisively resolved to the upside, following a powerful breakout from a multi-week symmetrical wedge. This event signalled a clear shift in market control to buyers, invalidating the prior ranging environment and initiating a new, impulsive bullish phase. The price action for XAU since the breakout has been characterised by a strong, high-momentum rally that has pushed the asset to new highs. Currently, this upward movement appears to be overextended, suggesting that the market may be due for a healthy corrective pull-back. The primary working hypothesis is a short, counter-trend scenario designed to capture this anticipated correction. The expectation is that the current rally will soon find a peak, exhaust itself, and undergo a sharp decline back towards the breakout point. This corrective fall would be a natural part of a healthy uptrend, allowing the market to test the old resistance as new support. Therefore, the TP is logically placed at the 3420 level. This target is highly significant as it corresponds precisely with the current support level and the support area where the breakout originated. Please share this idea with your friends and click Boost 🚀
Gold Hits New ATH – Is a Bearish Crab Reversal Next?Gold ( OANDA:XAUUSD ) started to rise today after the release of the
ISM Manufacturing PMI index formed a new All-Time High(ATH) .
The question is what price range could the new ATH price range for gold be in?
Gold is currently moving near the Potential Reversal Zone(PRZ)($3,557-$3,531) .
From a pattern analysis perspective , it looks like Gold is completing a Bearish Crab Harmonic Pattern . In fact, if we find a trigger at point D of the Bearish Crab Harmonic Pattern , we can confirm this pattern.
From an Elliott wave theory perspective , it looks like Gold is completing wave 5 . This wave 5 could act as the end of the main wave 3 .
I expect Gold to drop to at least $3,501 in the coming hours .
Second Target: $3,481
Third Target: Support zone($3,474-$3,466)
Stop Loss (SL) = $3,559(Worst)
Gold Analyze (XAUUSD), 15-minute time frame.
Be sure to follow the updated ideas.
Do not forget to put a Stop loss for your positions (For every position you want to open).
Please follow your strategy; this is just my idea, and I will gladly see your ideas in this post.
Please do not forget the ✅ ' like ' ✅ button 🙏😊 & Share it with your friends; thanks, and Trade safe.

XAUUSD: Market Analysis and Strategy for September 3rdGold Support and Resistance Levels:
4-Hour Chart Resistance: 3580, Support: 3450
1-Hour Chart Resistance: 3568, Support: 3500
30-Minute Chart Resistance: 3547, Support: 3526
The RSI on the daily gold chart is flashing an overbought signal, but momentum indicators rarely limit gold's bullish potential during periods of high uncertainty. Furthermore, the upward trendline is strong, and long-term bullish outlook for gold remains. Currently, gold prices are still trapped under key resistance near the new high of 3550, requiring further confirmation before a breakout is achieved. The 4-Hour Chart's MACD is forming a high-level golden cross with continued volume growth, and the STO indicator is rapidly moving upward into overbought territory, indicating a bullish trend in the 4-Hour Chart. The NY market is focusing on resistance in the 3568-3580 range above, and support at 3526/3508 below.
I recommend buying on dips. The short-term bull-bear dividing line is 3526!
With increased liquidity in the NY market, buying with the trend is always much less risky than selling.
Here are the NY market recommendations:
BUY: 3527-3522
BUY: 3508-3513

$GOOG $226 Premarket! 2.61 Golden Pocket Above for Puts Well what do we have here? We have Taz taking a peak at the GOOGLE pop 👀 would you just look at it? If you put the fib right at the last high and low, you get a nice Golden Pocket Target Above at $228.97 …
Now let’s be clear here. Congrats to the Bulls in my Room that saw that Alert from the Bot and Hopped in with the Big Boys.
For now, it’s time to go with tie short side imo. If we can get a tap of that 2.61 pocket above, I’ll swing something to the downside for next week. Targets would include a Gap fill. If not, then I will be patient and possibly not even enter. I would rather optimal entry. Then forced entry. Have a good one yall.

Gold Holds Near Record Highs – Bulls Target 3,572Gold – Update
Gold remains near record highs, gaining more than 5% on the week as demand strengthens. India has been increasing bullion purchases while reducing U.S. Treasury bill holdings, and BRICS-aligned nations continue to diversify reserves away from the U.S. dollar. Combined with renewed inflation and fiscal concerns in the West, these flows are providing strong support for the metal.
Technical Outlook:
📈 The price has printed a new ATH and holds bullish momentum as long as it trades above the pivot zone at 3,540–3,547. Upside targets are 3,572 → 3,588.
🔄 A short-term correction back toward 3,540 remains possible, but while above this level, the bullish bias remains intact.
📉 A confirmed break below 3,528 would shift momentum bearish, exposing downside toward 3,498 → 3,475.
Key Levels:
Pivot: 3,540 – 3,547
Resistance: 3,572 – 3,588
Support: 3,528 – 3,498 – 3,475
Bias: Strongly bullish above 3,540; bearish scenario activates only if 3,528 breaks.

SILVER Will Go Up! Buy!
Please, check our technical outlook for SILVER.
Time Frame: 12h
Current Trend: Bullish
Sentiment: Oversold (based on 7-period RSI)
Forecast: Bullish
The market is trading around a solid horizontal structure 4,089.7.
The above observations make me that the market will inevitably achieve 4,300.4 level.
P.S
Please, note that an oversold/overbought condition can last for a long time, and therefore being oversold/overbought doesn't mean a price rally will come soon, or at all.
Disclosure: I am part of Trade Nation's Influencer program and receive a monthly fee for using their TradingView charts in my analysis.
Like and subscribe and comment my ideas if you enjoy them!

XAUUSD Gold Trading Strategy September 3, 2025XAUUSD Gold Trading Strategy September 3, 2025: Gold prices are stable, heading towards the $3,550 mark with ETF capital flows boosting and the market is also waiting for employment data and developments from the FED.
Basic news: Spot gold prices remained stable in today's Asian trading session, after rising sharply in the previous session. The current international gold price is around $3,531/ounce, according to CMC Group's FedWatch Tool, the market is pricing in nearly 92% of the possibility that the Fed will cut 25 basis points at the meeting on September 17.
Technical analysis: Spot gold prices continue to increase strongly. The rising price channel remains. Currently, the MA lines and the Fib frame are still very good support areas for prices, however, the RSI is in the overbought area; we should be careful that prices will have a correction first and then increase again. We limit FOMO, continue to wait at support zones combined between MA, Fib and FVG zone.
Important price zones today: 3500 - 3505 and 3475 - 3480.
Today's trading trend: BUY.
Recommended orders:
Plan 1: BUY XAUUSD zone 3500 - 3502
SL 3497
TP 3505 - 3515 - 3530 - 3550.
Plan 2: BUY XAUUSD zone 3475 - 3477
SL 3472
TP 3480 - 3490 - 3500 - 3530.
Wish you a safe, effective and profitable trading day.💯💯💯💯💯

GOLD Buyers In Panic! SELL!
My dear friends,
GOLD looks like it will make a good move, and here are the details:
The market is trading on 3546.4 pivot level.
Bias - Bearish
Technical Indicators: Supper Trend generates a clear short signal while Pivot Point HL is currently determining the overall Bearish trend of the market.
Goal - 3538.4
Recommended Stop Loss - 3550.2
About Used Indicators:
Pivot points are a great way to identify areas of support and resistance, but they work best when combined with other kinds of technical analysis
Disclosure: I am part of Trade Nation's Influencer program and receive a monthly fee for using their TradingView charts in my analysis.
———————————
WISH YOU ALL LUCK

GOLD → Consolidation in the ATH zone. Risk zone...FX:XAUUSD hit a new all-time high of around $3,550 as investors worldwide rushed to safe-haven assets. As prices rise, the risk of profit-taking increases, especially with news coming up...
The key driver is the crisis in the bond market: long-term government bond yields are rising sharply in the UK and Japan. This is boosting demand for gold as a safe haven. We should also not forget about expectations of Fed easing: weak employment data could increase bets on a rate cut in September.
However, strong US employment data (starting with JOLTS today) could support the USD and limit gold's growth.
Correction: Record levels could trigger profit-taking, especially given that the price has come a long way since the last pullback, rising nearly 6% (7 days of growth).
Key factor: US labor market data (JOLTS today, NFP on Friday). Weak figures will strengthen gold, strong ones may cause a correction.
Resistance levels: 3546, 3550, 3575
Support levels: 3526, 3508, 3500
Technically, a retest of resistance at 3342-2246 could lead to a breakout and further growth. However, since the price has stopped updating its highs locally, I do not rule out the possibility of a retest of support at 3529-3526 before further growth. However, a weak reaction to support could lead to the formation of a pre-breakdown base, and a breakdown of support could trigger a decline to 3500.
Best regards, R. Linda!

Gold XAUUSD Intraday Move 3.9.2025🔹 Bias: Bullish Continuation After Liquidity Sweep
Gold remains in a bullish structure overall, consolidating around 3538 after failing to clear 3547, which suggests liquidity engineering beneath current levels before continuation higher.
🔹 Key Demand Zone (3526–3531)
This zone marks prior accumulation and the origin of the last bullish impulse. A controlled dip into this area would allow liquidity sweep and re-entry of buyers, making it the critical zone to watch.
🔹 Liquidity Above 3547
Equal highs have formed near 3547, indicating liquidity resting above this level. A breakout here, once demand is respected, can provide fuel for a strong push toward the 3567 objective.
🔹 Risk Management (3515 Invalidation)
The invalidation point sits at 3515. A sustained break below this level would indicate absorption of demand and shift bias away from buyers. Until then, risk-to-reward strongly favors longs.
🔹 Trade Plan
Entry: Scale in within 3526–3531 after confirmation of order flow shift (CHOCH or strong bullish displacement).
Stop-Loss: Below 3515.
Take Profits: Partial at 3544/3547, trail stop to breakeven above 3547, final target at 3567.
👉 This breakdown balances structure, liquidity, and execution plan—giving traders both reasoning and a clear actionable path.

Gold Pullback Toward 3,510 as BRICS Demand and Dollar Weakness.Hey Traders, in today's trading session we are monitoring XAUUSD for a buying opportunity around the 3,510 zone. Gold is trading in an uptrend, with price currently correcting toward this key support/resistance level.
Structure: The broader bias remains bullish, but price is retracing after recent highs.
Key level in focus: 3,510 — an important zone where buyers may look to step in and resume the upward trend.
Fundamentals: Geopolitical alignment among Russia, China, India, and North Korea strengthens the case for continued gold purchases by BRICS central banks. At the same time, the U.S. Dollar Index (DXY) has broken below 98.400 support and could retrace further to the downside, adding to gold’s bullish backdrop through negative correlation.
Trade safe,
Joe.

Gold (XAUUSD) Intraday Analysis – September 3, 2025On the M15 chart, gold has shown a strong breakout from previous consolidation, rallying up to test the 3,544 – 3,546 USD/oz resistance area. After touching this zone, price is consolidating in a tight range, reflecting ongoing buying pressure while some profit-taking has emerged.
Key Technical Levels:
Immediate Resistance: 3,544 – 3,546 (recent high, needs a breakout for bullish continuation).
Next Resistance: 3,560 – 3,565 (Fibonacci extension + previous supply zone).
Immediate Support: 3,528 – 3,530 (EMA20 on M15 + short-term structure support).
Major Support: 3,512 – 3,515 (logical stop-loss zone + previous swing low).
Price Action & Indicators:
Trendline remains intact on the M15 chart, confirming short-term bullish momentum.
RSI is holding between 58–62, showing room for further upside without being overbought.
EMA20 & EMA50 continue to provide bullish support in the intraday trend.
Trading Scenarios:
Bullish Scenario:
If price sustains above 3,530 and breaks 3,546 decisively, upside targets open toward 3,560 – 3,565, with extended potential to 3,580.
Safer entry: Wait for breakout and successful retest of 3,546.
Bearish Pullback Scenario:
Failure at 3,546 followed by a break below 3,528 could drive a correction toward 3,512 – 3,515.
This level should be monitored for potential demand and re-entry opportunities.
Strategy Suggestions:
Trend-following Buy: Buy stop above 3,546, TP 3,560 – 3,565, SL 3,528.
Short-term Counter Sell (scalping): Sell around 3,544 – 3,546 if bearish reversal candles appear, TP 3,528 – 3,515, SL 3,552.
Today, gold sits at a decisive zone: either a breakout above resistance to confirm bullish continuation, or a correction to test deeper supports. Risk management and patience for confirmation signals remain key.
- Follow for more daily gold strategies, and save this analysis if you find it useful.

Gold 30Min Engaged ( Bearish after Break Entry Detected )Time Frame: 30-Minute Warfare
Entry Protocol: Only after volume-verified breakout
🩸Bearish after Break - 3536
➗ Hanzo Protocol: Volume-Tiered Entry Authority
➕ Zone Activated: Dynamic market pressure detected.
The level isn’t just price — it’s a memory of where they moved size.
Volume is rising beneath the surface — not noise, but preparation.
🔥 Tactical Note:
We wait for the energy signature — when volume betrays intention.
The trap gets set. The weak follow. We execute.

Gold Lags Behind SilverGold lags behind silver. I’m referring to silver’s percentage gains outpacing gold, not suggesting that silver is becoming more expensive than gold. Investors and traders focus on percentage gains, whereas consumers buying jewelry make decisions based on how much it’ll actually cost them.
Last year, silver’s 60% gain outpaced gold’s 40%, and year-to-date, silver has once again outperformed gold with a 52% gain compared to gold’s 36%.
Micro Silver Futures
Ticker: SIL
Minimum fluctuation:
0.005 per troy ounce = $5.00
Disclaimer:
• What presented here is not a recommendation, please consult your licensed broker.
• Our mission is to create lateral thinking skills for every investor and trader, knowing when to take a calculated risk with market uncertainty and a bolder risk when opportunity arises.
CME Real-time Market Data help identify trading set-ups in real-time and express my market views. If you have futures in your trading portfolio, you can check out on CME Group data plans available that suit your trading needs www.tradingview.com

BTC - Perfect Bullish SetupPrice Action Breakdown
After running the lows with a clear Sell Side Liquidity Sweep, BTC quickly reversed and printed a Market Structure Shift (MSS). This marked the first real sign that the market might be ready to transition from weakness into strength.
Retracement Zone
Price is now retracing into a very interesting area — the overlap of a Bullish Fair Value Gap, an IFVG, and the Golden Pocket. When multiple imbalances and Fibonacci levels line up like this, it often builds a high-probability zone where institutions look to re-accumulate positions before the next move higher.
Upside Target
If this area holds and buyers step in, the next logical draw on liquidity sits above Buy Side Liquidity. That pool of stops acts like a magnet, and with the prior lows already cleaned, the path of least resistance could be higher.
Invalidation
On the other hand, a failure to hold inside the Golden Pocket would weaken this bullish narrative. A clean break below the sweep low would suggest that this rebound was only temporary relief before further downside.
Final Thoughts
This setup is all about how price reacts inside the retracement zone. If we see strength here, the run toward Buy Side Liquidity is very much in play. If not, patience will pay, as deeper levels will likely come into focus.
What’s your take — do you see this zone holding, or are you expecting another flush?
