$BTC.D Death Cross Has Occurred! The Signal on ₿itcoin Dominance We've Been Waiting All Cycle For 🔥
20 / 50 WMA Death Cross has officially occurred on CRYPTOCAP:BTC.D
So close to Alt Season I can taste it 😋
Moving Averages

$TOTAL Crypto Market Cap Fights Back w/ Weekly CloseCrypto CRYPTOCAP:TOTAL Market Cap looking similar to CRYPTOCAP:BTC
Thankfully did not close outside of the Danger Zone.
It's absolutely imperative that Bulls reclaim the 20WMA this week and close above the .236 Fib
Losing the 20WMA has signaled more downside / sideways chop historically.
Hopefully this is just a fake-out, otherwise the 50% Gann will be retested alongside the 50WMA.

$BTC Bulls Fight Back With Weekly CloseNot sure how I continue to amaze myself, but I do 🤓
Notice how those MMs respected my DANGER ZONE POI to the dollar?
Thankfully CRYPTOCAP:BTC did not close the Week outside the DZ.
The battle between Bulls and Bears is FIERCE 🔥
Bulls cannot afford another blue weekly close.
If so, the 50WMA retest ~102k will be inevitable.
Bulls need to reclaim and close this upcoming week above the 20WMA and .236 Fib
A close ~$116k would be super bullish.
That should be enough ammo to spark the long awaited parabola that UpTober has historically brought us.

my setupthe all chart indicator
with 1d 200 sma support
with fibo extension
with stochastics
all the way up

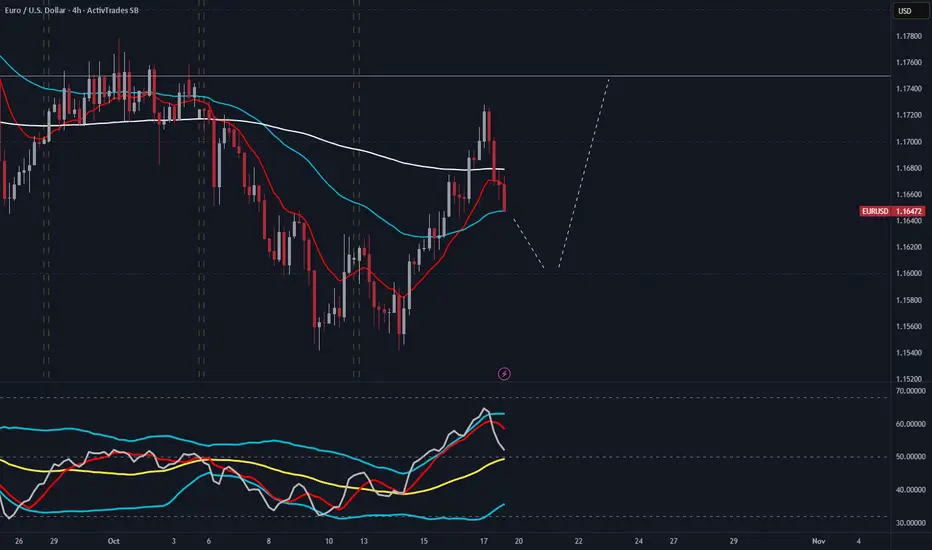
EUR/USD 4H Analysis EURUSD provided a double bottom and rallied it's away towards 1.17 then pulling back shortly after. I'd like to see the market reverse and continue the bullish rally after it's done with the pullback.
GBP/JPY 4H Analysis A bit of a tricky one on GBPJPY, no clear formation, however, we still have that unaddressed gap that was formed in the previous week, maybe we can see that getting filled. Pin off the Mayo.

BTCUSD SHORT to $100 000Market structure bearish on HTFs DW
Entry at a Strong level of Daily and Weekly Resistance
Weekly Rejection at AOi
Previous Structure point Weekly
Daily Rejection at AOi
Daily EMA Retest
Around Psychological Level 112,000
Touching EMA H4
H4 Candlestick rejection
Levels: BTC to hit $100 000
Entry 105%
REMEMBER : Trading is a Game Of Probability
: Manage Your Risk
: Be Patient
: Every Moment Is Unique
: Rinse, Wash, Repeat!
: Christ is King.

NZDUSD BUYUSD/NZD Analysis 🧠📉
Price formed a Head and Shoulders pattern and just showed a Break of Structure (BOS) to the downside. I’m now waiting for a retracement back to the neckline / POI for a possible sell setup. Once price returns, I’ll look for an engulfing candle or any strong bearish confirmation to secure the best entry for this trade.

Arweave shortEntry now: 3.94, with optional scale‑in on a pop that stalls around 4.04–4.10.
Primary targets: 3.72, then 3.55, then 3.35; take partials at each step.
Hourly setup (loose): stop above 4.28 or Entry + 2×ATR(1h); trail by ~1×ATR after first target.
4‑hour setup (loose): stop above 4.45 or Entry + 2.5×ATR(4h); add only if a bounce into 4.28–4.45 rejects.
Daily setup (loose): stop above 4.45 or Entry + 3×ATR(1d); bias remains bearish while short MA stays beneath long MA.
Weekly context: use very small size; catastrophic stop above the long MA region near 6.44–6.60 if holding for weeks.
Invalidation cue: sustained daily close back above ~4.28 weakens the short thesis; reduce or exit.
Risk control: risk 1–2% per trade and size via position‑sizing formula based on distance to stop for capital protection.

Bitcoin at the EdgeShort-Term View:
Bitcoin (BTCUSD) has broken below the lower boundary of its rising channel near $111,000–$112,000, signaling potential short-term weakness. However, the price is still hovering close to this zone, meaning a false breakdown and quick recovery could still happen.
If BTC reclaims $114,000, a rebound toward $118,000 → $122,000 becomes likely.
A daily close below $104,000 would confirm a deeper bearish move.
Long-Term View:
As long as Bitcoin stays above the $101,000–$102,000 area (the last major swing low), the broader bullish structure remains intact. A recovery back inside the channel could reignite the uptrend toward $125,000–$128,000.
If the breakdown holds and BTC closes multiple days below $101,000, the long-term support could shift lower toward $92,000–$88,000.
Summary:
Bitcoin is currently testing the bottom of a long-term ascending channel, making this a critical zone for market direction.
A recovery above $114K could turn sentiment bullish again, while sustained weakness below $104K opens the door to a larger correction.

S&P 500 at the Golden Support – Bounce or Breakdown?Short-Term View:
S&P 500 is testing its 50-day moving average near 6,470 after a recent correction from 6,800. A strong bullish reaction from this zone could push prices toward 6,850 → 7,000.
If the index closes below 6,550, short-term momentum turns bearish and a drop toward 6,400 becomes likely.
Long-Term View:
The broader trend remains bullish as long as price holds above 6,470–6,145.
Breaking below 6,145 would confirm a larger correction toward 6,000–5,800, while holding above this zone keeps the path open for new highs near 7,200.
Summary:
S&P 500 stands at a key technical decision zone — the market is deciding whether to resume its bullish trend or start a mid-term correction.

GoDaddy | GDDY | Long at $128.90GoDaddy NYSE:GDDY is the world's largest domain registrar, managing over 84 million domains for over 21 million customers. AI, particularly through GoDaddy's Airo platform and related GenAI tools, is poised to drive outsized growth by supercharging product innovation, customer value, and operational efficiency.
Technical Analysis
The stock has dropped 35% so far in 2025, but this was after a meteoric 208.5% rise from October 2023 to December 2024. The price has now regressed to my selected historical mean - a typical share-accumulation region for algorithmic trading when it comes to high-growth stocks. While this is often a solid area of support, it may dip down to $115 to shakeout retail traders. Obviously, further declines would occur if fundamentals change, but the forward growth is highly attractive, and I doubt it will "crash" from here if the outlook remains positive.
Earnings and Revenue Growth into 2028
Projected earnings-per share growth between 2025 ($5.98) and 2028 ($11.12): 86.0% (AI effect...)
Projected revenue growth between 2025 ($4.92 billion) and 2028 ($6.19 billion): 25.8%
Current P/E: 22x (remaining tech sector: 45.7x)
www.tradingview.com
Insiders
Warning: Lots of insider selling and no recent buying.
openinsider.com
Health
Debt-to-equity: 9x (very high, but due to aggressive share repurchases rather than distress)
Cash flow remains a bull case cornerstone, with accelerating free cash flow conversion (>100% of EBITDA) underscoring operational leverage from AI efficiencies and premium customer shifts.
Action
GoDaddy NYSE:GDDY is a prominent name and leader in domain registration. As AI enhancements lead to improvements in operational margins, earnings are likely to grow tremendously into 2028. Once agentic AI search enters the scene, it will be very interesting to better understand the importance of such a domain registration company for its successful implementation. While the price may dip beyond the historical mean to shakeout some retail traders, I think the future of this currently undervalued, high-growth company into 2028 is very bullish. Thus, at $128.90, NYSE:GDDY is in a buy-zone with potential near-term risk between $100 and $115.
Targets into 2028
$160.00 (+24.1%)
$200.00 (+55.2%)

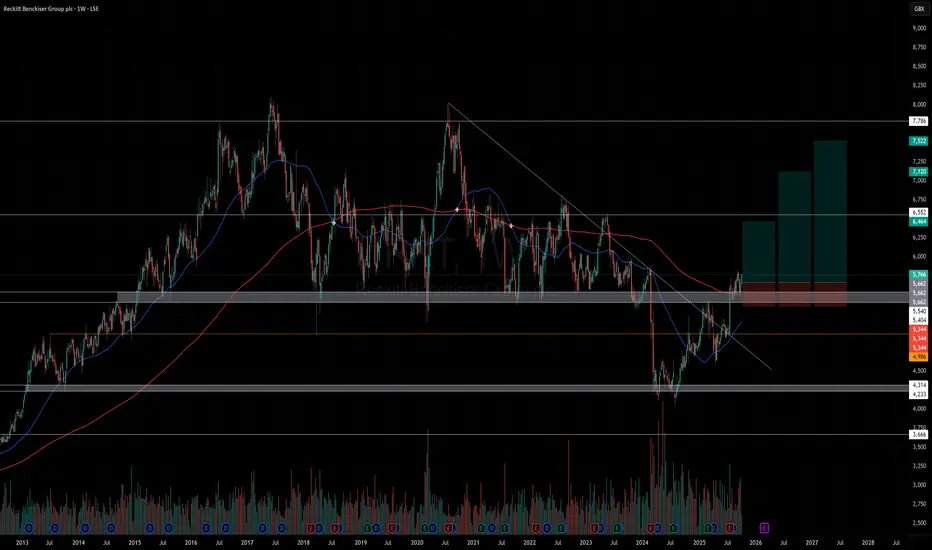
RKT on LSE - LongRKT on LSE - Long
Momentum trade
Price has broken out of trend line and reclaimed significant support level.
Price sitting on weekly 200ma.
Enter as close to entry price or support level.
TP1 - exit 35% position - Top of range & .618 Fib
TP2 - exit 35% position - .786 Fib
TP1 - exit 30% position - .886 Fib
EVTL - Low Risk LongEVTL - Low Risk Long
Enter now with SL.
Exit 20% of position at each of 5 TPs.
Playing the old historic level, with local confirmations.
Volume increasing once this level was recaptured, indicated increased market participants.
Price also above daily 200 MA

Bioceres Crop Solutions | BIOX | Long at $1.43Technical Analysis
Bioceres Crop Solutions NASDAQ:BIOX has entered my selected "crash" simple moving average. This area is often a zone of share accumulation and may result in a trend reversal (or a short-term stair-step down to $1 or lower before trading sideways).
Growth, Fundamentals, & Health
Not expected to become profitable again until 2028.
Earnings-per-shares growth from 2026 (-$0.26) to 2028 ($0.56): +323%
Revenue growth from 2026 ($350 million) to 2028 ($511 million): +46%
Current Fair Value: $5
Debt-to-Equity: 0.9x (very good / healthy)
Altman's Z-Score/Bankruptcy Risk: .9 (high risk, some financial distress)
Action
75% technical analysis play and only 25% based on company fundamentals. The only major risk based on the data is bankruptcy. The near-term could be rough for the company, but the outlook into 2028 shows significant growth. Thus, at $1.43, NASDAQ:BIOX is in a personal buy zone. There could be near-term risk near $1 or a bit lower, but this one is a total gamble. Time will tell.
Targets into 2028
$2.00 (+39.9%)
$4.00 (+179.7%)

Amazon at the Edge – Bounce or Breakdown?On the daily chart of Amazon (AMZN), the price is sitting right on its long-term uptrend line — a trendline that has supported the stock multiple times since early 2023. The current price hovers around $220, with the 50-day SMA near $225, acting as short-term resistance.
In the short term, a confirmed move above $225 could trigger a rebound toward $235 and $248. A logical stop loss for this bullish scenario is below $210, where the short-term structure would weaken.
In the longer-term view, as long as the price stays above the uptrend line (around $205–$208), the broader trend remains bullish with targets at $255 and $270. However, a confirmed breakdown below $200 would invalidate the uptrend and could lead to a deeper correction toward $185.
Overall, Amazon is at a critical decision zone — the next few sessions will reveal whether it bounces back into strength or breaks its multi-year trendline support.

Use Average as Resistance for GoldGold is rising rapidly, making this a risky trade. The 21-period EMA usually works well for gold on the 15-minute timeframe. With a trailing stop set just above the moving average, I’m planning to target the trendline.

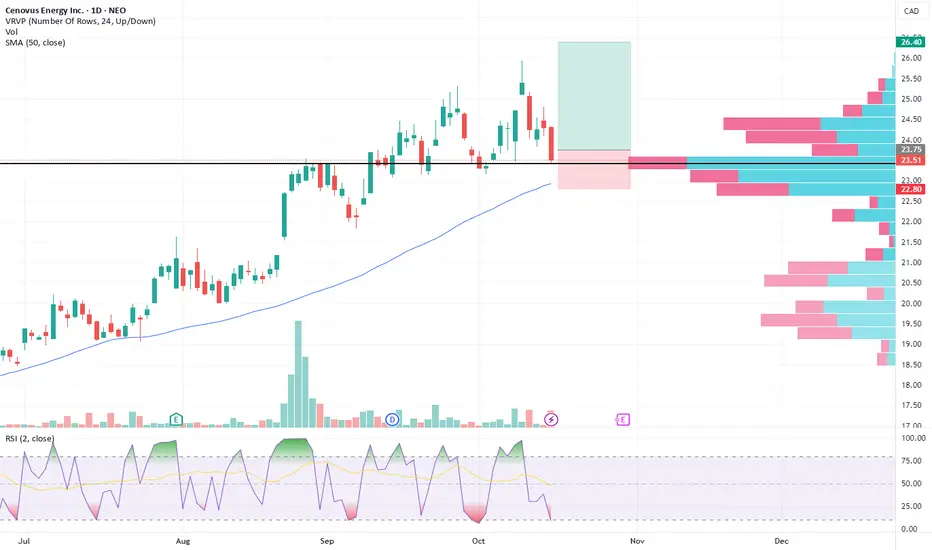
CVE — Swing Trade💰 CVE — Swing Trade Breakdown
🏢 Company Snapshot
CVE (Cenovus Energy Inc.) is a Canadian integrated energy firm active in oil sands, conventional, refining, transportation, and marketing. The stock has traction now due to elevated energy prices, tightening supply, and its ongoing M&A with MEG Energy (bid recently sweetened).
📊 Fundamentals
P/E: ~17× (vs oil & gas peers ~15–20×) — in line, not overly stretched
Google
+1
P/B: ~1.5×–2× (modest premium, consistent with energy sector norms) — decent balance sheet multiple
Debt/Equity: moderate (levered but manageable given cash flow)
ROE: mid-teens % (reflecting solid profitability for the sector)
Dividend Yield: ~3.3% — yields plus growth angle in energy exposure
Google
+3
Investing.com
+3
StockAnalysis
+3
Summary: Sector-aligned valuation, decent income buffer, acceptable leverage in a strong commodity backdrop.
📈 Trends & Catalysts
Revenue growth: stable to modestly rising (benefits from upstream + refining mix)
EPS trend: relatively steady with occasional volatility — recent quarters deliver modest beats
Balance sheet: steady cash flow; potential debt reduction if oil prices hold
Catalysts:
• MEG Energy acquisition resolution (bid escalation ongoing)
• Crude oil and natural gas price strength / OPEC supply signals
• Canadian energy sector rotation in seasonal demand cycles
Risks: valuation sensitivity to commodity downside, regulatory/tax changes, execution risk on M&A, emissions regulation headwinds
🪙 Industry Overview
Weekly: up modestly (energy sector in positive zone)
Monthly: outperforming broader TSX (rotation into energy)
12-month: outperformed general market on rising commodity tailwinds
Sentiment: Bullish — flow shifting into energy and resource plays as cyclical bets ramp
📐 Technicals
Price ≈ 24.20–24.50
50-SMA ≈ 22.50 (price above → trend favoring bulls)
RSI(2): ~12–18 (nearing oversold short term)
Pattern: bullish consolidation off rising support; possible flag / continuation setup
Support: 22.80 – 23.50
Resistance: 25.50 – 26.50
🎯 Trade Plan
Entry Zone: 23.80 – 24.40 on strength or pullback
Stop Loss: 22.80
Target: 26.40 (first leg), stretch 27.50
Risk/Reward: ~3× on base target
Alternate Setup: If breaks above 25.50 convincingly, use a retest as continuation entry
🧠 My Take
CVE offers a clean swing setup with mixed support from fundamentals and commodity strength. I favor initiating on a dip near support ahead of the next leg upward, capturing energy tailwinds while limiting downside via tight stop.
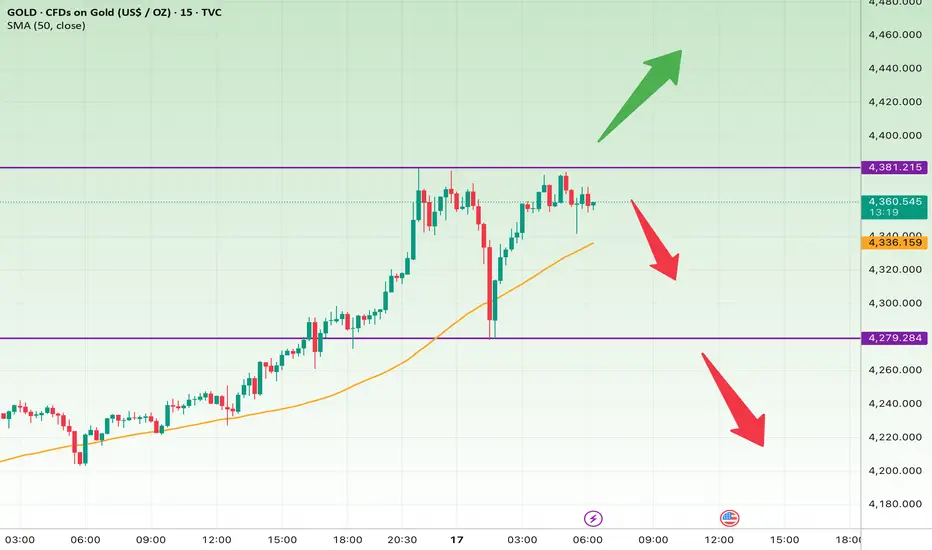
Gold at Decision Point – Break or Correction?On the 15-minute gold chart, price is testing the key resistance around $4,381. This level has acted as a ceiling several times, suggesting strong selling pressure. The 50-period SMA at $4,234 still supports the broader uptrend, but momentum appears to be weakening near resistance.
In the short term, a close below $4,340 could trigger a pullback toward $4,280 and possibly $4,240. A reasonable stop loss for this scenario is above $4,385.
In the longer-term view (over the next few sessions), if gold breaks and sustains above $4,381, we could see an upside move toward $4,400 and $4,460. The protective stop for this bullish setup should be below $4,275.
Overall, gold is at a decision point — a breakout could signal continuation of the bullish wave, while rejection from resistance may lead to a short-term correction.
NIFTY Projection Base On Price action , Divergence Base, Possibility for Nifty Movement.
Do your Own Due Diligence before Trade

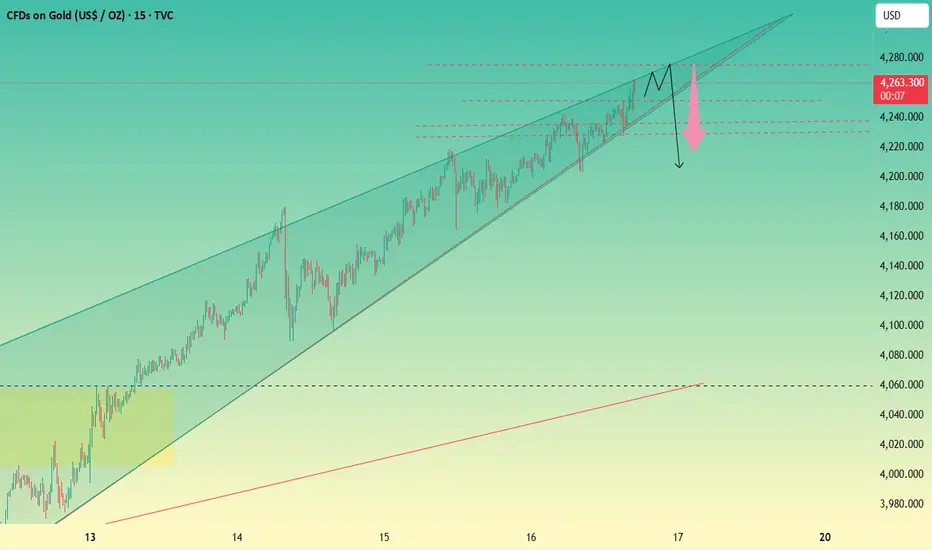
At the end of the ascending triangle, go shortToday, gold opened with a volatile climb and then consolidated at elevated levels. The bulls still have lingering momentum, but gold has been trading above its 5-period moving average for three consecutive days now. Since the start of this unilateral rally from 3,311, gold has consistently advanced with support from the 5-period moving average—only once did it find support at the 10-period moving average. When gold deviates from the 5-period moving average for an extended period and keeps rallying nonstop, a pullback correction is likely to occur. Furthermore, gold is trading at the end of an ascending triangle pattern, leaving little room for further movement, and a trend reversal could happen at any time.
Realistically, due to the U.S. government shutdown, it’s nearly impossible to make reliable judgments based on economic data right now—the data is simply too untrustworthy, and any outcome would come as no surprise. That said, I don’t believe inflation will ease at all. In fact, the U.S. government shutdown has dealt a severe blow to the U.S. economy. Additionally, tariff tensions have never truly subsided; on the contrary, they are currently escalating step by step. Under such circumstances, I don’t think U.S. inflation will slow down—in fact, I lean toward the possibility of further inflationary pressures. If that’s the case, the Federal Reserve will likely put rate cuts on hold. Even if a rate cut is forced through in October, it will impact the progress of future rate cuts. Once inflation heats up, gold faces a high risk of a sharp collapse.
In terms of market trading, gold’s rebound after the previous collapse has only fueled more bullish buying. Paradoxically, this has made the market unafraid of another collapse—traders now assume that any drop will be quickly followed by a rally to new highs. Amid the uptrend, chasing highs remains common, and rightly so, given the impressive gains in recent days. However, this could well be a sense of inertia instilled by the market, designed to make traders trust the bullish trend. If gold falls again, the decline will likely exceed 100 points.
Resistance Levels: 4,275, 4,300
Support Levels: 4,235, 4,220
Trading Strategy
While others are cautious, we’ll be greedy. We plan to consider shorting gold around the 4,275 level in the evening, waiting for a trend reversal.
For specific trading decisions, please follow my real-time updates. I post my trading ideas and strategies daily. If you lack a plan or clear direction for gold trading and struggle to achieve consistent, stable profits, you can refer to and follow my updates as a reference and guide to help you avoid mistakes.
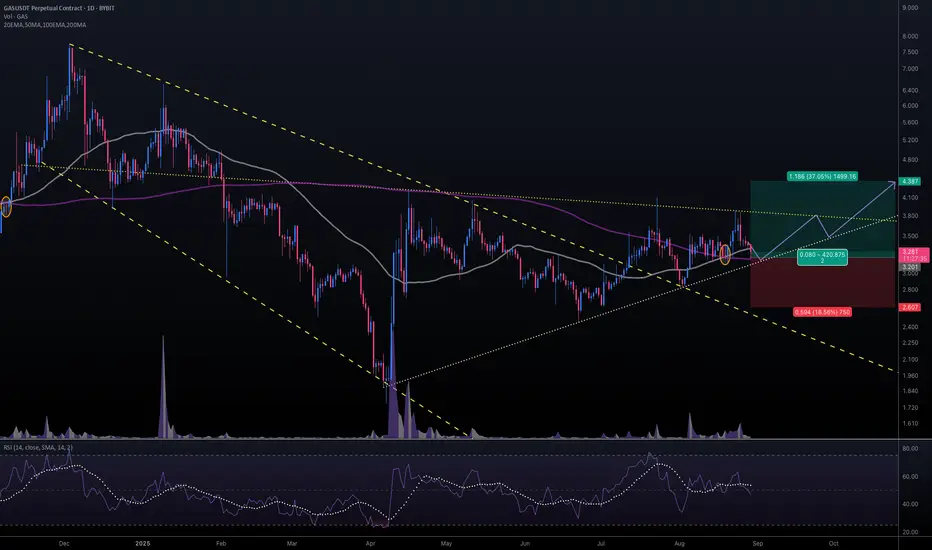
#GASUSDT #1D (ByBit) Falling broadening wedge breakout & retestNeoGas printed a golden cross on daily and a morning star at the same time, just like last year.
Also formed a triangle, seems likely to bounce on 200MA support then break bullish in the coming weeks.
⚡️⚡️ #GAS/USDT ⚡️⚡️
Exchanges: ByBit USDT
Signal Type: Regular (Long)
Leverage: Isolated (2.0X)
Amount: 5.4%
Current Price:
3.281
Entry Targets:
1) 3.201
Take-Profit Targets:
1) 4.387
Stop Targets:
1) 2.607
Published By: @Zblaba
HOSE:GAS BYBIT:GASUSDT.P #1D #NeoGas #dBFT neo.org
Risk/Reward= 1:2.0
Expected Profit= +74.1%
Possible Loss= -37.1%
Estimated Gaintime= 1-2 months
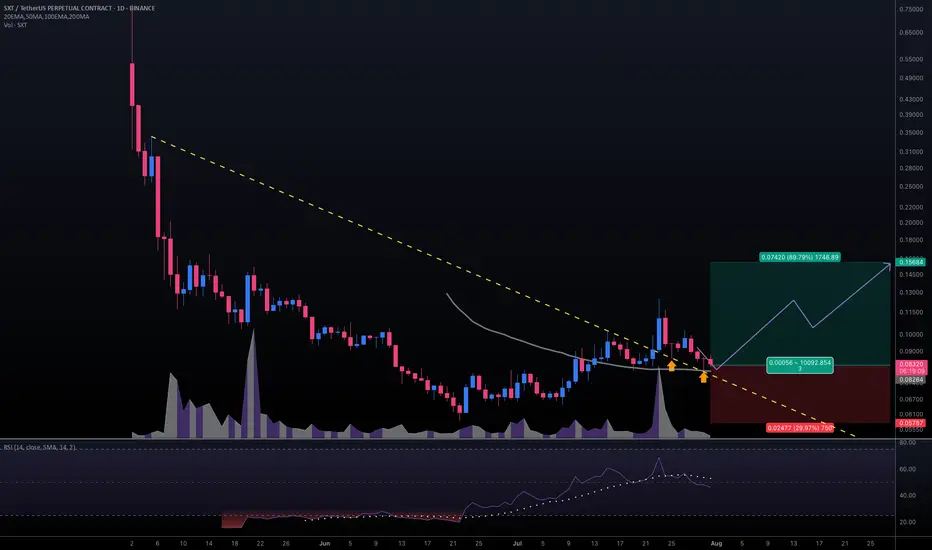
#SXTUSDT #1D (Binance Futures) Descending trendline break retestSpace and Time (SXT) pulled back to 50MA daily support, looks ready for mid-term recovery after those two dragonfly dojis in a row.
⚡️⚡️ #SXT/USDT ⚡️⚡️
Exchanges: Binance Futures
Signal Type: Regular (Long)
Leverage: Isolated (2.0X)
Amount: 5.0%
Entry Targets:
1) 0.08264
Take-Profit Targets:
1) 0.15684
Stop Targets:
1) 0.05787
Published By: @Zblaba
NYSE:SXT BINANCE:SXTUSDT.P #1D #SpaceAndTime #ZK #AI #DPoS spaceandtime.io
Risk/Reward= 1:3.0
Expected Profit= +179.6%
Possible Loss= -59.9%
Estimated Gaintime= 1 month