$TOTAL Crypto Market Cap Incredible Weekly Close!The Crypto CRYPTOCAP:TOTAL Market Cap showed incredible resilience after nuking ~25% this week.
Closed the Week just below the WEMA9 at $3.86T, but above the .236 Fib and stayed cleared of the DANGER ZONE ⚠️
Notice that wick all the way down to the 50WMA where it bounced literally right off the trendline breakout I drew back in July.
Those MMs are really respecting my TA these days huh 🤓
This dump covered the 50% Gann level retrace, which give me confluence that the hardest part of behind us.
Bears weren't even able to form a Bearish Engulfing candle.
Next up Bulls need to reclaim the 9WEMA as mentioned in the previous post.
Moving Averages

China’s DeepSeek AI Predicts the Price XRP,Shiba,DogeChina's DeepSeek AI, a cutting-edge model rivaling ChatGPT, has issued bold predictions for XRP, Shiba Inu (SHIB), and Dogecoin (DOGE), forecasting explosive gains by year-end 2025. Amid market dips, DeepSeek remains optimistic, projecting XRP to $10 (230% from $3.03), SHIB to $0.00005–$0.0001 (8x from $0.00001203), and DOGE to $1.50–$3 (6–12x from $0.25). These forecasts, based on technical patterns and market trends, highlight potential for new all-time highs. This article breaks down DeepSeek's analysis, key factors, and trading signals for these assets. Position for the rally as sentiment turns bullish.
DeepSeek's Bullish Outlook: XRP to $10
DeepSeek sees XRP reclaiming July highs, targeting $5–$10 if it breaks $3 resistance. With RSI at 50 trending upward and bullish falling wedge patterns, XRP could surge 230% from $3.03. The SEC lawsuit resolution in early 2025 removed hurdles, boosting institutional adoption. On-chain: volume +7.58% to $9.72 trillion in August, whale accumulation +15%. Sentiment 71% bullish, correlating 0.8 with Nasdaq. Risks: ETF delays (5–7% dip). Prediction: $3.50–$4.20 short-term, $10 by year-end.
Shiba Inu (SHIB) to $0.0001: Meme Magic Reborn
SHIB, Dogecoin's rival with $7.7 billion cap, is in accumulation between $0.00001 and $0.00012. DeepSeek predicts $0.00005–$0.0001 (8x upside) if it clears $0.000025 by November, forming a falling wedge or bullish flag. Shibarium Layer-2 enhances utility, reducing fees and boosting scalability. RSI at 62 (near overbought) and light volume signal a breakout. On-chain: activity +300%, but 171% May spike shows volatility. Sentiment 68% bullish. Risks: memecoin fatigue (5–7% dip). Prediction: $0.000025 breakthrough, $0.0001 by year-end.
Dogecoin (DOGE) to $3: Viral Momentum
DOGE, up 1.1% daily to $0.25, has doubled yearly, outperforming BTC and ETH. DeepSeek forecasts $1.50–$3 (6–12x) by year-end, with RSI at 50 upward and multiple bullish patterns (falling wedge). Volume spikes with ETH moves, and 2021 peak of $0.73 signals potential. On-chain: whale accumulation +15%, NRPL low at 3.48 million ADA equivalent. Sentiment 71% bullish. Risks: profit-taking (5–7% dip). Prediction: $0.73 retest, $1.50–$3 by year-end.
Trading Signals: RSI and MACD
Based on recent trends:
XRP ($3.03): RSI at 50. Bullish MACD (+0.12)—target $5–$10 (65–230%). Support $2.82, resistance $3.00.
SHIB ($0.00001203): RSI at 62. Bullish MACD (+0.10)—target $0.00005–$0.0001 (4–8x). Support $0.00001, resistance $0.000025.
DOGE ($0.25): RSI at 50. Bullish MACD (+0.15)—target $1.50–$3 (6–12x). Support $0.24, resistance $0.2738.
Overall: RSI 50–62 signals buys on dips for 4–12x gains. Risks: market corrections (5–7% dip); hedge with USDC.
Conclusion: DeepSeek's Bold Call
DeepSeek's predictions—XRP to $10, SHIB to $0.0001, DOGE to $3—signal explosive year-end gains amid technical breakouts and utility upgrades. RSI 50–62 and bullish MACD suggest 4–12x upside—buy dips for the rally.
What’s your pick? Comment below!
#XRPPrediction #SHIB #Dogecoin #CryptoForecast #TradingSignals

Is the Bitcoin market bearish?📊 Bitcoin Market Psychology Analysis
Market psychology analysis is one of the most fascinating and practical approaches to understanding Bitcoin's current position! 🎯
🎭 Market Psychology Cycle Phases:
1. Hope Phase 🟦
Likely the current point for many assets
· 📈 Description: After a panic-driven crash, the market stabilizes and consolidates within a relatively stable range
· 💰 Price hasn't returned to previous lows and shows occasional small positive breakouts
· 😌 Sentiment: Fatigue from the downturn, but quiet hope for gradual improvement
· 👴 Experienced investors accumulate while newcomers remain cautious
· 📊 Indicator: Moderate trading volume typically
2. Optimism & Belief Phase 🟩
· 🚀 Description: Price begins breaking key resistance levels
· 📰 Media gradually starts paying attention again
· 😨 Sentiment: FOMO (Fear Of Missing Out) among experienced investors
· 😞 Regret over selling at the bottom
· 📈 Indicator: Beginning of increasing trading volume
3. Greed & Euphoria Phase 🟨
· 📈 Description: Full-blown bullish phase - price rises consistently and rapidly
· 🗞️ Positive news dominates everywhere
· 👥 Friends and acquaintances talk about massive profits
· 💭 Sentiment: Belief that "this time it's different" and "price only goes up"
· 💸 Greed for more profits and borrowing to buy
· 📊 Indicator: Very high trading volume and positive media coverage
4. Denial Phase 🟧 - Danger Point!
· 📉 Description: Price falls from the peak
· 🤦 Many investors consider this just a "temporary correction"
· 🔮 Expect a return to the peak
· ❌ Sentiment: Strong denial
· 🛒 Buying during the decline hoping for recovery
· 📊 Indicator: Trading volume remains high
5. Fear, Panic & Capitulation Phase 🟥
· 🚨 Description: Sharp and rapid decline
· 📉 Price experiences consecutive breakdowns
· 😱 Sentiment: Intense fear, panic selling
· 💔 Acceptance of heavy losses - absolute despair
· 📊 Indicator: Very high selling volume
6. Apathy & Depression Phase ⬜
· 😴 Description: Market remains stagnant with low volatility for extended periods
· 💤 Prices are low and boring
· 🚫 Sentiment: Complete disinterest in the market
· 👋 Most people have accepted defeat and exited the market
· ☠️ Talk of "Bitcoin's death" resurfaces
· 📊 Indicator: Very low trading volume and minimal media attention
---
💡 Golden Insight:
Understanding these phases can help you make the best trading decisions! ✨
---
📌 Market Psychology + Technical Analysis = Trading Success 🚀
---
💬 Let's Interact!
I'd love to hear your thoughts! 👇
· 🤔 Which phase do you think we're currently in?
· 📊 What's your market outlook for the coming months?
· 💭 Share your technical analysis perspective
· 🎯 Have you used market psychology in your trading strategy?
· 📉 What indicators do you find most reliable?
· 💡 Any successful trades based on market sentiment?
· 🔮 Where do you see Bitcoin in the next 6 months?
Let's learn from each other! Share your comments and analysis below 👇
Your experience and insights are valuable - let's build our trading knowledge together! 🌟
Feel free to ask any questions or share your trading experiences! 💪

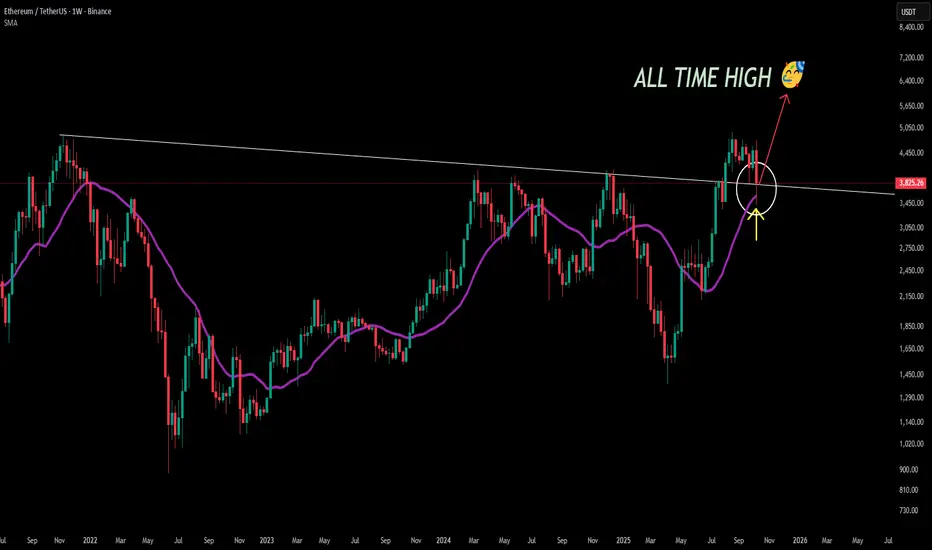
ETH might make a new all time highFrom the current weekly structure, Ethereum (ETH) appears to have completed its corrective phase. Yesterday’s move shows a clean retest of both the 20-period SMA and the long-term descending trendline, confirming this area as a strong confluence zone of support.
This reaction signals a potential reversal point where buyers may regain control. Given this setup, my bias turns bullish — I believe ETH has likely finished its downside correction and could be setting up for a major upward leg.
📈 Outlook: Over the coming months, I expect Ethereum to build momentum and potentially print a new all-time high if market conditions remain supportive.
Still, markets are inherently unpredictable — this remains my personal technical view, not financial advice.
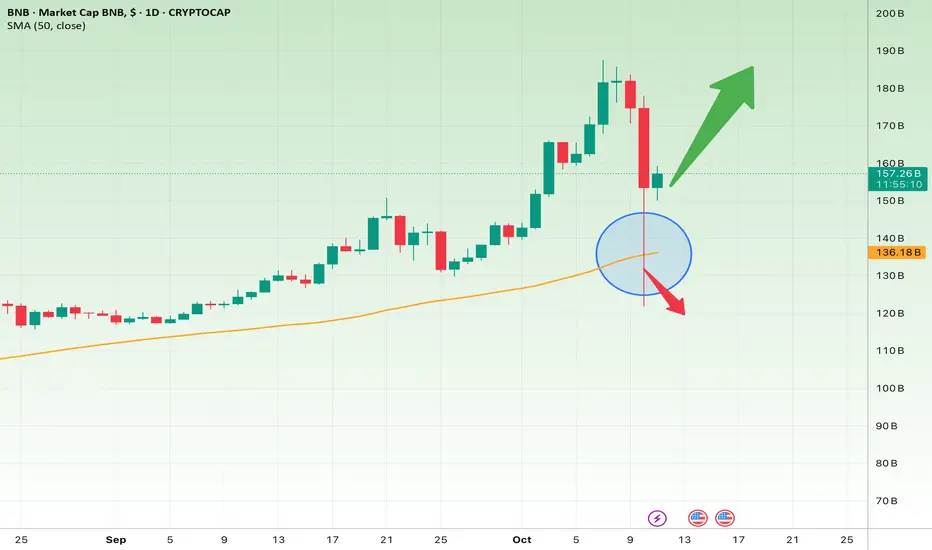
BNB at the Edge of Reversal or Breakdown?
Short-Term Outlook (1–2 Weeks)
The BNB market cap has recently corrected sharply and is now testing its 50-day SMA around $136B, which acts as strong support.
If BNB can hold above $155B, a rebound toward $170B–$180B is likely.
However, a daily close below $136B would confirm weakness and may push the value down to $125B–$110B.
Short-Term Setup:
Entry Zone: Above $155B after confirmation
Targets: $170B → $180B
Stop Loss: Below $136B
Long-Term Outlook (1–3 Months)
The overall trend remains bullish, and the recent pullback to the SMA50 could be a healthy correction within that uptrend.
If the price stays above $140B–$150B, the next upside targets are $190B–$200B.
But a confirmed break below $136B would signal a structural shift and potential decline toward $110B.
Long-Term Setup:
Bullish Case: Hold above $140B → Targets: $190B → $200B
Stop Loss: Below $136B
Bearish Case: Break below $136B → Targets: $125B → $110B
Stop Loss: Reclaim above $145B
Summary:
BNB sits at a key decision zone. Holding $136B could spark a strong rebound, but losing that support may trigger a deeper correction in the coming weeks.
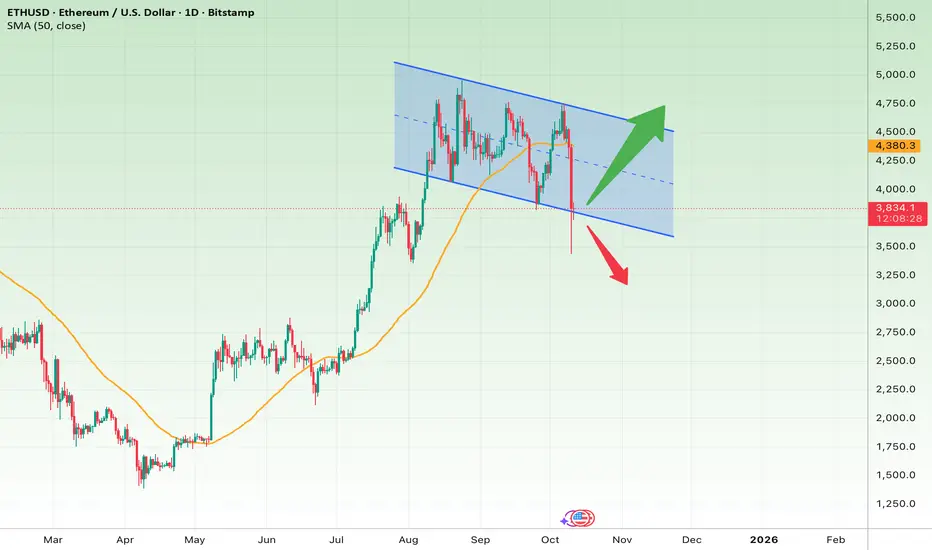
Ethereum at a Turning PointShort-Term Outlook (1–2 Weeks)
Ethereum has been moving inside a descending channel, with recent price action testing the lower boundary. The 50-day moving average (SMA50) around $4,380 acts as strong resistance.
Currently, ETH is trading below that level and close to the lower trendline — a zone of high sensitivity.
If price rebounds and closes above $3,900, a short-term recovery toward $4,250–$4,500 is likely.
However, a daily close below $3,700 would confirm a breakdown, opening the path toward $3,400–$3,200.
Short-Term Setup:
Entry Zone: Above $3,900 after confirmation
Targets: $4,250 → $4,500
Stop Loss: Daily close below $3,700
Long-Term Outlook (1–3 Months)
ETH remains within a medium-term descending channel, showing no confirmed breakout yet.
If it can reclaim and sustain above $4,500, the bearish pattern would be invalidated, and a rally toward $4,800–$5,000 could follow.
But a confirmed breakdown below $3,700 would strengthen the bearish case, potentially leading price down to $3,200–$2,900.
Long-Term Setup:
Bullish Case: Close above $4,500 → Targets: $4,800 → $5,000
Stop Loss: Below $3,900
Bearish Case: Close below $3,700 → Targets: $3,200 → $2,900
Stop Loss: Reclaim above $3,900
Summary:
Ethereum is standing right at a decision zone. The $3,700 level acts as the key pivot — holding it could trigger a rebound toward $4,500, while losing it might mark the start of a deeper correction in the months ahead.
Bitcoin at a Crossroads: Strong Rebound or Impending Breakdown?Short-Term Analysis (1–2 Weeks)
The chart shows Bitcoin moving within a clear upward channel. Price recently touched the lower boundary of this channel — a zone that typically attracts buying pressure. The 50-day Simple Moving Average (SMA50) is currently around $114,300, acting as a near-term resistance.
Given the current bounce attempt from the lower trendline, if price holds above $113,000, a recovery toward $118,000–$122,000 is likely.
However, if a daily candle closes below $110,000, it would signal a potential channel breakdown, exposing Bitcoin to a decline toward $104,000.
Short-Term Setup:
Potential Entry: Around $112,500 after a confirmed rebound
Targets: $118,000 → $122,000
Stop Loss: Daily close below $110,000
Long-Term Analysis (1–3 Months)
The ascending blue channel remains intact and defines the broader bullish structure. Each touch of the lower boundary has so far led to a move toward the channel top. If Bitcoin reclaims and sustains above the 50-day MA, the next upside targets are in the $126,000–$128,000 range.
Conversely, a confirmed breakdown below the channel bottom (around $109,000) could flip the market structure to bearish, opening downside targets at $102,000–$98,000.
Long-Term Setup:
Bullish Scenario (as long as channel holds):
Targets: $126,000 → $128,000
Stop Loss: Below $109,000
Bearish Scenario (if breakdown confirmed):
Targets: $102,000 → $98,000
Stop Loss: Reclaim above $112,000
Summary:
Bitcoin is currently sitting at a critical decision point. Short-term signals suggest a possible rebound from the channel’s lower edge, but a daily close below $110,000 would confirm weakness.
From a long-term view, the overall trend remains bullish as long as the ascending channel structure stays intact.

$BTC.D Head and Shoulders + Death CrossWho remembers when I put out this Head & Shoulders idea for CRYPTOCAP:BTC.D September 2nd? 🤓
On the verge of the 20 / 50 WMA Death Cross ☠️
This SHOULD be the top for ₿itcoin Dominance.
Does not mean that it won't float around here for a few weeks tho 🫶

$BTC 200DMA Retest Prophecy Has Been FULFILLED!Ladies and Gents,
the 200D Retest Prophecy has been FULFILLED!
At 186 days, this was the second longest retest after a Death Cross in Bitcoin's history.
If PA convincingly reclaims the 50MA, that should mark the bottom.
PA looks like it will close the day outside of the DANGER ZONE, so I'm hopeful 🤓

KSCP big BRRRRRRR RRRR R R R R playI posted about this guy a bit earlier but now were seeing a great setup.
the prior golden cross did not look golden due to the price action that prompted the cross.
This setup for a pre cross play looks MUCH better. We had a little pump in july which very much helps build out channels for future run ups.
Strong floor has been made at 6.42, we should set stop loss at about 5 dollars, maybe a little less if youre feeling frisky.
My plays are to load up shares at this level. Looking for a 2x scalp at ~12.64
From there depending on price action, we will try to follow trend into the targets 2 and 3. The green plots in the past price action from the ichimoku indicator helps create these targets, as do the price actions from the fakeout pump.
one can play options as well at the 12.5 level
i would do long term options if thats the case due to the fact we have yet to cross 50/200
though if were feeling frisky, Feb calls might be really juicy. I might look into that tomorrow.
what I would LOVE.... is a continuation to 10 dollars for a cup, which I would defintiely sell for a quick scalp, and then possibly try to get back in at around 8.5 for the handle and then break out up to target 1.
CASHRULESEVERYTHINGAROUNDMECREAM!

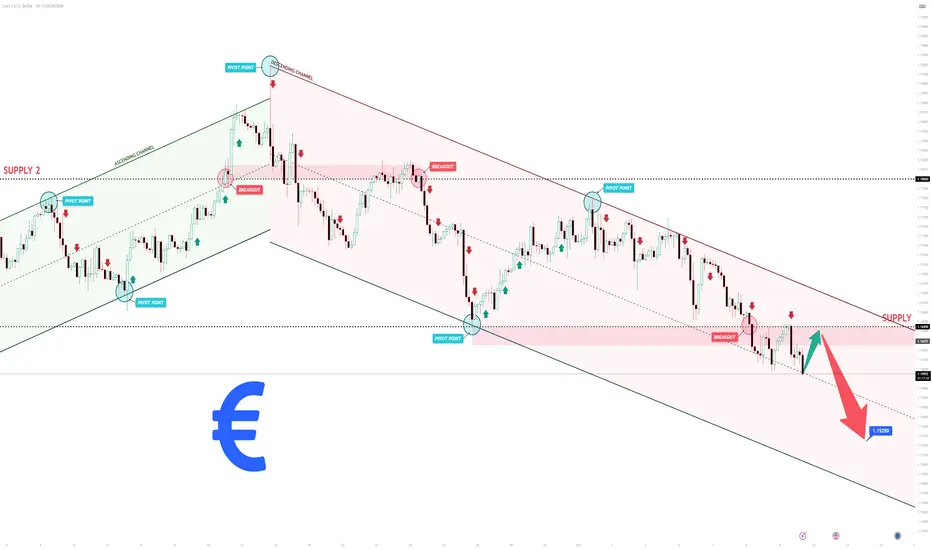
EURUSD Short: Trend Continuation to 1.1525 pointsHello, traders! The prior market structure for EURUSD has shifted to a bearish bias. This occurred after a failed breakout above the 1.1800 resistance level, which concluded a prior ascending channel. The subsequent reversal established the current descending channel, which has been guiding the price auction lower through a series of lower highs and lower lows.
Currently, the price action has confirmed its weakness by breaking below the key horizontal support at the 1.1645 level. After some consolidation below this level, the auction is now making a corrective pullback. This price action is setting up a classic retest of the broken support as new resistance, which is a critical point for the market.
My scenario for the development of events is a continuation of the downtrend. I believe this rally is a corrective retest that will fail upon reaching the 1.1645 resistance level. In my opinion, a confirmed rejection from this area will validate the bearish control and trigger the next impulsive move down. The take-profit is therefore set at 1.1525. Manage your risk.
Bitcoin STRONG Weekly Bounce - What's Next?Hello BTC Watchers 📈
📢 Bitcoin was trading right on top of a crucial support zone. But the price has successfully bounced in the weekly and made a strong comeback from the support zone.
The weekly moving averages
The daily moving averages
This is telling for a number of reasons. In the weekly we see a strong bounce above the moving averages as well as in the daily, and in the daily we had just bounced back from a correction which took us to the 100d MA (which is the general zone for a correction, or at least a wick towards that area. This indicate that in the short and longer term, the chart is looking up and bulls are in control.
What are you thoughts, new ATH or just a fakeout?

Bitcoin (BTC), End of Cycle Season Based on Cycle DurationBINANCE:BTCUSDT
Bitcoin appears to have already formed its peak within the current bullish cycle and may now be preparing for a correction.
Alternatively, if BTC makes another attempt to reach a new all-time high within October, that period could mark the final peak of this cycle.
Looking at historical data, Bitcoin has shown a repeating pattern —
an uptrend lasting approximately 3 years and 11 months (1,065 days) from the bottom,
followed by a downtrend of about 1 year (365 days) from the peak.
During down cycles, the cycle low has typically formed between the EMA 50 and EMA 100.
Backtesting monthly charts shows that Bitcoin often breaks below the EMA 50, finds support above the EMA 100, and then breaks through the Ichimoku Cloud, signaling the start of a new bullish cycle.
Become an early follower and be part of the journey.🚀
I am Korean and I used Google Translate.

AUDUSD Bearish EMA(Exponential Moving Average)Wanna share a clean setup to test the strategy
Moving average - Down
Restest resistance
Rejction candle
Extra confirmation with dxy going up soon

Canopy: LONGCanopy Market Cap: 400M
Risk Profile: Medium to High risk
Trading above the very important 21 Weekly MA
Broke the 200 daily MA just now at around 1.50
There is some overhead resistance (Red Striped Line) at 1.68
then previous top at 1.90
then, i expect to break it, going for the orange line at around 2.50
Last few days we have some nice pre market buying as well. Since August some nice uptick in volume as well!!
Think we can do a couple off X's from here.
Chart is 'cluttered' but important trend lines, Moving Averages and i drawn a cloud to test something.
Zoomed Out and less clutter:

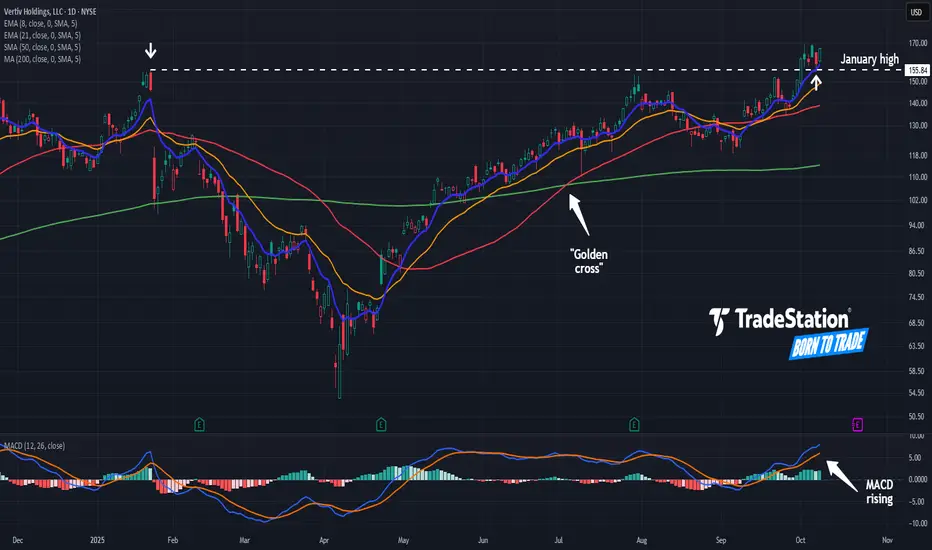
Vertiv May Have Broken OutVertiv was an early leader in the AI rally, and now it may be breaking out again.
The first pattern on today’s chart is the January high of $155.84. The provider of data-center power and cooling products began October by breaking above that level. This week, it pulled back to test it. Has old resistance become new support?
Second, prices wavered on either side of their 50-day simple moving average (SMA) for a few months and could now be accelerating from that line.
Third, the 50-day SMA had a “golden cross” above the 200-day SMA in July. That may suggest its longer-term uptrend is resuming.
Next, the 8-day exponential moving average (EMA) is above the 21-day EMA. MACD is also rising. Those signals may indicate the short-term trend has grown bullish again.
TradeStation has, for decades, advanced the trading industry, providing access to stocks, options and futures. If you're born to trade, we could be for you. See our Overview for more.
Past performance, whether actual or indicated by historical tests of strategies, is no guarantee of future performance or success. There is a possibility that you may sustain a loss equal to or greater than your entire investment regardless of which asset class you trade (equities, options or futures); therefore, you should not invest or risk money that you cannot afford to lose. Online trading is not suitable for all investors. View the document titled Characteristics and Risks of Standardized Options at www.TradeStation.com . Before trading any asset class, customers must read the relevant risk disclosure statements on www.TradeStation.com . System access and trade placement and execution may be delayed or fail due to market volatility and volume, quote delays, system and software errors, Internet traffic, outages and other factors.
Securities and futures trading is offered to self-directed customers by TradeStation Securities, Inc., a broker-dealer registered with the Securities and Exchange Commission and a futures commission merchant licensed with the Commodity Futures Trading Commission). TradeStation Securities is a member of the Financial Industry Regulatory Authority, the National Futures Association, and a number of exchanges.
TradeStation Securities, Inc. and TradeStation Technologies, Inc. are each wholly owned subsidiaries of TradeStation Group, Inc., both operating, and providing products and services, under the TradeStation brand and trademark. When applying for, or purchasing, accounts, subscriptions, products and services, it is important that you know which company you will be dealing with. Visit www.TradeStation.com for further important information explaining what this means.
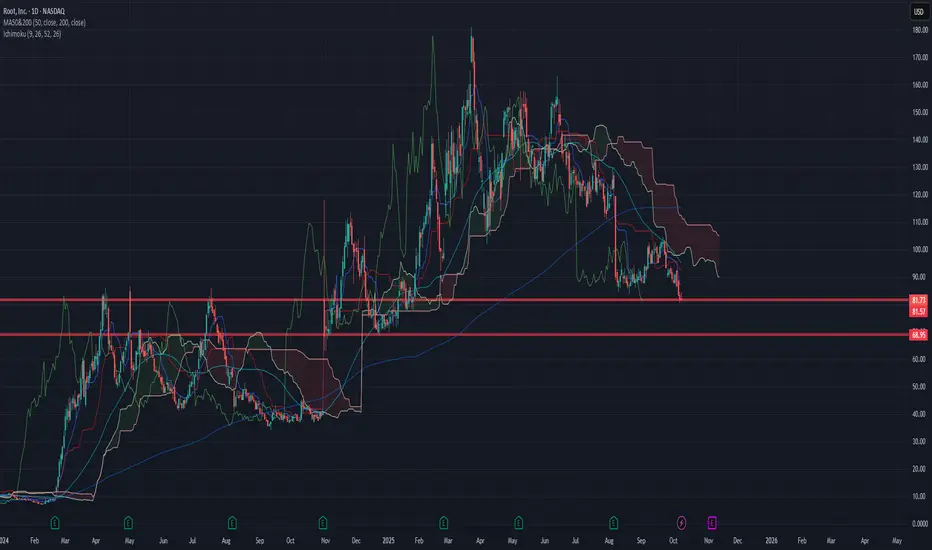
ROOT possible short playfound someone trying to pump this ticker on reddit.
i dont think its bad in the long term but this price structure needs to fix itself
that being said, quite likely we will fall more. puts at 69
Gold Minetghe gold is going crazy and the retail trader can't unpush the buy botton , its our way out thinking that the market in the US is shutting down everyone is running to buy gold , we follow the trend and aim for some new levels

A relatively Clear & Simple Bitcoin trading strategyRecently, I've noticed something. Something so simple that anyone with a simple EMA indicator can use, to achieve relatively clear, simple signals for BUYING & SELLING (or shorting) Bitcoin. Go ahead and backtest it to see what I mean.
Nearly everytime BTC crosses and closes above the EMA 33 line on the 6-hour chart Bitcoin goes much higher. And the opposite is also an effective SELL signal, as well. Go ahead and test it, I'll wait...
If Bitcoin does one of those sideways movements for a few weeks, just wait for the next clear signal instead of constantly buying and selling each time it crosses the EMA 33. It'll eventually separate and gain distance from the EMA and will start to be a clear signal again. Comments and Critics are welcome but be polite!

Retractable Technologies | RVP | Long at $0.76Retractable Technologies AMEX:RVP is a cyclical OTC stock that may be in a consolidation / accumulation phase for a major rise in the next 1-2 years. The reason this stock got my initial attention is the CEO bought $800,000 worth of shares over the last two years, with his buy range between $0.60 and $1.28. Pulling up the chart, my historical simple moving average (SMA) line seems to predict (quite well for this ticker) the sudden rise in price (i.e., as the SMA lines get closer to the price, there is a jump in price). The stock only has a 13.1 million float.
Between 2017 and 2019, the stock price consolidated near the levels seen during the last two years. Then, once my selected historical SMA reached the price, it jumped, consolidated further and rose to over $21.00... Now, I don't necessarily think the price will rise that high. There are currently two open price gaps on the daily chart (highest near $6.00) that may get closed.
I may be very early, on time, or the stock could go to zero. But if the CEO is going to risk that much for a current penny-play, I will dabble in the risk and simply be patient until SMA connects with the price.
Nothing to discuss regarding the fundamentals of this one (not great)... it's purely a technical analysis play.
Target #1 = $1.00
Target #2 = $1.25
Target #3 = $1.50
If it soars...
Target #4 = $4.18
Target #5 = $5.90

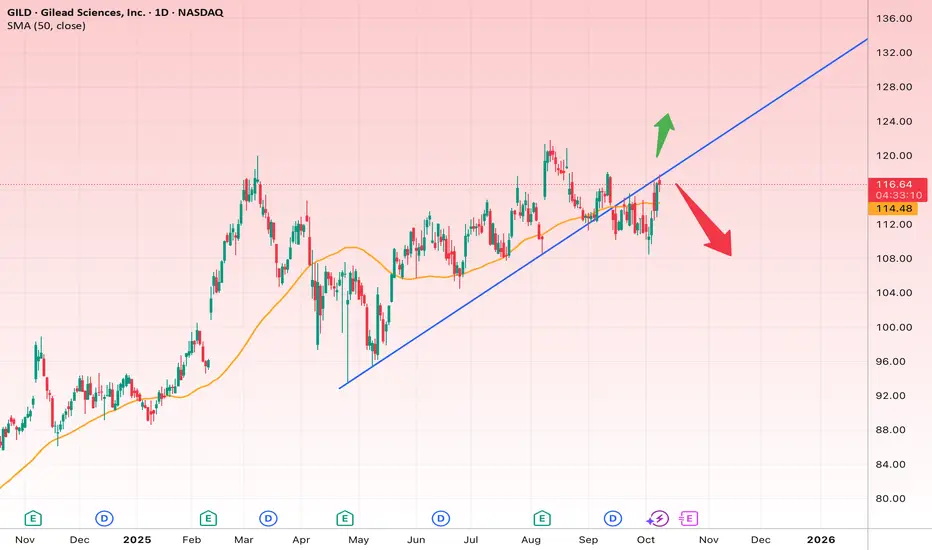
Gilead’s Critical Battle at the Uptrend Line!
Analysis:
The daily chart of Gilead Sciences (GILD) shows that the stock, after a short-term correction, is once again approaching its main uptrend line (blue). The 50-day moving average (orange) around $114.50 acts as a key support level, and the current price is trading slightly above it.
At this stage, the stock sits at a decisive point — it could either reclaim its bullish momentum by breaking above resistance or enter a deeper corrective phase if support fails.
Short-term outlook (2–4 weeks):
If the price manages to hold above $118, the next upside targets are in the $119.80–$124.80 range. This area represents the short-term bullish objective.
A reasonable stop loss for this scenario is just below $114.
Long-term outlook (2–3 months):
If the stock breaks decisively above $125 and maintains that momentum, the next major targets would be in the $130–$134 range, which also aligns with the previous highs.
However, if the blue uptrend line breaks down and a daily candle closes below $113, a bearish move toward the $106–$108 range becomes likely. In that bearish scenario, the stop loss should be placed above $113.
Overall, GILD is at a decision point. As long as it trades above $114, the bullish outlook remains valid — but losing that support could shift the balance in favor of the bears.
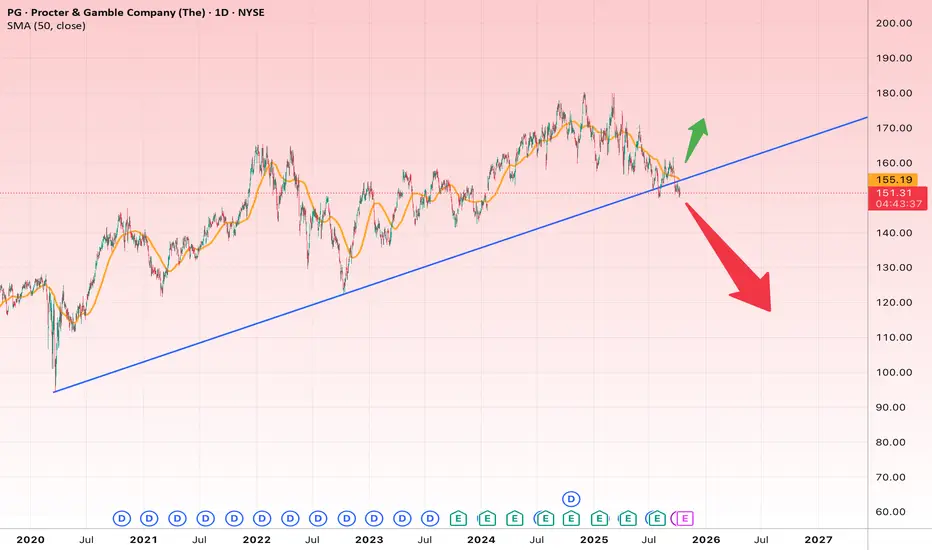
PG at the Edge: Break or Bounce?
🔹 Long-Term Overview
Since 2020, PG has been in a steady long-term uptrend, well supported by the rising blue trendline on the chart.
This trendline has acted as strong support multiple times in recent years — and once again, the price is testing it near the $150 zone.
This area is a make-or-break level for PG. Holding above it could trigger a new rally; breaking below could lead to a deeper correction.
⏳ Short-Term Outlook (1–3 months)
PG is currently trading below its 50-day moving average, showing short-term weakness.
However, it’s sitting right on the major trendline — meaning buyers may step in if this support holds.
Watch for a daily close to confirm direction:
A close above $155 would confirm a rebound toward $165–$170.
A close below $148 would signal a confirmed breakdown.
🎯 Short-Term Targets:
Bullish: $165 → $170
Bearish: $140 → $132
🛑 Stop-Loss:
For longs: below $148
For shorts: above $156
📈 Long-Term Outlook (6–12 months)
Two major scenarios are forming:
Scenario 1 – Trend Holds (Bullish)
If PG defends its long-term trendline, the broader uptrend remains intact.
This setup may evolve into a double-bottom formation, targeting new highs.
🎯 Long-Term Upside Targets:
First: $175
Second: $190
🛑 Stop-Loss: below $145
Scenario 2 – Trendline Break (Bearish)
If the weekly candle closes below $145, the four-year uptrend will be broken.
In that case, PG could retrace toward $130 or even $115–$110 in an extended correction.
🎯 Long-Term Downside Targets:
First: $130
Second: $115
🛑 Stop-Loss: above $155
Stock Influencers + 3-Step Rocket Booster Strategy Some days back there was a superstar actress that did an advertisement
For this company.
It was full of nice imagery,but then this ad caused that big Gap up you see
To the left of this chart?
This famous actress, Sydney Sweeney, 👖caused that gap 🤔
Influence is a big part of the financial markets.Maybe you are thinking
Becoming a trader means
You old school and you won't roll with the "latest" pop trends.
But that won't be the case.
Infact trading and pop culture are very much related.You will be shocked.
Just check the breakingnews tab below the price on tradingview.
Financial markets will always be a part of pop culture. Why?
Because entrepreneurs and investors always work together.
Remember that I actually noticed that one of my followers comes from the Andrew tate community.
Yes man, 😊 am a mini - influencer in the financial markets.
So this skill is not a small thing rich people will value your knowledge the moment you master trading.
This pattern follows the 3 Step
Rocket 🚀 Booster Strategy:
👉The price has to be above 50 EMA
👉The price has to be above 200 EMA👉The price should gap up
That last step you can clearly see on the chart.
And what I love about this chart is that the support is clear. From the appearance of the gap.
This gives you confidence that the price wont go lower.
Liquidity is above 500K volume
The price is "sitting" on the 50 EMA.
I need to document this strategy because I want a 🔥 fire trading system that works.
Join me on this trading journey to discover a powerful trading system.
Disclaimer ⚠️ Trading is risky please learn about risk management and profit taking strategies.Feel free to use a simulation trading account before you use real money.
