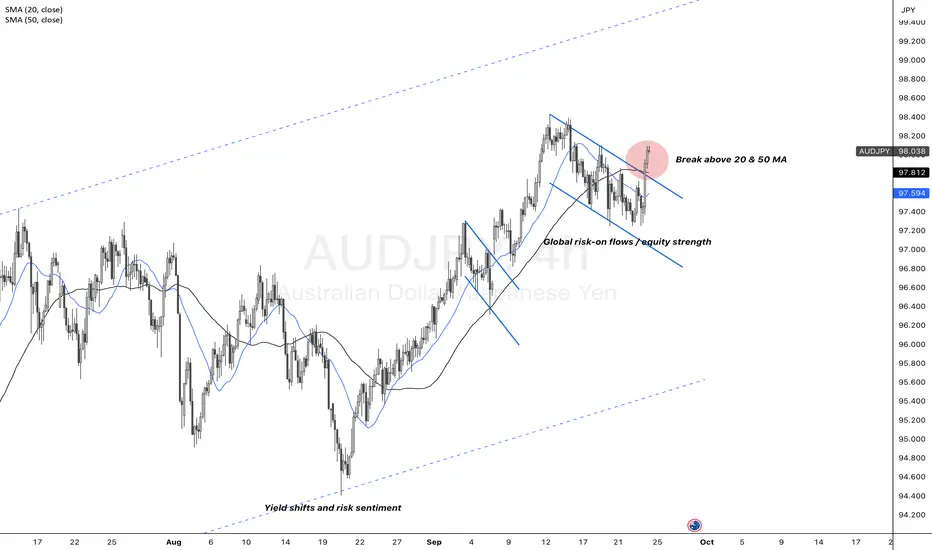
AUDJPY | Fresh Flag Breakout Within Channel – What’s Next?AUDJPY has extended its breakout from the flag formation, reinforced by a decisive move above the 20- and 50-day moving averages. This alignment signals strengthening trend momentum within the broader ascending channel. Near-term catalysts remain RBA policy signals, BOJ guidance, and broader risk sentiment, with the upper channel boundary now the next technical focus.
Moving Averages
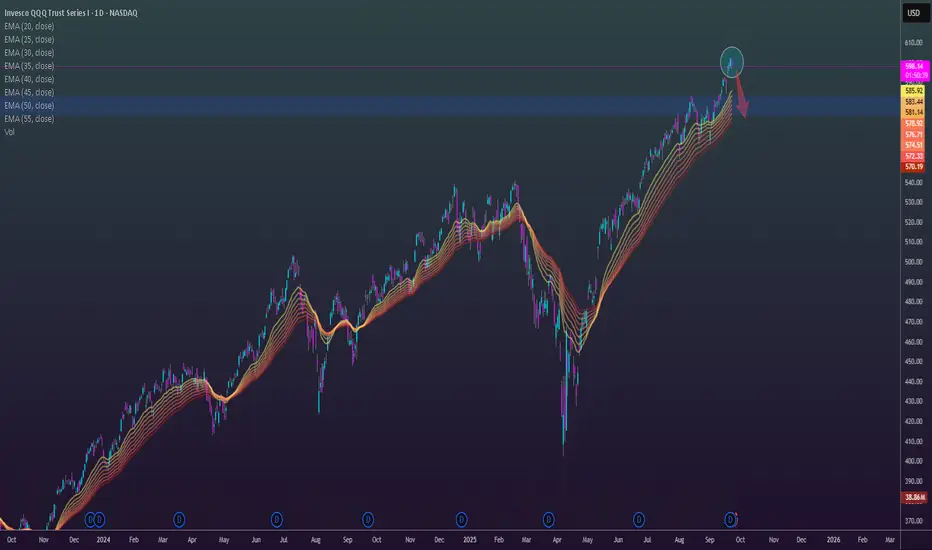
Powell: Stock Prices appear "Fairly Highly Valued"“We do look at overall financial conditions, and we ask ourselves whether our policies are affecting financial conditions in a way that is what we’re trying to achieve,” Powell said. “But you’re right, by many measures, for example, equity prices are fairly highly valued.”
“Markets listen to us and follow and they make an estimation of where they think rates are going. And so they’ll price things in,” Powell said in part of the conversation dealing with mortgage rates.
Though Powell noted the lofty equity values, he said this is “not a time of elevated financial stability risks.”
Not really something you want your central banker saying to keep positive momentum in the stock market. Particularly when the Nasdaq is fairly stretched. A downside scenario could see us pulling back into the EMA bands to 575s for the $QQQ.
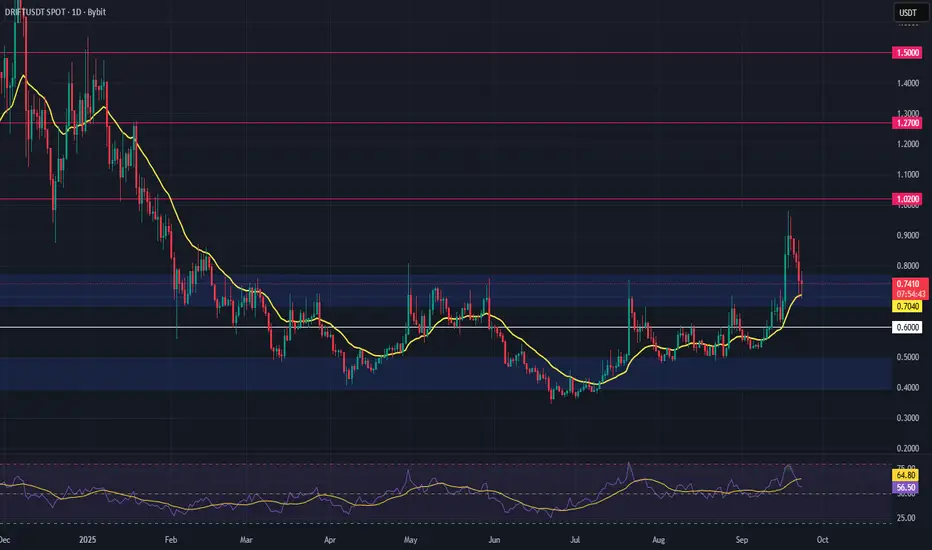
DRIFT Breakout Setup – Higher High + Retest in PlayDRIFT is showing strong bullish momentum after months of accumulation. The token has broken out, printed a higher high, and is now retesting the previous range high as support — a classic setup for continuation.
With price hovering near the 21-day EMA, this zone could act as a launchpad if sentiment holds. The structure supports a potential leg higher, making this a high-reward, low-risk opportunity for swing traders.
🔹 Trade Setup
Entry Zone: $0.68 – $0.72
Take Profit Targets:
🥇 $1.02
🥈 $1.27
🥉 $1.50
Stop Loss: Daily candle close below $0.60
📊 Keep an eye on volume confirmation and overall market sentiment. A clean bounce from this support zone could validate the setup.
📌 Like, comment, or share your thoughts below!
🔔 Follow for more crypto setups and technical insights.
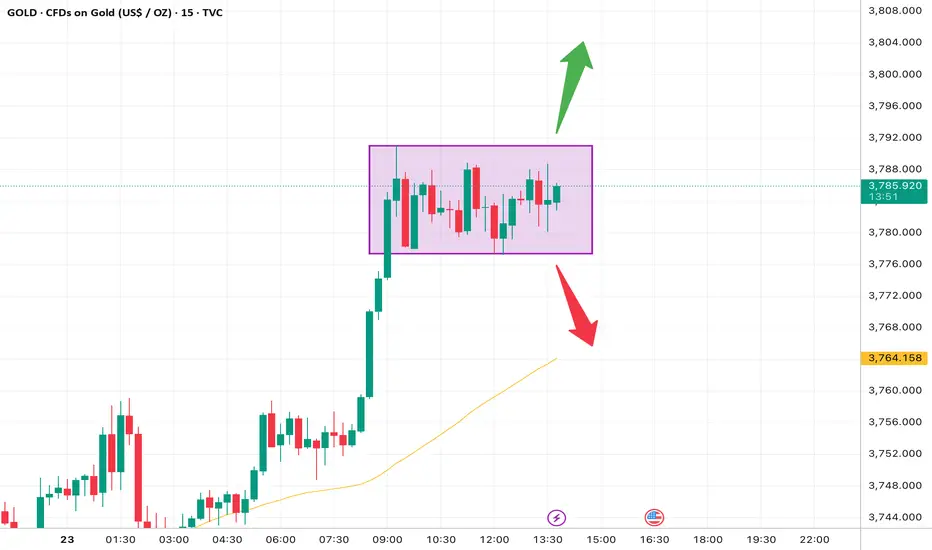
Gold in Tight Range. Breakout Imminent on 15M Chart📊 Professional Analysis
Timeframe & Price Action
This is XAUUSD on the 15-minute chart. After a strong bullish impulse, price has entered a sideways consolidation range between 3780 – 3790 (purple box).
Market Structure
Prior trend: Strong bullish rally.
Current action: A box/range formation — the market is gathering liquidity before the next move.
This is often a continuation pattern, but both directions remain possible.
Moving Average
The yellow line (likely 50-period MA) is trending upward and is well below current price, confirming the bullish bias. However, the distance suggests a possible short-term pullback if the range breaks downward.
Scenarios
🔼 Bullish Breakout:
If price closes above 3790, next upside targets are 3805 (first resistance) and 3810–3812 (extended target).
🔽 Bearish Breakdown:
A break and close below 3780 could trigger a drop toward 3765 and possibly 3760–3755 near the MA support.
🎯 Trading Plan (15-Minute Setup)
Bullish Scenario (Breakout Up)
Entry: Above 3790 after a confirmed 15M candle close.
Stop Loss: Below the box, around 3778.
Take Profit:
TP1: 3805
TP2: 3810 – 3812
Bearish Scenario (Breakout Down)
Entry: Below 3780 with confirmation.
Stop Loss: Above the box, around 3793.
Take Profit:
TP1: 3765
TP2: 3755 – 3760 (near the MA).
⚖️ Risk Management & Notes
On the 15M chart, false breakouts are common — wait for a full candle close beyond the box.
Keep risk per trade around 1–2% max.
Momentum is still bullish, so the upside breakout has slightly higher probability, but always be prepared for the downside scenario.
Is the Aussie Dollar Ready to Jump?The Australian Dollar has been grinding higher since April, and some traders may think it’s ready to start jumping.
The first pattern on today’s chart is the July highs between roughly 0.658 and 0.66. AUDUSD began September by rallying above that price zone and is now trying to hold it. That may suggest old resistance has become new support.
Second, Monday’s session ended higher after probing lower. The resulting “hammer” candlestick is a potentially bullish pattern. The currency also held its rising 21-day exponential moving average (EMA).
Third, the 8-day EMA is above the 21-day EMA and MACD recently surged. Those signals may reflect increased short-term bullishness.
Finally, the 50-day simple moving average (SMA) crossed above the 200-day SMA in June. The 100-day crossed above the 200-day SMA in July. That configuration, with faster SMAs above slower SMAs, is potentially consistent with an emerging uptrend.
TradeStation has, for decades, advanced the trading industry, providing access to stocks, options and futures. If you're born to trade, we could be for you. See our Overview for more.
Past performance, whether actual or indicated by historical tests of strategies, is no guarantee of future performance or success. There is a possibility that you may sustain a loss equal to or greater than your entire investment regardless of which asset class you trade (equities, options or futures); therefore, you should not invest or risk money that you cannot afford to lose. Online trading is not suitable for all investors. View the document titled Characteristics and Risks of Standardized Options at www.TradeStation.com . Before trading any asset class, customers must read the relevant risk disclosure statements on www.TradeStation.com . System access and trade placement and execution may be delayed or fail due to market volatility and volume, quote delays, system and software errors, Internet traffic, outages and other factors.
Securities and futures trading is offered to self-directed customers by TradeStation Securities, Inc., a broker-dealer registered with the Securities and Exchange Commission and a futures commission merchant licensed with the Commodity Futures Trading Commission). TradeStation Securities is a member of the Financial Industry Regulatory Authority, the National Futures Association, and a number of exchanges.
TradeStation Securities, Inc. and TradeStation Technologies, Inc. are each wholly owned subsidiaries of TradeStation Group, Inc., both operating, and providing products and services, under the TradeStation brand and trademark. When applying for, or purchasing, accounts, subscriptions, products and services, it is important that you know which company you will be dealing with. Visit www.TradeStation.com for further important information explaining what this means.

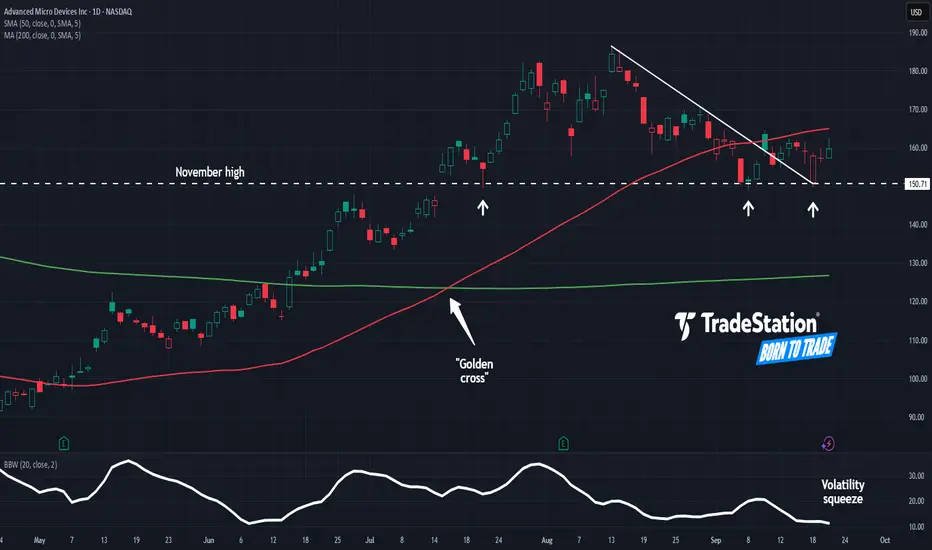
Advanced Micro Holds Previous HighAdvanced Micro Devices has sat calmly with other AI chip stocks rallying, but some traders may see upside potential.
The first pattern on today’s chart is the series of lower highs between mid-August and mid-September. AMD is now past that falling trendline, which could suggest the downtrend is fading.
Second is the November high of $150.71. AMD crossed that level in mid-July and bounced at it a week later. It’s been retested again twice this month without breaking. Has old resistance become new support?
Third, the 50-day simple moving average (SMA) has had a “golden cross” above the 200-day SMA. That may suggest its long-term trend has gotten more bullish.
Next, narrowing Bollinger Bandwidth reflects tight price action. Some traders could see potential for movement to resume after the volatility squeeze.
Finally, AMD is an active underlier in the options market. (Its average volume of 665,000 contracts ranks seventh in the S&P 500, according to TradeStation data.) That could help traders take positions with calls and puts.
TradeStation has, for decades, advanced the trading industry, providing access to stocks, options and futures. If you're born to trade, we could be for you. See our Overview for more.
Past performance, whether actual or indicated by historical tests of strategies, is no guarantee of future performance or success. There is a possibility that you may sustain a loss equal to or greater than your entire investment regardless of which asset class you trade (equities, options or futures); therefore, you should not invest or risk money that you cannot afford to lose. Online trading is not suitable for all investors. View the document titled Characteristics and Risks of Standardized Options at www.TradeStation.com . Before trading any asset class, customers must read the relevant risk disclosure statements on www.TradeStation.com . System access and trade placement and execution may be delayed or fail due to market volatility and volume, quote delays, system and software errors, Internet traffic, outages and other factors.
Securities and futures trading is offered to self-directed customers by TradeStation Securities, Inc., a broker-dealer registered with the Securities and Exchange Commission and a futures commission merchant licensed with the Commodity Futures Trading Commission). TradeStation Securities is a member of the Financial Industry Regulatory Authority, the National Futures Association, and a number of exchanges.
Options trading is not suitable for all investors. Your TradeStation Securities’ account application to trade options will be considered and approved or disapproved based on all relevant factors, including your trading experience. See www.TradeStation.com . Visit www.TradeStation.com for full details on the costs and fees associated with options.
Margin trading involves risks, and it is important that you fully understand those risks before trading on margin. The Margin Disclosure Statement outlines many of those risks, including that you can lose more funds than you deposit in your margin account; your brokerage firm can force the sale of securities in your account; your brokerage firm can sell your securities without contacting you; and you are not entitled to an extension of time on a margin call. Review the Margin Disclosure Statement at www.TradeStation.com .
TradeStation Securities, Inc. and TradeStation Technologies, Inc. are each wholly owned subsidiaries of TradeStation Group, Inc., both operating, and providing products and services, under the TradeStation brand and trademark. When applying for, or purchasing, accounts, subscriptions, products and services, it is important that you know which company you will be dealing with. Visit www.TradeStation.com for further important information explaining what this means.
NVIDIA’s Decisive Battle at the $185 Resistance🔹 Short-Term Outlook (1–3 Weeks)
Current Situation:
NVIDIA (NVDA) is trading around $183.6, right below the critical $185 resistance—a level that has repeatedly capped the stock’s rallies.
Momentum & Pattern:
The price has reclaimed the 50-day moving average ($175.9) with a strong bullish candle, signaling renewed buying interest.
Bullish Scenario:
If NVDA breaks and holds above $185:
🎯 Target 1: $195
🎯 Target 2: $205
Bearish Scenario:
If the stock fails to break $185 and closes below $175:
❌ Short-Term Stop Loss: below $175
🎯 Downside Target: $165
🔹 Long-Term Outlook (2–6 Months)
Overall Trend:
The medium-term trend remains bullish, and a decisive breakout above $185 could ignite a new rally.
Bullish Scenario:
🎯 Medium-Term Target: $220
🎯 Long-Term Target: $250
Bearish Scenario:
If the stock loses the $160 support:
❌ Long-Term Stop Loss: below $160
🎯 Downside Target: $140
✅ Summary:
NVDA stands at a pivotal level. A breakout above $185 could open the door to $200 and higher, while rejection at this level risks a pullback toward $165.

$BTC Battle of the Bulls and Bears is ON! Pretty wild day in the crypto market.
CRYPTOCAP:BTC Bears closed below the 100MA, but thankfully right above the .236 Fib and avoided the DANGER ZONE ⚠️
Bulls need a big next couple of days.
Can't hang out here for too long.
RSI is looking healthy after this reset tho.
How you feeling?
Bullish or Bearish?

ABBV at a Breakout Point: Golden Opportunity or Bull Trap?🔎 Short-Term Outlook (weeks to a few months)
Current Situation:
The stock is testing the strong resistance zone at $222–225, which has acted as a ceiling multiple times in the past.
Bullish Scenario:
A confirmed breakout and consolidation above $225 would validate bullish momentum.
🎯 Target 1: $235
🎯 Target 2: $245
Bearish Scenario:
Failure to hold above resistance could trigger a pullback.
🛑 Stop-loss: sustained move below $215
🎯 Downside target: $202 (near the 50-day moving average)
🔎 Long-Term Outlook (6–12 months)
Overall Trend:
Since the 2025 spring lows, ABBV has been in an uptrend. A breakout above $225 could mark the beginning of a larger bullish wave.
Bullish Scenario:
🎯 Target 1: $250 (previous all-time high)
🎯 Target 2: $270 (next Fibonacci extension & psychological level)
Bearish Scenario:
If ABBV falls and sustains below $200, the bullish structure would be invalidated.
🛑 Long-term stop-loss: sustained move below $195
✅ Summary:
Short-term direction depends heavily on the $225 breakout/rejection zone. In the long run, a successful breakout could open the path toward $250–270.

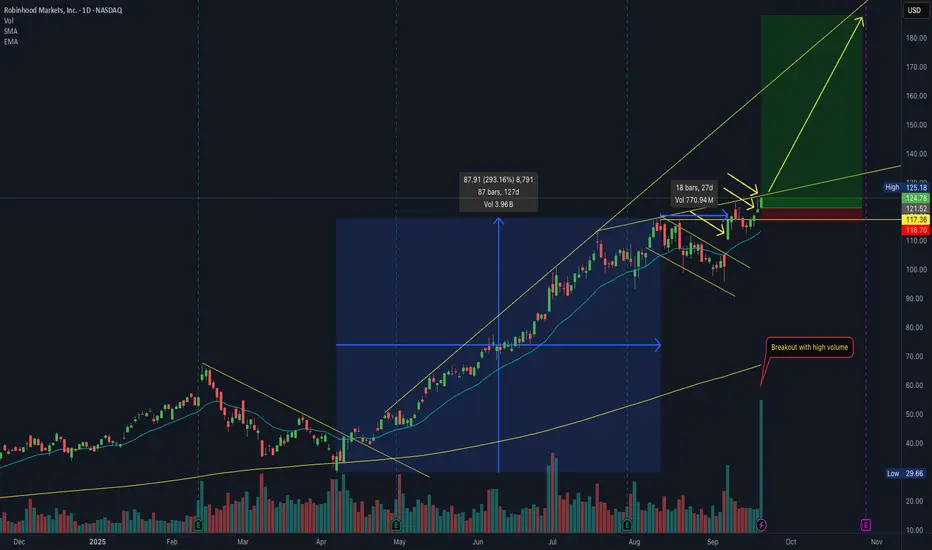
Potential Buy Setup – $HOOD Breakout on High VolumeKey points:
• Growth of 293% in the previous 4 months
• Consolidation phase of nearly 1 month after the growth, with low volume and respecting the EMA21
• Beginning of a flag breakout with average volume surging more than 50%
• Continuation breakout above the previous high with another volume surge
-------------
Dear friends,
I trade the markets using a structured, multi-stage strategy that combines technical analysis, price action, and market psychology. My approach includes key concepts such as candlestick patterns, trendlines, support & resistance, Elliott Wave theory, and price channels. I also integrate strategies from O’Neil’s CANSLIM, Minervini’s SEPA, Oliver Kell’s momentum trading, and Qullamaggie’s breakout setups.
Good luck!
War is a Racket | DFEN | Long at $28.00The war machine keeps turning. Profits will reign. Direxion Aerospace and Defense 3x AMEX:DFEN never fully recovered from pandemic lows, but world peace is (unfortunately) far from reach. The uptrend in the chart has commenced. Personal entry point at $28.00.
Target #1 = $37.00
Target #2 = $50.00
Target #3 = $64.00

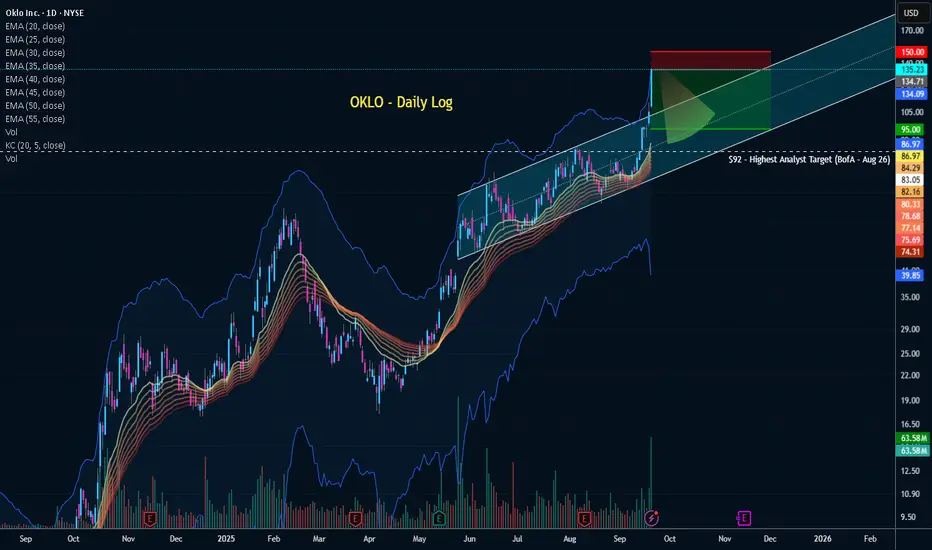
OKLO Mania - Time to fade?Why the recent parabolic move?... Friday US-UK nuclear energy deal called the Atlantic Partnership for Advanced Nuclear Energy. The deal is meant to speed up the use of next-generation nuclear technologies like OKLO.
I have nothing bad to say about the company. I recommended buying it earlier this year in March when it was trading in the $20-$30 range (see related publication).
These types of parabolic moves without meaningful fundamental improvement are not super rare, but the pendulum has swung pretty hard here and I think in the next 2 weeks we'll be at a lower price, perhaps still above $100. I don't think it will be necessary short selling but perhaps pull back from either another offering, insider trading, or locking in some profit at these levels.
Insider selling news:
www.barrons.com
AUDNZD: Strong Resistance Level + MomentumBias: Short
Type: Reversal
Trend: Range
Area of Value: Min-Max Support and Resistance Level
Momentum: 1D MACD Histogram about to cross the Low Tide
Entry : 1.11190
Exit: Stop Loss @ 1.12150; Take Profit @ 1.09252 or @ 1.06390
Analysis:
Fact 1: AUDNZD has been in a range since 2014, with resistance level @ 1.12940.
Fact 2: AUDNZD in the recent price movements based on 1D has only been reaching the max resistance @ 1.11500 before moving back down to @ 1.06400 support level.
Fact 3: AUDNZD has reached the recent max resistance level @ 1.11500, paired with 1D MACD Histogram about to cross to the Low Tide.
Conclusion:
Since AUDNZD is in a Range, has reached its recent maximum resistance levels confluence by Yearly Highs, Yearly Opens, and Quarter Opens, with a momentum pairing from 1D MACD of crossing the Low Tide. I believe that AUDNZD will have a price reversal and move its price to any of the our two take profits.

Technical Outlook: HPL Near Crucial ₹460–₹520zoneOverall trend:
Short-term trend: Sideways consolidation between ₹460 – ₹520.
Stock needs to break above ₹520 with volume for any strong bullish move.
Swing Buy Entry: Near ₹465 – ₹475 (support zone), if RSI holds above 40.
Target 1: ₹505 – ₹520 (resistance).
Target 2: ₹560 – ₹580 (if breakout above ₹520 happens).
Stop Loss: Below ₹450 (recent swing low).
Swing Sell Entry: If price fails near ₹505 – ₹520 again with weak RSI.
Target 1: ₹470 – ₹460 (support retest).
Stop Loss: Above ₹530.
Disclaimer:
I am NOT a SEBI registered advisor nor a financial advisor.
Any investments or trades I discuss on my blog are intended solely for educational purposes and do not represent specific financial, trading, or investment advice.
Disclosure:
I, the author of this report, and my immediate family members do not have any financial interest or beneficial ownership in the securities mentioned herein at the time of publication.

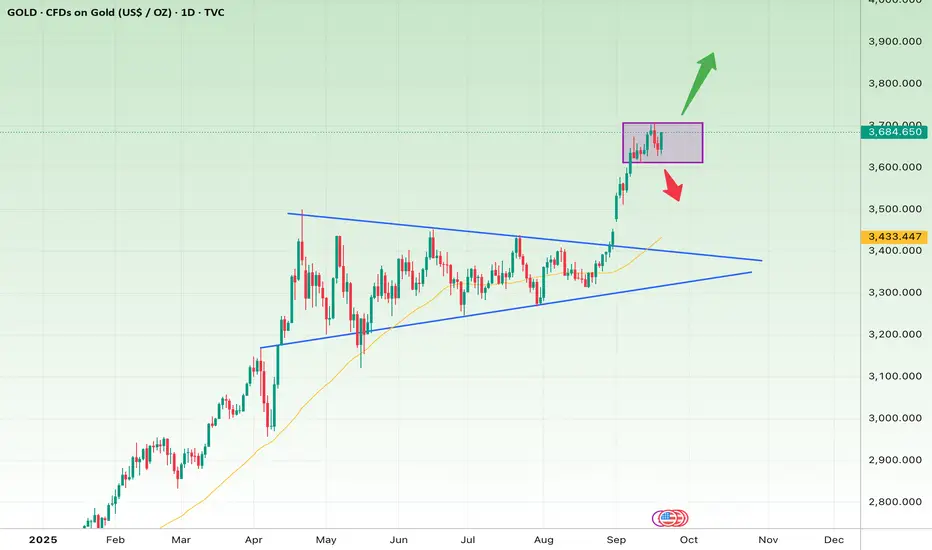
Gold on the Edge of a Breakout or a Sharp Pullback?🔎 Technical Analysis
Main Trend:
Since early 2025, gold has been in a strong uptrend. The breakout from the symmetrical triangle in September was decisive, with strong momentum, pushing the price quickly above $3,600.
Current Situation:
Price is now consolidating in a range box ($3,630–$3,700). This is a healthy pause after the sharp rally, serving as an accumulation zone before the next major move.
Indicators & Signals:
The 50-day MA (yellow) is acting as dynamic support.
Bullish candles are larger and more frequent than bearish ones → buyers remain in control.
However, a short-term pullback to retest lower supports is still possible.
📈 Short-Term Outlook (1–3 weeks)
Bullish Scenario (more likely):
A breakout above $3,700 could fuel another rally toward $3,780 – $3,850.
Stop-loss: Close below $3,620.
Bearish Scenario (less likely):
A breakdown below $3,620 could trigger a correction down to $3,480 – $3,430 (confluence with the 50-day MA and the broken triangle top).
Stop-loss for shorts: Above $3,700.
📊 Long-Term Outlook (2–4 months)
The overall structure remains bullish, with the triangle breakout still in play.
As long as price holds above $3,430, the long-term uptrend is intact.
Key targets:
First target: $3,900 (psychological level)
Second target: $4,200 (technical projection from the triangle pattern)
Long-term stop-loss: A sustained close below $3,300 would invalidate the bullish outlook.
✅ Summary:
Short-term: The key level is $3,700. A breakout above confirms continuation, while a drop below $3,620 signals a correction.
Long-term: Trend is bullish as long as price stays above $3,430, with $4,200 as a realistic upside target.
The #1 Trading Mindset Shown On This ChartMan this is crazy there is this girl
that am digging.It was crazy i just
spoke my mind
bro she kept laughing..i honestly
dont think am very funny.
But she kept laughing
at my talk.
She insisted i see her tomorrow again.
Now am doubting if am ready to be
in a relationship with her.
Anyway we will see how this goes.
I will update on the story. Tomorrow,
after i see her tomorrow.
Meanwhile there is this other girl that
i really love but she doesn't see me man.
Its like i don't have a body
Bro she ignores me like
no mans business
i cant even get her attention.
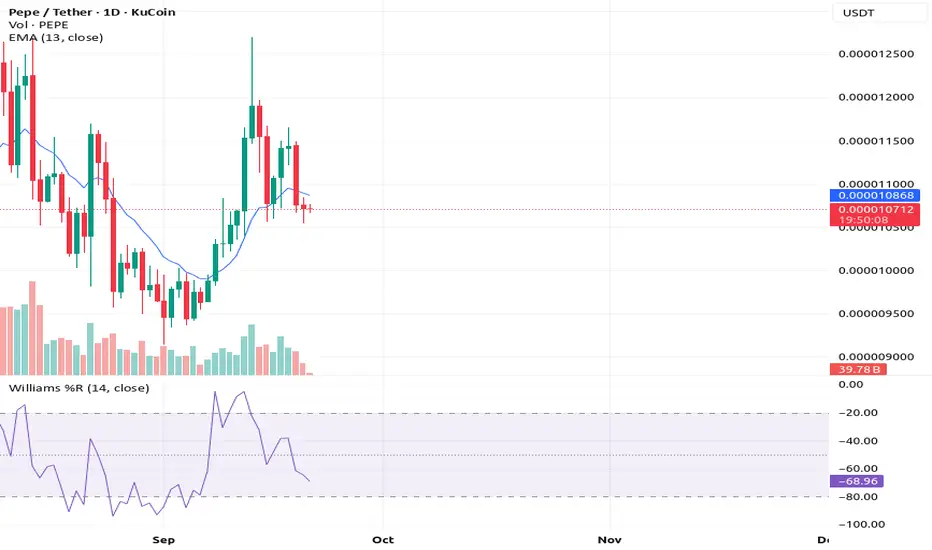
Look at this chart KUCOIN:PEPEUSDT
what you see is a doji .
Thats fear my friend.
This is when you have to enter
During fear.
The price action looks like a double
bottom meanwhile
on the momentum chart below
you can see a new low..
Have you seen the new low
on the william %R ?
This is very important for you
to understand because
this is called the new high new low
chart pattern .
Its pure trading psychology at
its best and am sharing it with you.
Rocket boost this content to learn more.
Disclaimer: Trading is risky please risk management
and profit taking strategies.Also feel free
to use a simulation trading account before you
trade with real money.
BNB at the $1,000 Psychological Barrier: Breakout or Pullback?
🔎 Technical Outlook
📍 Current Situation
BNB has rallied strongly and reached the critical $1,000 psychological level.
Price is currently trading near the top of the ascending channel (blue).
The 50-day moving average around $860 is acting as a key support zone.
🎯 Short-Term Strategy
Entry (confirmation): Daily close above $1,020
Target 1: $1,075
Target 2: $1,150
Stop-loss: Breakdown below $960
⚠️ If the breakout fails, support lies at $900 and then $860.
🎯 Long-Term Strategy
Entry (confirmation): Strong breakout above $1,150
Mid-term Target: $1,250
Long-term Target: $1,350–$1,400
Stop-loss: Losing $860 support (50-day MA & mid-channel support).
📌 Summary
Short-term: $1,000 is the battleground. Breakout = bullish continuation, rejection = correction.
Long-term: A confirmed breakout above $1,150 could open the way to new highs.

The Power Of Risk Management - "i want 100% profit!!"Am angry let me tell you the reason.
I was up about 50% profit on this trade...
guess what? i didnt take profit...
I feel so stupid and helpless
because am following my risk management
to the T..meaning i have to cross
my t when writing.
Dont fear volatility.
The entry was at a higher low .
Now it has dropped to a new low .
What makes this the perfect re-entry?
its because people, buyers and sellers, are fearful.
The buyers and sellers are fearful right now.
Imagine 3 days of profit Poof!!! gone!!
And here you are holding the bag on this trade.
Meanwhile the short term investors have taken
their share of profit
Am sticking to risk managment buddy.
i want 100% profit!!
Look at this chart KUCOIN:PEPEUSDT
you will see two things:
1-The bullish harami
2-The doji
The bullish harami shows you reversal entry.
The doji shows you fear.
Dont let fear stop you.
Also look at the william %R have you seen the New low?
Rocket boost this content to learn more.
Disclaimer: Trading is risky.Please learn risk management
and profit taking strategies.
Also feel free to use a simulation trading account
Before you trade with real money.
Full Disclosure: I am a marketing expert

$PUMP Battle Between Buyers and SellersWill be an interesting next couple of days to watch for NYSE:PUMP
Appeared to be forming a bull pennant but that failed and lost the 9EMA.
Now is the battle between buyers and sellers at previous ATH.
Must hold this level otherwise it will print 3 Black Crowes and retest ~.006

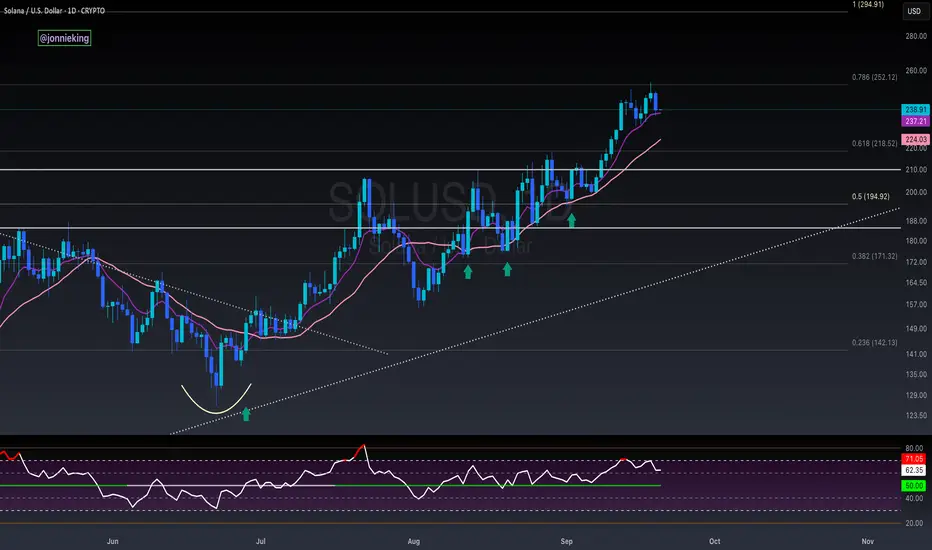
$SOL Maintains Uptrend With Daily CloseIgnore the noise.
CRYPTOCAP:SOL is still very much in an uptrend and has closed the day above the 9EMA.
Bulls need to maintain this, otherwise a retest of the 20MA ~$224 will be retested.
Microsoft’s Battle with the $520 Resistance!🔎 Technical Outlook
📍 Current Situation
The stock is testing the critical $515–$520 resistance zone (purple line).
The 50-day moving average (yellow) sits around $511, acting as near-term support.
Multiple rejections around $520 highlight how important this level is.
🎯 Short-Term Strategy (Swing / Daily)
Entry: Daily close above $522
Target 1: $535
Target 2: $548–$550
Stop-loss: Daily close below $511 (50-day MA and recent support)
⚠️ If the price fails to hold above $520 and breaks below $511, a pullback toward $490 is likely.
🎯 Long-Term Strategy (Position / Weekly)
Safe Entry: Break and hold above $530
Mid-term Target: $565
Long-term Target: $580–$600 (potential new all-time high)
Stop-loss: A breakdown below $484 (major support and previous swing low)
📌 Summary
Short-term: The $520 zone is the battlefield. Breakout = bullish momentum, rejection = correction.
Long-term: A confirmed breakout above $530 clears the path toward new highs.

The 13 EMA System On Re- Entry (Swing Trading)So am sitting on my computer desk.
Trying to register my publishing business..
then it hit me man.
Its more affordable to start a business
than to get a driving license.
So which one would you do?
Would you start a business or get a driving
license?
Starting a business is something
i wish i did in my younger days.
Those days i had so much imagination
and no guidance on how to monetise
my ideas.
Starting this publishing business
is something am so proud of myself by.
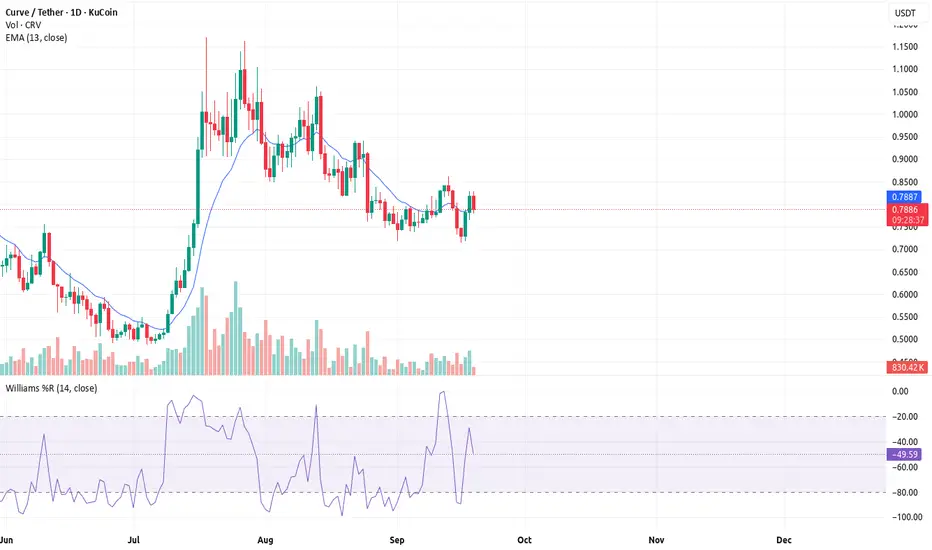
Now look at this chart KUCOIN:CRVUSDT
you will see something called a failure swing.
What is a failure swing?
This is the break even point or the re entry signal.
Dont get sacred of this
its a sign that the next bullish move in KUCOIN:CRVUSDT
is going to be huge!!
Am using the William %R to see this swing
because its my favourite indicator..
Which indicator do you use to see the failure swing?
Do you think this is where the name
swing trading comes from?
If you remember on the last idea
i told you i saw a dragonfly doji as an entry
This failure swing signal is the icing on the cake.
Trade safe.
Rocket boost this content to learn more
Disclaimer:Trading is risky please learn risk managment
and profit taking strategies.Also feel free to use
a simulation trading account before you trade with real money.
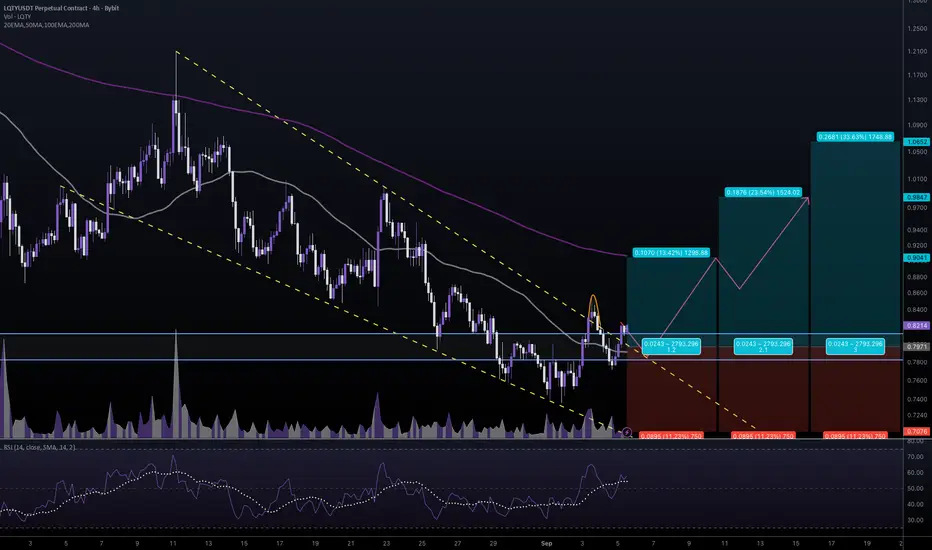
#LQTYUSDT #4h (Bitget Futures) Faling wedge breakout and retestLiquity just regained 50MA support after a first deviation, seems likely to resume bullish towards 200MA resistance and more.
⚡️⚡️ #LQTY/USDT ⚡️⚡️
Exchanges: Bitget Futures
Signal Type: Regular (Long)
Leverage: Isolated (4.0X)
Amount: 4.5%
Current Price:
0.8214
Entry Zone:
0.8116 - 0.7826
Take-Profit Targets:
1) 0.9041
2) 0.9847
3) 1.0652
Stop Targets:
1) 0.7076
Published By: @Zblaba
$LQTY BITGET:LQTYUSDT.P #4h #Liquity #DeFi liquity.org
Risk/Reward= 1:1.2 | 1:2.1 | 1:3.0
Expected Profit= +53.7% | +94.1% | +134.5%
Possible Loss= -44.9%
Estimated Gaintime= 1-2 weeks