USD/JPYThis is a trade setup for USD/JPY, based on volume and trend analysis.
Entry Price: 150.360
Stop-Loss (SL): 150.740
Take-Profit (TP): 149.963
The trade is intended to be executed instantly at the mentioned price, in alignment with both volume behavior and the current trend direction.
Disclaimer: This setup is shared purely for backtesting purposes and to document trade ideas. It is not financial advice. Always perform your own analysis before making any trading decisions.
Moving Averages

USD/CADThis is a trade setup for USD/CAD, based on volume and trend analysis.
Entry Price: 1.38614
Stop-Loss (SL): 1.38514
Take-Profit (TP): 1.38864
The trade is intended to be executed instantly at the mentioned price, in alignment with both volume behavior and the current trend direction.
Disclaimer: This setup is shared purely for backtesting purposes and to document trade ideas. It is not financial advice. Always perform your own analysis before making any trading decisions.

NZD/USDThis is a trade setup for NZD/USD, based on volume and trend analysis.
Entry Price: 0.58742
Stop-Loss (SL): 0.58892
Take-Profit (TP): 0.58582
The trade is intended to be executed instantly at the mentioned price, in alignment with both volume behavior and the current trend direction.
Disclaimer: This setup is shared purely for backtesting purposes and to document trade ideas. It is not financial advice. Always perform your own analysis before making any trading decisions.

AUD/USDThis is a trade setup for AUD/USD, based on volume and trend analysis.
Entry Price: 0.64230
Stop-Loss (SL): 0.64350
Take-Profit (TP): 0.64100
The trade is intended to be executed instantly at the mentioned price, in alignment with both volume behavior and the current trend direction.
Disclaimer: This setup is shared purely for backtesting purposes and to document trade ideas. It is not financial advice. Always perform your own analysis before making any trading decisions.

Corning Inc. Quote | Chart & Forecast SummaryKey Indicators On Trade Set Up In General
1. Push Set Up
2. Range Set Up
3. Break & Retest Set Up
Notes On Session
# Corning Inc. Quote
- Double Formation
* (EMA Settings)) - *100 EMA Edit | Subdivision 1
* (Uptrend Argument)) | Completed Survey
- 172 bars, 240d | Date Range
- Triple Formation
* (P1)) / (P2)) & (P3)) | Subdivision 2
* Daily Time Frame | Trend Settings Condition | Subdivision 3
- (Hypothesis On Entry Bias)) | Regular Settings
* Stop Loss Feature Varies Regarding To Main Entry And Can Occur Unevenly
- Position On A 1.5RR
* Stop Loss At 58.00 USD
* Entry At 63.00 USD
* Take Profit At 71.00 USD
* (Uptrend Argument)) & No Pattern Confirmation
- Continuation Pattern | Not Valid
- Reversal Pattern | Not Valid
* Ongoing Entry & (Neutral Area))
Active Sessions On Relevant Range & Elemented Probabilities;
European-Session(Upwards) - East Coast-Session(Downwards) - Asian-Session(Ranging)
Conclusion | Trade Plan Execution & Risk Management On Demand;
Overall Consensus | Buy

USD/CHF
This is a trade setup for USD/CHF, based on volume and trend analysis.
Entry Price: 0.81473
Stop-Loss (SL): 0.81293
Take-Profit (TP): 0.81673
The trade is intended to be executed instantly at the mentioned price, following confirmation from both volume behavior and the current trend direction.
Disclaimer: This setup is shared purely for backtesting purposes and to document trade ideas. It is not financial advice. Always perform your own analysis before making any trading decisions.

GBP/USDHello traders!
This is a trade setup for GBP/USD, based on volume and trend analysis.
Entry Price: 1.31947
Stop-Loss (SL): 1.32077
Take-Profit (TP): 1.31707
The trade is intended to be executed instantly at the mentioned price, in alignment with both volume behavior and the current trend direction.
Disclaimer: This setup is shared purely for backtesting purposes and to document trade ideas. It is not financial advice. Always perform your own analysis before making any trading decisions.

Charter Communications (Revised) | CHTR | Long at $269.50 **This is a revised analysis from December 26, 2024: . My stop was triggered in that original trade after the recent price drop (some gains were taken at 13%, as noted).**
Charter Communications NASDAQ:CHTR stock recently dropped due to a disappointing Q2 2025 earnings report, with earnings per share of $9.18 missing estimates of $9.58 and a larger-than-expected loss of 111,000 residential internet customers. Despite the recent subscriber losses and increased competition, the following factors suggest long-term growth potential:
Network Expansion: Launch of 2x1 Gbps service in eight markets in 2025, boosting competitiveness.
Rural Growth: Rural revenue projected to reach 10–15% of total revenue by 2025.
Cox Acquisition: $34.5B merger expected to close by mid-2026, yielding $500M in annual cost savings by 2028 and enhancing market share.
Mobile and AI Strategies: Strong mobile growth and AI-driven customer service tools to improve retention and efficiency.
Lower Interest Rates: Reduced bowering costs to help with profit margins.
Charter's President/CEO recently grabbed $2.5 million in shares under $300. From a technical analysis perspective, there is an open price gap near $195 that could be of concern in the near-term. I foresee that being closed if the whole market flips or more bad news for the company arises. But, with a P/E of 7x and the industry average being near 13x, I believe NASDAQ:CHTR is a good value at the moment.
Thus, at $269.50, NASDAQ:CHTR is in a personal buy zone with a note of "risk" of a drop near $195 (a second personal entry point if it hits that level before targets are reached).
Targets into 2028:
$330.00 (+22.4%)
$375.00 (+39.1%)

LKQ Corporation Quote | Chart & Forecast SummaryKey Indicators On Trade Set Up In General
1. Push Set Up
2. Range Set Up
3. Break & Retest Set Up
Notes On Session
# LKQ Corporation Quote
- Double Formation
* (Downtrend Argument)) At 45.00 USD | Subdivision 1
* (Diagonal Shift)) | Completed Survey
- Lower Band & Upper Band
- Triple Formation
* (P1)) / (P2)) & (P3)) | Subdivision 2
* Daily Time Frame | Trend Settings Condition | Subdivision 3
- (Hypothesis On Entry Bias)) | Regular Settings
* Stop Loss Feature Varies Regarding To Main Entry And Can Occur Unevenly
- Position On A 1.5RR
* Stop Loss At 32.00 USD
* Entry At 30.00 USD
* Take Profit At 24.00 USD
* (Downtrend Argument)) & No Pattern Confirmation
- Continuation Pattern | Not Valid
- Reversal Pattern | Not Valid
* Ongoing Entry & (Neutral Area))
Active Sessions On Relevant Range & Elemented Probabilities;
European-Session(Upwards) - East Coast-Session(Downwards) - Asian-Session(Ranging)
Conclusion | Trade Plan Execution & Risk Management On Demand;
Overall Consensus | Sell

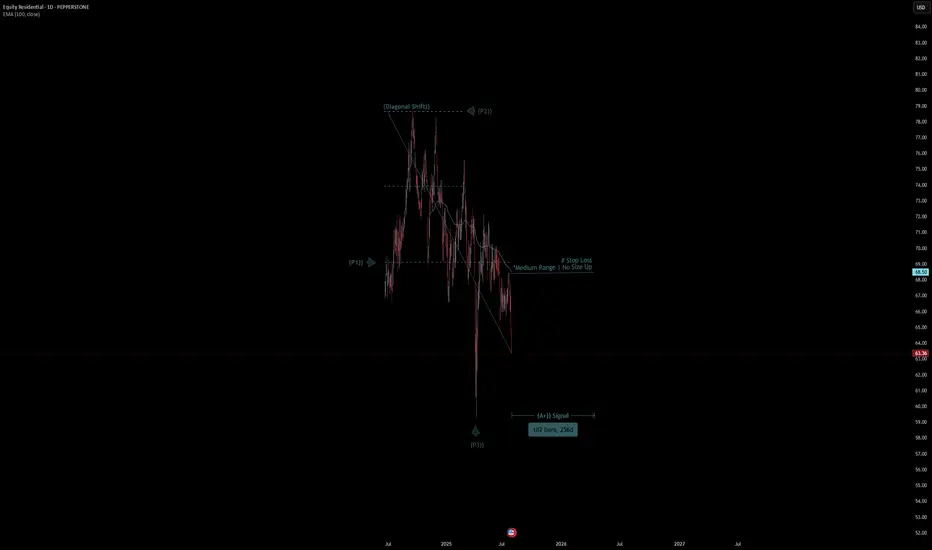
Equity Residential Quote | Chart & Forecast SummaryKey Indicators On Trade Set Up In General
1. Push Set Up
2. Range Set Up
3. Break & Retest Set Up
Notes On Session
# Equity Residential Quote
- Double Formation
* Stop Loss - *Medium Range | No Size Up | Subdivision 1
* 182 bars, 256d | Date Range Method | Completed Survey
- Triple Formation
* (P1)) / (P2)) & (P3)) | Subdivision 2
* Daily Time Frame | Trend Settings Condition | Subdivision 3
- (Hypothesis On Entry Bias)) | Regular Settings
* Stop Loss Feature Varies Regarding To Main Entry And Can Occur Unevenly
- Position On A 1.5RR
* Stop Loss At 68.00 USD
* Entry At 63.00 USD
* Take Profit At 56.00 USD
* (Downtrend Argument)) & No Pattern Confirmation
- Continuation Pattern | Not Valid
- Reversal Pattern | Not Valid
* Ongoing Entry & (Neutral Area))
Active Sessions On Relevant Range & Elemented Probabilities;
European-Session(Upwards) - East Coast-Session(Downwards) - Asian-Session(Ranging)
Conclusion | Trade Plan Execution & Risk Management On Demand;
Overall Consensus | Sell
Ethereum Rally (?) : Strong Infusion with Volume RequiredEthereum can make a very strong rally of at least 35-40 percent.
And so the same goes for the Ishares Ethereum Trust ETF. (ETHA ETF)
But it needs to break the pennant.
And we need to observe strong volume.
Also, if we stay above the 50 and 200 period moving averages while this is happening, good things can happen.
Still, I am neutral until we break the pennant.

META : Old Peak can be TestedMeta platform has lost altitude from the channel it has formed since 2023, but has gained momentum and re-entered the channel. The possibility of testing the old peak contains a good RR rate.Of course, with a stop-loss close to the 200-period moving average.( Risk/Reward Ratio : 2.48)
Stop-Loss: 605.47
Target : 740.10

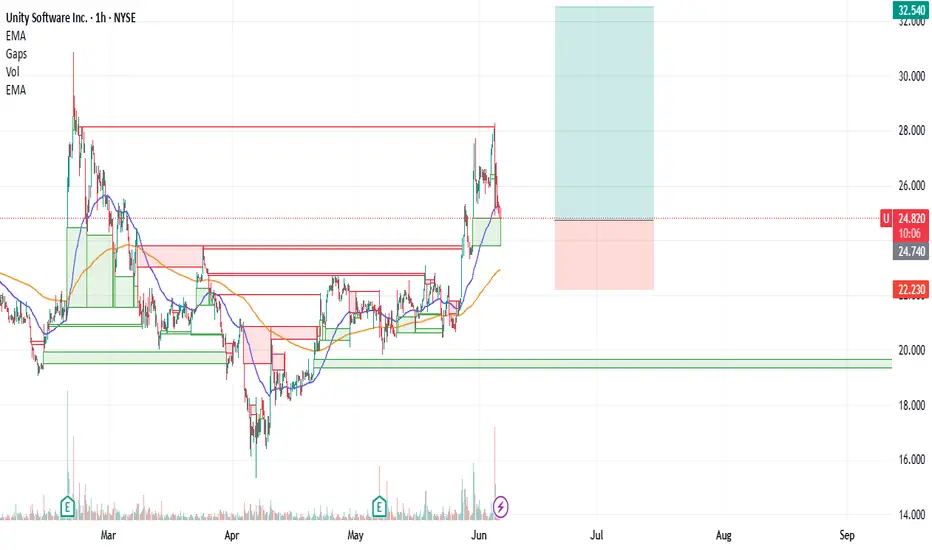
U : Long There were both good and bad developments for Unity.
While the joint project opportunity with BMW Group is very positive news,
Departure of the current CEO was negative news.
Technically, it is above the 50 and 200 period moving averages, and the 50 period ema is also above the 200 period ema.
A risk/reward ratio of 3.00 can be evaluated, with the Stop-Loss being close to the 200-period ema and the target price being targeted at the large gap closing value.(Small position size)
Entry : 24.76 - 24.81
Risk/Reward Ratio : 3.00
Stop-Loss : 22.23
Take Profit Level: 32.54
VRT : Long Position Vertiv Holdings is trading above the 50 and 200-period moving averages.
It has overcome the resistances one by one without being exposed to a very high IV.
It has started to draw a cup.
However, it is much better to focus on the big gap rather than the cup formation because with good chances it can encounter a big resistance there.
Targeting the 50-period ema and the 0.5 level of the short-term Fibonacci retracement levels as a stop point gives us the opportunity to try trading at a not bad risk/reward ratio.
With a small position size or small portfolio percent :
Risk/Reward Ratio : 2.54
Stop-Loss : 103.77
Take-Profit : 145.32

BX : First Attempt at Silent StockBlackstone has now decided to invest in Europe.
The stock is technically above the 50 and 200 period moving averages.
After leveling the trend line, an increase in volume was also observed.
In that case, holding a short-medium term or opening a long position with a reasonable risk/reward ratio in a small position size will not hurt us.
I have kept the stop-loss a little tighter now because even if the stop level comes in a sudden drop, it can be tried again. If that happens, I will share it as a new idea.
Risk/Reward Ratio : 3.00
Stop-Loss : 132.53
Take-Profit : 141.73

UNH : Are Bad Days Over ? (Cautious)UNH shares have moved above the 50-period moving average but are trading below the 200-period moving average.
For now, since the 200-period moving average is very high, a small trade can be tried by keeping the stop-loss level a little tight.
A few weak movements may pull the average down and the price may break the average.
Therefore, small position sizes are ideal.
NOTE : If we can maintain persistence on 376(Which will take a few days),
then we will look at the other gaps.
Risk/Reward Ratio : 2.39
Stop-Loss : 274.99
Take- Profit Level : 376.38
Regards.

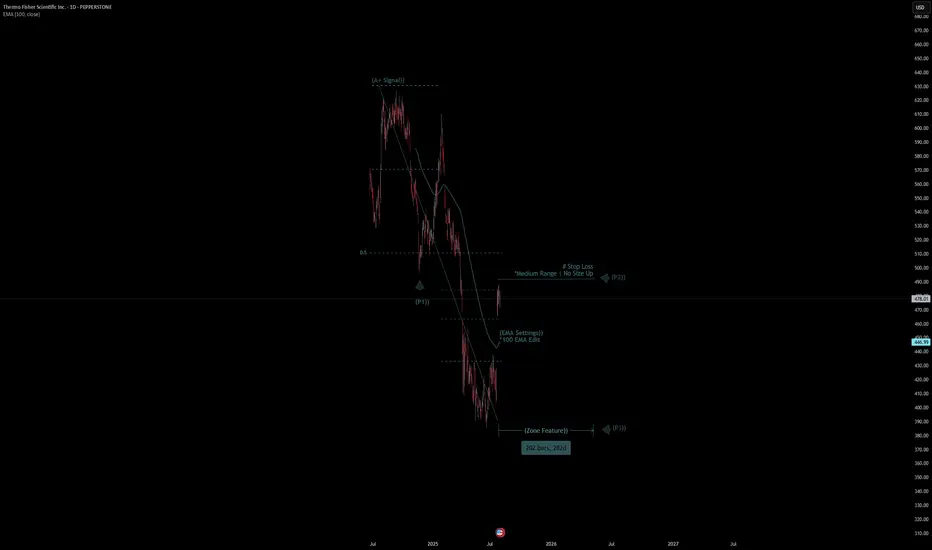
Thermo Fisher Scientific Inc. Quote | Chart & Forecast SummaryKey Indicators On Trade Set Up In General
1. Push Set Up
2. Range Set Up
3. Break & Retest Set Up
Notes On Session
# Thermo Fisher Scientific Inc. Quote
- Double Formation
* Thermo Fisher Scientific Inc. Quote | Completed Survey
* Stop Loss - *Medium Range | No Size Up | Subdivision 1
- 202 bars, 282d | Date Range Method
- Triple Formation
* (P1)) / (P2)) & (P3)) | Subdivision 2
* Daily Time Frame | Trend Settings Condition | Subdivision 3
- (Hypothesis On Entry Bias)) | Regular Settings
* Stop Loss Feature Varies Regarding To Main Entry
- Position On A 1.5RR
* Stop Loss At 514.00 USD
* Entry At 478.00 USD
* Take Profit At 421.00 USD
* (Downtrend Argument)) & No Pattern Confirmation
- Continuation Pattern | Not Valid
- Reversal Pattern | Not Valid
* Ongoing Entry & (Neutral Area))
Active Sessions On Relevant Range & Elemented Probabilities;
European-Session(Upwards) - East Coast-Session(Downwards) - Asian-Session(Ranging)
Conclusion | Trade Plan Execution & Risk Management On Demand;
Overall Consensus | Sell
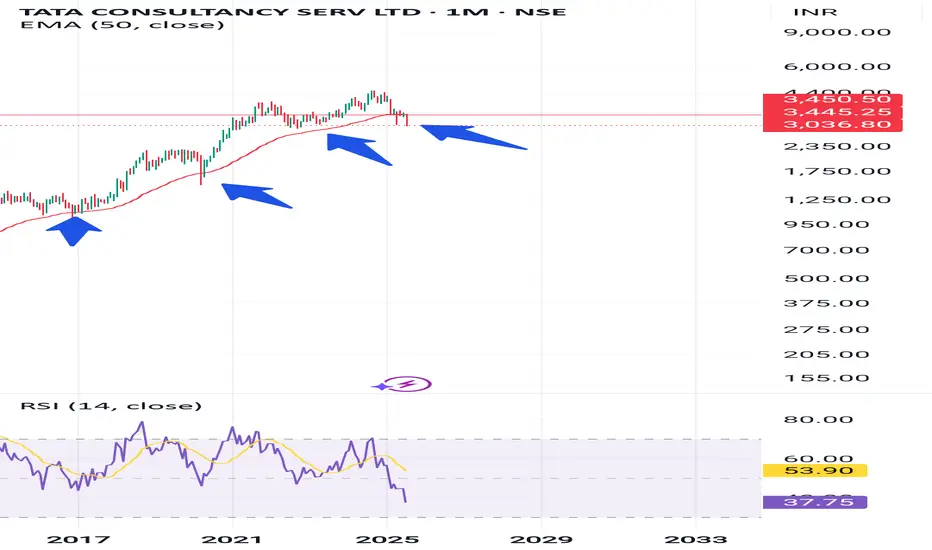
Hunting Stop loss , near moving avg historical Support Tcs is falling due to bad quarterly results now at historical support of 50 ema , each candle is monthly candle
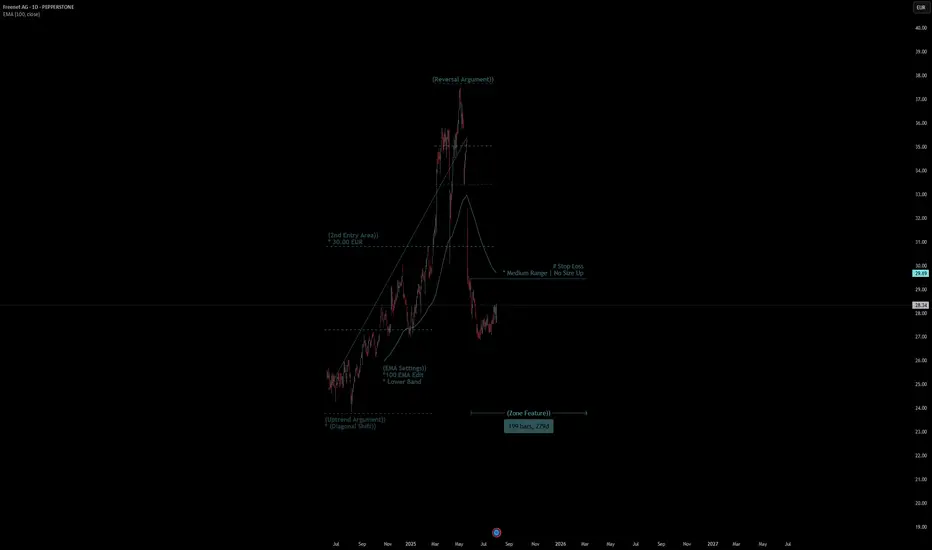
Freenet AG Quote | Chart & Forecast SummaryKey Indicators On Trade Set Up In General
1. Push Set Up
2. Range Set Up
3. Break & Retest Set Up
Notes On Session
# Freenet AG Quote
- Double Formation
* (Uptrend Argument)) - *(Diagonal Shift)) | Completed Survey
* Stop Loss - *Medium Range | No Size Up | Subdivision 1
- 199 bars, 279d | Date Range Method
- Triple Formation
* (P1)) / (P2)) & (P3)) | Subdivision 2
* Daily Time Frame | Trend Settings Condition | Subdivision 3
- (Hypothesis On Entry Bias)) | Regular Settings
- Position On A 1.5RR
* Stop Loss At 30.00 EUR
* Entry At 28.00 EUR
* Take Profit At 24.00 EUR
* (Downtrend Argument)) & No Pattern Confirmation
- Continuation Pattern | Not Valid
- Reversal Pattern | Not Valid
* Ongoing Entry & (Neutral Area))
Active Sessions On Relevant Range & Elemented Probabilities;
European-Session(Upwards) - East Coast-Session(Downwards) - Asian-Session(Ranging)
Conclusion | Trade Plan Execution & Risk Management On Demand;
Overall Consensus | Sell
$BTCUSD, rally into rate cuts?BITSTAMP:BTCUSD has been coiling for some time now in a right angled descending broadening wedge.
A measured move of this cone so far would place BTC at right around ~$100k.
This aligns well with historical performance of BTC heading into a cutting cycle. If we rally into September and have a selloff following the cuts (sell the news), I wouldn't be shocked. This is a pattern that has happened in multiple years of the previous QE/QT Cycle (2016/2017, 2019/2020).
The real fireworks will be in 2025 if things go according to the FED's schedule

MA Mastercard Incorporated Options Ahead of EarningsIf you haven`t bought MA before the rally:
Now analyzing the options chain and the chart patterns of MA Mastercard Incorporated prior to the earnings report this week,
I would consider purchasing the 545usd strike price Puts with
an expiration date of 2025-8-8,
for a premium of approximately $4.45.
If these options prove to be profitable prior to the earnings release, I would sell at least half of them.
Disclosure: I am part of Trade Nation's Influencer program and receive a monthly fee for using their TradingView charts in my analysis.

Intel: Still Not Cheap Enough?Intel has been falling for years, but some traders may think it’s still not cheap enough.
The first pattern on today’s chart is the series of higher lows since April, combined with lower highs since February. That converging range is a potential consolidation pattern.
Second, the chipmaker broke that range by gapping lower on Friday following a weak quarterly report.
Third, traders may eye $17.67 as the next important level. That April low was also the lowest price since August 2010.
Fourth, the 50-day simple moving average (SMA) inched toward the 200-day SMA this month but failed to cross above it. Is a longer-term bearish trend in effect?
Next, the 8-day exponential moving average (EMA) is below the 21-day EMA and MACD is falling. Both of those signals may be consistent with bearishness in the short term.
Finally, INTC is an active underlier in the options market. (Its average daily volume of about 350,000 contacts ranks 10th the S&P 500, according to TradeStation Data.) That could help traders take positions with calls and puts.
TradeStation has, for decades, advanced the trading industry, providing access to stocks, options and futures. If you're born to trade, we could be for you. See our Overview for more.
Past performance, whether actual or indicated by historical tests of strategies, is no guarantee of future performance or success. There is a possibility that you may sustain a loss equal to or greater than your entire investment regardless of which asset class you trade (equities, options or futures); therefore, you should not invest or risk money that you cannot afford to lose. Online trading is not suitable for all investors. View the document titled Characteristics and Risks of Standardized Options at www.TradeStation.com . Before trading any asset class, customers must read the relevant risk disclosure statements on www.TradeStation.com . System access and trade placement and execution may be delayed or fail due to market volatility and volume, quote delays, system and software errors, Internet traffic, outages and other factors.
Securities and futures trading is offered to self-directed customers by TradeStation Securities, Inc., a broker-dealer registered with the Securities and Exchange Commission and a futures commission merchant licensed with the Commodity Futures Trading Commission). TradeStation Securities is a member of the Financial Industry Regulatory Authority, the National Futures Association, and a number of exchanges.
Options trading is not suitable for all investors. Your TradeStation Securities’ account application to trade options will be considered and approved or disapproved based on all relevant factors, including your trading experience. See www.TradeStation.com . Visit www.TradeStation.com for full details on the costs and fees associated with options.
Margin trading involves risks, and it is important that you fully understand those risks before trading on margin. The Margin Disclosure Statement outlines many of those risks, including that you can lose more funds than you deposit in your margin account; your brokerage firm can force the sale of securities in your account; your brokerage firm can sell your securities without contacting you; and you are not entitled to an extension of time on a margin call. Review the Margin Disclosure Statement at www.TradeStation.com .
TradeStation Securities, Inc. and TradeStation Technologies, Inc. are each wholly owned subsidiaries of TradeStation Group, Inc., both operating, and providing products and services, under the TradeStation brand and trademark. When applying for, or purchasing, accounts, subscriptions, products and services, it is important that you know which company you will be dealing with. Visit www.TradeStation.com for further important information explaining what this means.

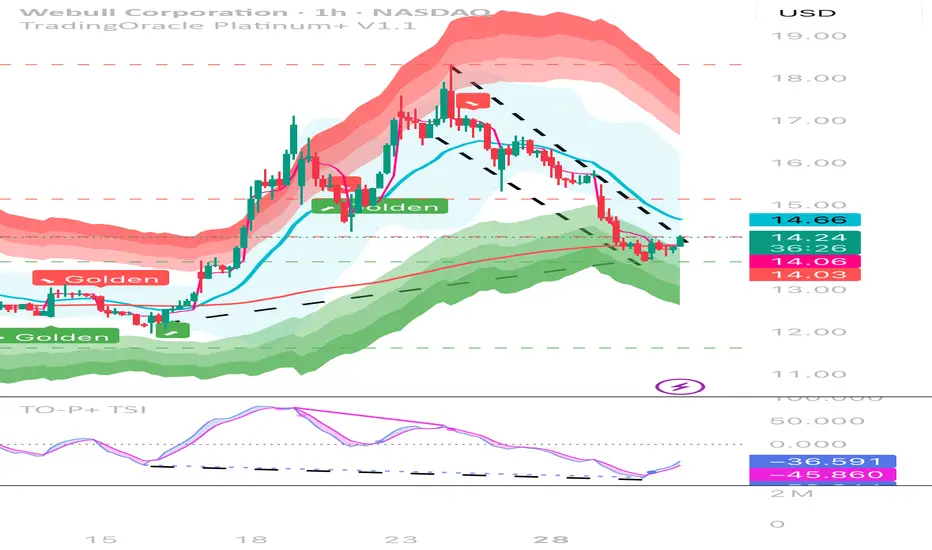
Hidden Bullish Divergence Bull is in a falling wedge patter while also making lower lows on the 1hr while making higher lows on the true strength index indicator. It is also bouncing off the 200ma, the bottom bollinger band, and the first reversal zone.