Gold OutlookDemand and Supply areas in action. Am looking at the two zones for bullish buildup. Extreme Discount zone has more probability
Multiple Time Frame Analysis

GBPCAD: Intraday Bearish Signal 🇬🇧🇨🇦
GBPCAD may drop from a key daily resistance.
A breakout of a neckline of a head & shoulders pattern
on an hourly time frame indicates a strong selling pressure.
Expect a retracement at least to 1.85 level.
❤️Please, support my work with like, thank you!❤️
I am part of Trade Nation's Influencer program and receive a monthly fee for using their TradingView charts in my analysis.

EURUSD: Bearish Move From Resistance Confirmed 🇪🇺🇺🇸
EURUSD finally retested a broken structure that I showed you earlier.
There is a high chance that the pair will continue retracing from that,
following a formation of a double top pattern and bearish imbalance.
Goal - 1.152
❤️Please, support my work with like, thank you!❤️
I am part of Trade Nation's Influencer program and receive a monthly fee for using their TradingView charts in my analysis.

NEAR Harmonic Reversal Setup with Clear Demand ConfirmationNEAR is shaping up beautifully within a bullish harmonic formation, completing around the 1.239 Fibonacci zone, precisely where price tapped into a major structural low and bounced back into the immediate buyback zone. This bullish reaction aligns with a clean demand retest and marks the beginning of a potential macro reversal.
Price action is now gearing towards the mid-range resistance near 4.91, and a break above this level will serve as a high-conviction trigger toward the major target at 9.05. Final projected leg leads into the high extension region of 23.99, forming a long range bullish continuation model.
As long as the demand zone holds firm, this remains one of the most structurally sound altcoins to monitor for exponential upside. Full validation will be confirmed once we reclaim above 4.91 with volume.

EURJPY OpportunityThe EURJPY is currently on the uptrend on the Daily timeframe. Once we look closer at the 4HR timeframe, the price is pullback. The price could break this short term pullback in next week which could result in buying opportunity, following the Daily upward trend.

EUR/AUD, EUR/NZD Technical SetupsThe euro has seen a fresh burst of bullish momentum against the Australian and New Zealand dollars, providing a near-term bullish bias for EUR/AUD and a longer-term one for EUR/NZD.
Matt Simpson, Market Analyst at City Index.

EURJPY ANALYSISAfter seeing the previous daily candle close bearish as a LH area for the 4hr structure we could expect price to continue lower into 176.250 area of support or into the moving average area on the daily timeframe..

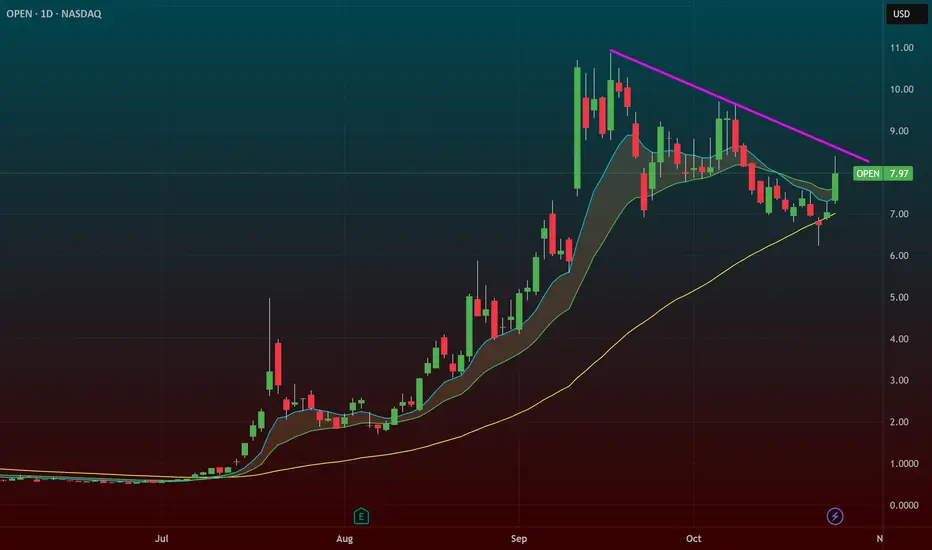
$OPEN – 50 SMA Retest with Trendline Breakout TriggerOpendoor Technologies ( NASDAQ:OPEN ) is setting up for a trendline breakout right as it tests the 50 SMA — a perfect technical spot for dip buyers to step in after a massive run.
🔹 The Setup:
After a strong multi-month rally, NASDAQ:OPEN finally pulled back into the 50 SMA, the first real test of trend support in this cycle.
Price is coiling just under a descending trendline, with an $8.50 trigger marking the breakout zone.
The consolidation is clean, volume is light, and momentum could reload quickly if the market stays hot.
🔹 Market Context:
The broader market is at all-time highs, and NASDAQ:OPEN has been one of the biggest winners in that run.
This pullback looks natural and healthy, not distributional.
Often, the first touch of the 50 SMA after a big run is where institutional buyers step back in.
🔹 My Trade Plan:
1️⃣ Entry: Watching for a breakout through $8.50 with volume confirmation.
2️⃣ Add: On strength above that level or retest of the breakout zone.
3️⃣ Stop: Below the 50 SMA — tight, well-defined risk.
Why I Like This Setup:
Trendline break + 50 SMA retest = classic continuation setup.
Big winner resting while the market is strong = ideal timing for a reload.
Risk is clean, structure is tight, and breakout potential is strong.
Nasdaq reversa 6-11-25Sellers were absorbed in that area, and the Nasdaq will likely reverse from this point in the coming days.
If it breaks through the supply zone, the trend could turn bullish in the next few days.

Altseason Setup? Dominance Charts Flash Key Confluence!BTC.D & USDT.D Combined Outlook 🧩
BTC Dominance is approaching the 61.8%–62.6% Fibonacci zone, a strong resistance where Bitcoin usually cools off, often leading to a liquidity shift toward altcoins.
USDT Dominance is also heading into the 6% resistance zone, which has historically acted as support for altcoins. A rejection here would signal funds rotating from stablecoins into risk assets, favoring alts.
In short:
If both BTC.D and USDT.D get rejected from their current resistance zones, we could see a strong rebound in altcoins soon. But continued strength in both would keep pressure on alts for now.
DYOR, NFA
Thanks for reading! Appreciate your support and engagement

EURAUD SHORT TERM MOVE If you're trading EURAUD going long is risky, price contacted DAILY SUPPLY ZONE🟤. THIS is the zone that is created by institutions not retail Traders

LONG ON GOLD XAU/USDGold has swept sell side liquidity and has given us a choc (change or character) to the upside.
There is tons of buyside liquidity to the upside with huge FVG's (Fair value gaps) and equal highs (double top) that need to be mitigated.
I am buying gold looking to catch over 200-300 points.
That's 2000-3000 pips.

Gold short term rallyGold is responding from institutional demand zone 🔴 but this move is for short term

DOLLAR INDEX (DXY): Too Overbought Now
Looks like Dollar Index finally starts correction.
A test of a significant hisotric daily resistance triggered
a bearish movement and an intraday change of character
on a 4H time frame.
I think that the market may drop lower.
Goal - 99.8
❤️Please, support my work with like, thank you!❤️

The 2025 Bitcoin Crash - This Means OpportunityLook at the Rate of Change...do you notice
the shift in momentum?
This means buyers are coming in to scope
the price of Bitcoin..
Listen to me Bitcoin is not going to
zero..
This is the type of crash that you have
been looking for.
This is the time
to start buying up as much bitcoin as
possible.
You will be actually getting Bitcoin
at a discount.
The momentum indicator below is your
key to understanding
market psychology
This is not time to get negative
and listen to main stream media
this is your chance to prove
to yourself that you understand
"The bottom" of the market.
I have a confession...
the rocket booster strategy is based
on a false crowd psychology
It means because everyone knows about it
the strategy no longer works..
Does this mean you give up on trading?
No of course not.
But what i want you to get from the
rocket booster strategy
is the behaviour of the WRONG Crowd.
Also understand that the price action
has to show you a new high or new low
depending on whether you are buying or selling.
Rocket boost this content to learn more.
Disclaimer:Trading is risky
please use risk management
and profit taking strategies.
And use a simulation trading
account before you
trade with real money

The #1 Forex Pair Before The Non-Farm Payroll Reporttrading can be a challenge
right now i dont know what to tell
because explaining how to find these patterns
is very very hard.
But with time you will get to understand.
I would encourage you to read a book
called the crowd by Lebon
In that book which was written
by french politician it talks about
the madness of crowds.
Its not easy to be independent..this is
why its very important for you
to really stay away from media hype
And learn to make your own decisions
and become self independent trader
Am not going to show you perfect trades
and if the trades turn out well
am not going to show you
the secret.
Because the secret is time.
Its that simple.Even if i show
you my secret..Your emotions
wont believe this because you
will need time to process the
reasons of why and how.
This forex pair OANDA:EURUSD is very good because
we are about to have a non farm payrolls
report tomorrow.
Positioning yourself right now
is the best thing that you can do
for yourself.
Rocket boost this content to learn more.
Warning!! Trading is risky please use risk management
and profit taking strategies
and feel free to use a simulation trading account
before you trade with real money.

GBPUSD Breakdown: Targeting 1.295 → 1.27 Next?GBPUSD has had a very strong move this year, rallying from the January low at 1.21 up to 1.38 — roughly a 1700-pip move. Over the last couple of months price has been topping out, and in recent weeks we’ve started to see a breakdown and retracement of that entire leg up.
On the Monthly chart, the 50% and 61.8% retracement levels are sitting right around the 1.295 – 1.27 area. This also lines up with the April buy zone, which was the origin of the move up to 1.38. This is the area I’ll be interested in for re-entry on the long side.
Zooming into the Weekly chart, last week we finally got a clean break and close below 1.325 support. Price dropped straight down and closed at 1.315, and this week continued lower into the 1.30 round number, where we’re now seeing a bit of reaction.
Based on structure, it looks likely that price will continue down into the 1.295 – 1.27 buy zone in the coming weeks.
On the 8H chart, the MACD has crossed bullish, so there’s a chance we see a short-term bounce first. This could easily be a fake-out move lower followed by a push up into 1.315, possibly even 1.325 depending on how the BOE meeting plays out.
More hawkish tone → likely bounce up into 1.315 – 1.325
More dovish tone → fast drop straight into the buy zone
I’ll be watching price action closely leading into the decision.
Let me know your thoughts below.

Gold is about to dropIf you trading GOLD SHORT SET UP BEEN FORMED,once this daily supply🟤 come into play nothing will stop it to drop

XAU/USD 06 November 2025 Intraday AnalysisH4 Analysis:
-> Swing: Bullish.
-> Internal: Bullish.
Analysis and bias remains the same as analysis dated 20 October 2025.
Price has printed as per previous intraday expectation by printing a bearish CHoCH which indicates, but not confirms, bullish pullback phase initiation.
Price is currently trading within an established internal range, however, I will continue to monitor price with regards to depth of pullback.
Intraday expectation:
Price to continue bearish, react at either discount of 50% internal EQ, or H4 supply zone before targeting weak internal high priced at 4,380. 990.
Note:
The Federal Reserve’s sustained dovish stance, coupled with ongoing geopolitical uncertainties, is likely to prolong heightened volatility in the gold market. Given this elevated risk environment, traders should exercise caution and recalibrate risk management strategies to navigate potential price fluctuations effectively.
Additionally, gold pricing remains sensitive to broader macroeconomic developments, including policy decisions under President Trump. Shifts in geopolitical strategy and economic directives could further amplify uncertainty, contributing to market repricing dynamics.
H4 Chart:
M15 Analysis:
-> Swing: Bullish.
-> Internal: Bearish.
You will note how price remains contained in consolidation between a supply and demand range. The rest of my analysis and bias remains the same as bias date 29 October 2025.
As expected, price has printed a bullish CHoCH to indicate bullish pullback phase initiation.
Price is now trading within an established internal range.
Intraday expectation:
Price to continue bullish, react at either premium of internal 50% EQ or M15 demand zone before targeting weak internal low, priced at 3,886.465.
Note:
Gold remains highly volatile amid the Federal Reserve's continued dovish stance, persistent and escalating geopolitical uncertainties. Traders should implement robust risk management strategies and remain vigilant, as price swings may become more pronounced in this elevated volatility environment.
Additionally, President Trump’s tariff announcements, particularly against China, are expected to further amplify market turbulence, potentially triggering sharp price fluctuations and whipsaws.
M15 Chart:

AUDJPY: Short Term Bearish Movement 🇦🇺🇯🇵
AUDJPY may drop from the underlined intraday horizontal resistance.
We can expect a retracement at least to 99.9 level.
❤️Please, support my work with like, thank you!❤️
I am part of Trade Nation's Influencer program and receive a monthly fee for using their TradingView charts in my analysis.


Bitcoin Bounce Underway, But Bears May Not Be Done YetMy initial 100k downside target has been reached. While we’re seeing the almost obligatory bounce from a key level, Bitcoin could still head towards 90k. I take a fresh look at Bitcoin futures and their correlation with Wall Street.
Matt Simpson, Market Analyst at City Index

Short trade
Pair: AUDUSD
Direction: Sell-Side Trade
Date: Wed 5th Nov 25
Time: 1:00 am
Session: London Session AM
Timeframe: 1 Hour
🔹 Trade Details
Metric Value
Entry 0.64944
Profit Level (TP) 0.64437 (+0.73 %)
Stop Level (SL) 0.64995 (–0.12 %)
Risk–Reward (RR) 5.93 R
🔸 Technical Context
Market Structure:
Price completed a retracement into premium following a previous impulsive leg down.
The retest into the breaker block + KAMA resistance zone (0.6490–0.6500) acted as a re-entry for continuation.
🔹 Narrative & Bias
AUDUSD continues to reflect bearish sentiment following a USD reaccumulation phase.
The rejection from premium levels within the established downtrend suggests sellers are firmly in control, with order flow showing progressively lower highs and BOS confirmations across multiple sessions.
Macro Correlation:
AUD weakness mirrors declining commodity sentiment and a dovish RBA stance.
USD demand remains supported by a risk-off tone following the NASDAQ pullback and the markdown in ETHUSDT.
Projection:
Expect continued draw on liquidity toward 0.6440–0.6430, with potential to extend below 0.6400 if intraday momentum persists. The short bias remains intact as long as the price remains below 0.6500.
