5m & 4H Supply and Demand Short - CLLooks like Price (CL!) is getting to a support area based on the 4H chart (zoom out).
So, I've mapped a daily gap, 4H zone, for a quick short.
There are double bottoms way down around 58.27, so keep an eye out as this 4H trend has got to get swiped.
Multiple Time Frame Analysis

gold going long!! but not yetmy thoughts on gold is that we are going to continue bullish momentum but first we need a slight pull back . gold already confirmed a change of character when it slightly broke the previous highs last week around 4260 . that is also at a daily supply area and price is once again showing weakness once reaching that area. I see gold pushing back down to 4087 which would create relatively equal highs at that supply area. once price rejects 4087 we can anticipate buys up to 4377 area.

"The Liquidity Trap 90% of Traders Completely Miss"🔥 EVERY TRADER GETS TRAPPED HERE… EXCEPT THE ELITE
You watch the highs and lows, the support and resistance, the obvious levels…
And you think you’re safe.
You’re not.
The real move comes from liquidity inside the swing — the part most traders never notice.
1️⃣ External Liquidity is What Retail Chases… Not the Real Move
• Traders see obvious highs, obvious lows, support, resistance.
• They think: “Price will reverse here.”
• This is the illusion the market creates.
Here’s the truth:
External liquidity is bait, not the target.
It’s where most traders get trapped.
⸻
2️⃣ Internal Liquidity is Where the Smart Money Lives
Inside every swing — every leg up or down — exists hidden liquidity:
• Micro Order Blocks
• Lower highs / higher lows inside the leg
• Stop clusters designed to trigger retail exits
Most traders don’t look inside the leg. They only see the edges.
That’s the trap. That’s where your edge comes in.
Nugget: The move you want usually comes after the internal liquidity is cleared, not at the obvious high/low.
⸻
3️⃣ The Sequence Traders Must See (Stop Losing to the Trap)
Here’s the real SMC sequence, step by step:
A. External Sweep → The Bait
• Everyone watches it
• Everyone reacts
B. Internal Liquidity Run → The Real Target
• Hidden inside the leg
• Where stops, inducements, and OBs cluster
• The market clears this before the real move
C. Displacement → The Delivery
• After internal liquidity clears, price finally moves in the “true” direction
• This is when smart traders enter with confidence
Nugget: If you chase the sweep and ignore internal liquidity, you’re giving your edge to the market.
⸻
4️⃣ How to Spot Internal Liquidity Like a Pro
Look for these patterns inside the leg:
• Lower highs / higher lows forming in micro OBs
• Price clustering around imbalance areas
• Fake breaks that lure retail orders
• Zones where price pauses before real expansion
Golden Nugget: Price gives clues every time. The problem is, 90% of traders don’t see them.
⸻
5️⃣ Why Traders Lose Even When They’re “Right”
• You can have the right bias
• You can see the sweep
• You can even pick the “obvious OB”
But if you enter too early or in the wrong micro-structure, your stop gets taken, and the move happens without you.
This is why SMC isn’t about guessing.
It’s about understanding sequence, intention, and liquidity footprint.
⸻
6️⃣ Mindset Shift: Read Market Intention, Not Candles
Stop asking:
• “Did it break the high?”
• “Did it hit my level?”
Start asking:
• “Where is the internal liquidity being cleared?”
• “What is the smart money engineering?”
• “Where will the market take the stops before the real move?”
Nugget: Reading price action without seeing internal liquidity is like driving blind.
⸻
7️⃣ The SMC Edge You Must Internalize
• External liquidity = bait → observe
• Internal liquidity = real objective → anticipate
• Displacement = delivery → execute
When you see it unfold:
• Your entries become surgical
• Your stops make sense
• Your bias is confirmed before most traders even blink
You’re not reacting to the market.
You’re predicting its intentional sequence.
⸻
🔥 Final Takeaway (Save This)
The market isn’t random.
It’s designed to trap traders.
External liquidity tricks 90% of traders into early stops.
Internal liquidity reveals where the real move will come.
Learn to see it.
Respect it.
Trade it.
This is the real sauce of SMC trading.
Not flashy indicators. Not random setups.
Sequence, liquidity, inducement.
Pro Nugget: Once internal liquidity is in your sights, price becomes predictable.
The rest? Just execution.

AUDCAD - Bullish Outlook | Weekly * MidtermHigher-Timeframe Bias:
AUDCAD is bullish. HTF structure is clean, price has broken major and significant highs, showing clear bullish intent and directional control.
Mid-Term Structure:
On the mid-term perspective, structure is mapped and ready for continuation.
Currently, we’re waiting for:
• A sell-side liquidity sweep
• Inducement taken
• Price falling into the internal-framework OB just underneath
Once full mitigation occurs, we drop to lower timeframes for confirmation.
Lower-Timeframe Execution:
On LTF, we’re looking for:
• Internal micro lower-high break
• Pullback within the bullish leg
• Entry points to target:
• Mid-term highs
• HTF highs
• LTF highs
Plan:
Until the market opens, we stay patient.
Smart Money leads direction; we track footprints. Our job is to monitor structure, map zones, and execute when the algorithm delivers.
Patience is key. Follow the footprints. Let’s go.

USDCAD - Bullish Outlook | Weekly * Midterm Higher-Timeframe Bias:
USDCAD is bullish. HTF structure is clean — price has broken major and significant highs to the left, maintaining a clear bullish trajectory.
Mid-Term Structure:
Price initially disrespected the mid-term flow but landed into a HTF internal-framework structure zone.
• From here, we wait for a mid-term CHoCH (trend change)
• Once the CHoCH occurs and a new POI is refined, the plan is:
• Wait for mitigation
• Drop to lower timeframes to play continuations
Execution Approach:
This setup will take time to fully develop. Until then, we track price, follow the footprints, and remain aligned with structure.
Plan for the Week:
We stay patient and observe — let Smart Money lead the direction.
Structure first, entries second.
Patience is key. Follow the footprints. Let’s go.
USDCHF - Bullish Outlook | Weekly * MidtermHigher-Timeframe Bias:
USDCHF remains bullish. Price has maintained clear HTF bullish structure, breaking highs and respecting higher-high / higher-low sequencing. Corrections have been deep, but structure remains intact.
Mid-Term Structure:
From the mid-term perspective:
• Price took out sell-side liquidity
• Mitigated both mid-term and HTF order blocks
• When price reached the HTF OB, we normally wait for a mid-term CHoCH
However, lower-timeframe structure is cleanly holding within the mid-term OB, giving confidence that continuation is intact.
Lower-Timeframe Execution:
While the LTF micro charts aren’t physically visualized here, from a broader bird’s-eye view:
• Price switched lower-timeframe structure
• Delivered bullish push power toward mid-term and HTF highs
• Inducement and engineered liquidity were taken in the green structure far to the right
Lower-timeframe entries will be looking to ride continuation, targeting:
• 5-minute highs
• Mid-term highs
Plan:
Until market opens, we remain patient, observing how Smart Money directs price.
If price doesn’t give our ideal setup, we track, monitor, and adjust — no cracks, no forced entries.
The Job:
Map structure → Track footprints → Follow the flow.
Patience is key. Let Smart Money lead. Let’s go.

EURGBP - Bullish Outlook | Weekly * MidtermHigher-Timeframe Bias:
EURGBP remains bullish. On the HTF, we have a clean, event-driven structure:
Price has been breaking major highs, pushing the market into higher-high / higher-low context and maintaining bullish order-flow.
Mid-Term Structure:
On the mid-term perspective, I’m looking to attend continuations.
Inside the structure, this is what we see:
• Price took out the inducement from the top
• Engineered liquidity was collected
• Price fell into a thin, refined internal-framework structure order block (the orange line that might be hard to see)
However, while we did get an initial bullish reaction, price pushed deeper — tapping directly into the higher-timeframe internal-framework structure order block.
That deeper tap is the true reaction point.
Next Step — Midterm CHoCH:
From the HTF OB, we wait for:
• A mid-term CHoCH (trend change)
• A new refined mid-term POI to form
Once that refined POI forms, the plan is:
1. Wait for the inducement above the refined POI to be taken
2. Let price fall back into the mid-term order block
3. Once mitigated — drop down to LTF
Lower-Timeframe Execution:
After dropping to LTF, the model is simple:
• Wait for the internal LTF lower-high break
• Get the pullback inside the bullish leg
• Execute longs targeting:
• Mid-term highs, and
• Higher-timeframe highs
This keeps our entries aligned with both direction and structure.
The Approach:
We stay patient and we let Smart Money reveal the next step.
If price shifts deeper or accelerates early, we simply adjust — because our job is to track the footprints, map structure, and follow delivery.
Patience is key. Structure is king. Let’s work.

CADJPY - Bullish Outlook | Weekly * MidtermHigher-Timeframe Bias:
CADJPY remains bullish. HTF structure is clean, visual, and directional — price continues to respect bullish order-flow, confirming upward intent.
Mid-Term Perspective:
Going into the upcoming week, we’re looking for continuations.
I’m waiting on a sell-side liquidity sweep, but keep in mind:
Price is moving with strong volume and has already cleared mid-term highs.
That type of aggressive delivery typically leads to:
• A clean sweep of the current leg
• Followed by price dropping into the higher-timeframe order block below
That HTF OB is where the meaningful reaction is expected.
Important Note — Patience With LTF:
When price drops directly into a HTF structure, we do not jump straight to lower timeframes.
Reason:
LTF can easily be pushed around inside a HTF zone — it’s “big boy structure.”
Instead, we follow a disciplined, top-down sequence.
Execution Sequence:
1. Wait for price to sweep sell-side liquidity
2. Expect a drop into the HTF order block
3. Do not go to LTF yet
4. Wait for a mid-term CHoCH off the strong HTF zone
5. Once mid-term structure confirms, refine the POI
6. After mitigation of the refined mid-term POI → then drop to LTF for confirmation
This is the proper mapping sequence — a clean top-down approach.
If Price Doesn’t Follow Our Steps:
No panic, no emotion.
We simply:
• Track price
• Monitor delivery
• Follow the footprints
That’s our job as day traders — observe, map, adjust.
Plan:
We wait for market open.
We let Smart Money align the direction.
Then we execute with precision.
Patience is key. Follow the footprints. Let’s go.
GBPJPY (GJ) - Bullish Outlook | Weekly * MidtermHigher-Timeframe Bias:
GBPJPY remains bullish. On the HTF, price continues breaking major highs, printing a clean sequence of higher-highs and higher-lows. Direction is clear, structure is controlled, and Smart Money is maintaining bullish flow.
Mid-Term Perspective:
On the mid-term view, we want to play continuations. Price is currently sitting at a high, and the next step we’re waiting for is:
• A sell-side liquidity sweep,
• Followed by price falling into our internal-framework structure order block sitting underneath the inducement.
Once mitigation occurs, we move into execution mode.
Lower-Timeframe Execution Plan:
After price taps the refined OB, we want LTF confirmation:
• A trend change
• A clean internal LTF lower-high break
• Then a pullback into the bullish leg for our entry
From there, targets are:
• Mid-term highs
• Higher-timeframe highs
If Price Violates the Zone:
If price violates the orange zone and dips deeper — no fear, no panic.
We simply:
• Reassess
• Pull up the PD grid
• Locate the next valid order blocks in discounted territory
The OB we’re currently working with is aligned with near structure and current order-flow, but deeper discount is still valid if price chooses that path.
If Price Keeps Climbing:
If price continues pushing higher without giving our sweep/mitigation, that’s fine too.
We track the footprints, stay aligned with structure, and wait for the next clean opportunity.
Plan:
Direction is clear. Liquidity is in place. Structure is clean.
We stay patient, wait for Smart Money to reveal the next step, and execute when the algorithm delivers.
Patience is key. Follow the footprints. Let’s go.

XAUUSD still in corrective mode!I believe that GOLD is still in corrective wave and it is not done yet!
Possibilities prices to go down after hitting zone 4275 and 4325

AUDJPY (AJ) - Bullish Outlook| Weekly * MidtermHigher-Timeframe Bias:
AUDJPY is bullish on the high-term perspective. Price has been breaking major highs and significant highs, leaving us positioned at a precise, pinpoint high on the HTF.
Direction is clean — Smart Money is clearly leaning upward — so we continue to favor bullish continuations.
Mid-Term Structure:
On the mid-term perspective, structure is also bullish. Price already broke another significant high, keeping the continuation narrative intact.
Now the next steps are simple:
• Price needs to clear the volatility leg,
• Take out the side liquidity, and
• Then mitigate into our mid-term internal-framework structure order blocks
That mitigation gives us our refined POI.
Lower-Timeframe Execution:
Once price taps that mid-term OB, I’ll be dropping down to the LTF to confirm direction through:
• A clean LTF lower-high break,
• A sell-side liquidity sweep, and
• Structure holding inside the refined OB
When those align, I’ll be looking to ride longs toward mid-term highs and then HTF highs.
If Price Skips the Sweep:
If price refuses to sweep the side liquidity first, then we simply track the footprints as it falls into liquidity on the way down.
Never forcing the market — always following the algorithmic path.
Plan for Market Open:
Until market opens, we stay patient and let Smart Money lead direction.
We trade the footprint — not emotions.
Patience is key. Follow the footprints. Let’s go.

USDJPY (UJ) - Weekly Bullish OutlookHigher-Timeframe Bias:
USDJPY remains cleanly bullish. HTF structure is intact, with price consistently breaking major highs and pushing into new significant levels. Order-flow is controlled and directional — Smart Money is clearly favoring the upside.
From this perspective, we seek continuations, not reversals.
Mid-Term Structure Read:
On the mid-timeframe, structure is fully mapped out. Price recently swept sell-side liquidity, tapping directly into a refined internal-framework structure order block.
Once price entered that narrowly refined zone, we saw:
• Structure holding
• Rejection wicks protecting the level
• Clear evidence Smart Money had no intention of continuing a bearish phase
This zone is extremely refined on the mid-term view, so visually it may appear thin — but the reaction confirms its legitimacy.
Lower-Timeframe Expectations:
Going into market open, I’m waiting for:
1. A clean LTF lower-high (LH) break
2. A sell-side liquidity sweep
3. Price falling into the internal structure OB for mitigation
Once those three steps complete, I’ll be looking to execute longs with targets set toward:
• Mid-term highs, and
• Higher-timeframe highs
Plan:
Bias is bullish. Liquidity has been collected. Structure is holding.
Now we wait for LTF confirmation to align with the smart-money footprint.
Patience until market open — then let the algorithm deliver.
Let’s work.

GBPNZDPair found a weekly resistance zone around 2.34000 and failed to break above. Came back down and broke a minor D/H4 support around 2.31500, went to retest both the zone and 50EMA also forming an evening star pattern.

EURUSDOn the daily TF price came back and retested a weekly support zone, bounced off with momentum forming a double bottom with neckline broken which could signal a potential strong upward movement. H4 is at a support trendline and H1 is possibly forming a bullish flag. Lets wait and see this weeks price action

Gold risky scalpVery risky scalp am holding. Gold is bullish overall. Counter trend trade.
You can join me if you can. Risk little and manage trade well. Breakeven at 1:3RR


Elliot Wave Analysis1. price action has printed and completed 3 waves already (2 impulse
waves and 1 corrective wave.
2. it's currently printing the fourth corrective wave, when this wave is completed
i'll be waiting for a buy confirmation to trade the fifth wave, more than 200 pips up
move is expected when the fifth wave is printed.

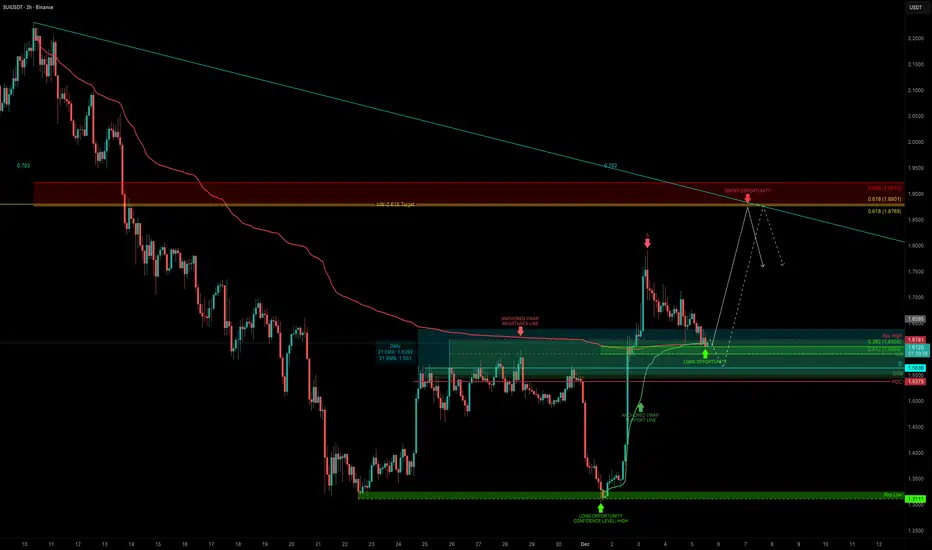
SUI: The Power of ConfluenceSUI just delivered one of the cleanest moves. After sweeping the liquidity low at $1.3111, price launched nearly +40% in under two days, ripping through a full 5-wave impulse and breaking market structure. Now that the fast move is done, the real question is:
Where’s the next high-probability setup?
To answer that, we break down the support/resistance zones, VWAP structure, Fibonacci levels, and market cap confluence that are now forming.
1. The Key Support Cluster at $1.60
To map the next setup, we first look for strong support. And right now, $1.60 is loaded with confluence:
Anchored VWAPs from both the swing low ($1.3039) and swing high ($2.231) meet at roughly $1.60
Fibonacci Retracement
The 0.382 retracement of the entire impulse sits exactly at $1.60. After fast moves, holding the 0.382 is typically what you want to see for bullish continuation.
Dynamic EMAs & SMAs: Daily 21 EMA → $1.64, Daily 21 SMA → $1.55.
These are dynamic tools, so they shift over time, but both are already closing in on the same zone.
Daily level at $1.5636
POC of the previous range at $1.5375.
Both overlap with the daily order block, adding confidence.
Monthly Anchored VWAP.
Currently around $1.5782, giving this area even more weight.
Market Cap Confluence
$1.60 ≈ 6B market cap
$1.87 ≈ 7B market cap
I like using market caps as macro support/resistance, and these levels line up beautifully. All in all, $1.55–$1.60 is shaping up as the main demand zone.
2. Upside Target → the 0.618 Fib
Using the retracement from the downward move
($2.231 → $1.3039), the 0.618 Fib sits at $1.8768.
This also lines up with the 7B market cap and previous resistance structure.
That makes it the main target for the next leg up.
3. Risk Management
An entry between $1.60-$1.55 with an SL below the POC / order block allows for:
R:R between 1:4 and 1:6 (depending on how you ladder)
Clear invalidation
Strong structural backing
Multiple layers of confluence
Summary
SUI swept a major low, completed a sharp impulse, and broke market structure. Now it’s retracing into what looks like a high-confluence long zone around $1.55–$1.60. If this support zone holds, the next target is $1.87, giving a clean and logical long setup with solid R:R.
🔍 Indicators used
Multi Timeframe 8x MA Support Resistance Zones → to identify support and resistance zones such as the daily 21 EMA/SMA.
➡️ Available for free. You can find it on my profile under “Scripts” and apply it directly to your charts for extra confluence when planning your trades.
_________________________________
💬 If you found this helpful, drop a like and comment!
Trade Plan: GBPUSD Buy SetupMarket Context
Last week, GBPUSD broke above the resistance / previous week’s high at 1.3268.
Current price action is ranging between 1.3316 – 1.3384.
I anticipate a retracement into the prior supply zone, now acting as demand, around 1.3259 – 1.3275.
Trade Rationale
Breakout above weekly high confirms bullish momentum.
Demand zone at 1.3259 – 1.3275 offers a potential area for price reaction and continuation higher.
Tight stop below demand zone ensures controlled risk.
Target aligns with upper range resistance near 1.3350.
Trade Setup
Entry: 1.3280
Stop Loss (SL): 1.3255
Take Profit (TP): 1.3350
Risk-to-Reward (RR): 2,8x
Execution Notes
Wait for price confirmation at demand zone before entry.
⚠️ Disclaimer ⚠️ This journal entry is for educational and documentation purposes only. It does not constitute financial advice or a recommendation to trade. All trading involves risk, and past performance does not guarantee future results. Always conduct your own analysis and consult with a licensed financial professional before making trading decisions.

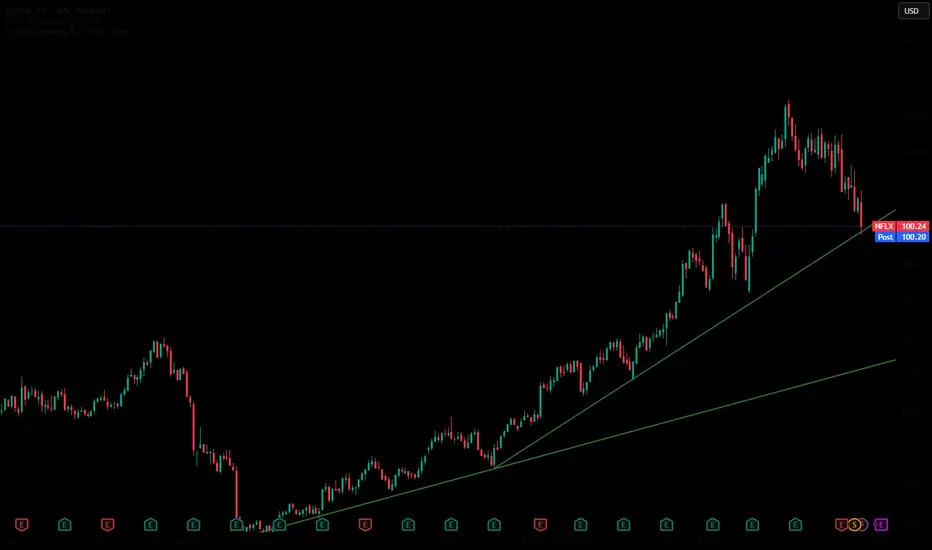
Multi-Timeframe Confluence on NFLX – Trendline RespectI’m basing my decision on the confluence between the daily and weekly trendlines. Price is currently respecting both structures, which adds strong technical validity to the setup. When a ticker aligns on higher timeframes—especially the 1-day and 1-week—it usually signals a higher-probability move because these levels are watched by larger players and institutions.
For NASDAQ:NFLX around 100.07, the rejection and respect of these trendlines support the idea that the market is acknowledging these zones as meaningful levels. That’s the core reason behind my decision.
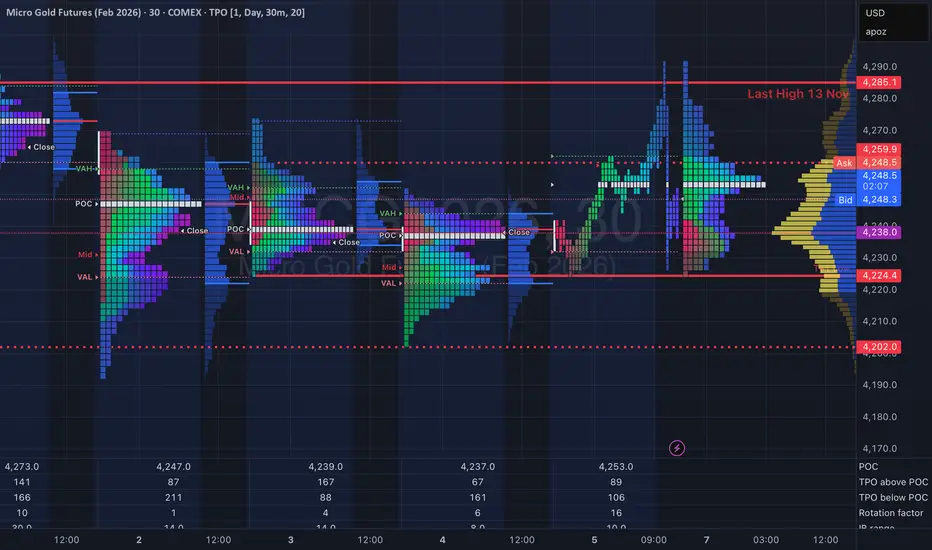
Gold Context: The 4290 Probe & Weekly Balance OutlookFOREXCOM:XAUUSD COMEX_MINI:MGCG2026 COMEX:GC1!
Traders. Weekly wrap-up and context outlook for the next auction.
Market Context (The Rejection):
Gold rejected the 4290 level, falling just short of the 4300 psychological magnet.
• Interpretation: While the day ended with a rejection (excess), we must not ignore that the auction did facilitate trade at these levels. This extension above our 3-day balance indicates intent.
• The Profile: The rally displays characteristics of short covering (squeezing weak shorts) rather than aggressive new buying. The rejection simply indicates the price was "too high" for the current timeframe, but the level remains a valid target for a revisit.
Structure & Outlook (Next Week):
We are monitoring the Weekly Balance zone roughly between 4220 – 4260.
• The Bull Case (Acceptance): If we see continued short covering transition into New Money (OTF) buying above this balance, we look for acceptance at these higher prices. This would open the door to trade through 4300.
• The Bear Case (Liquidation): There is a probability of long liquidation if the auction fails to hold the balance, but I am cautious/skeptical of the downside potential right now.
Plan:
Watch for acceptance vs. rejection relative to the 4220–4260 balance. We need "New Money" to sustain the break of 4300.
Talk to you for the next update.
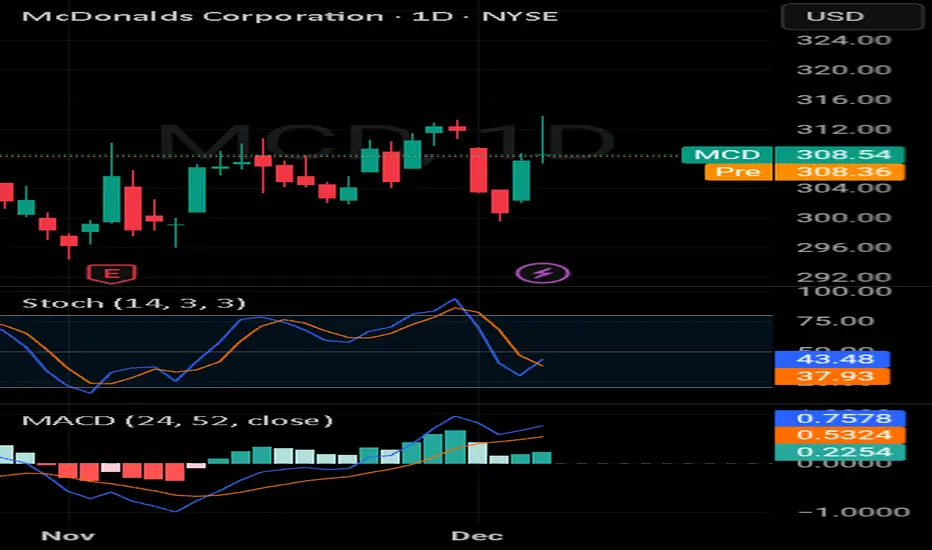
Te 2 Biggest Problems When Buying Stock Options My body is in pain.
Because I have been exercising.
Also I did yard work.
Determining the whether is not easy.
Just when you think it's raining.
It doesn't rain.
When you think it won't rain.
Then it rains.
Look at this chart.
The stochastic has crossed.
The %k above the %d
Below the 50 level.
The MACD Histogram is green.
This green is on the weekly time.
Finally the 4h entry.
The sentiment analysis is green.
This shows you that buying pressure.
The pressure is building.
This gives you a good support.
You will need support.
This support will help your broker.
How?
You see the problems are these:
⚠️ Buying on a breakout
⚠️ Brokers poor execution during a breakout.
This is what you are avoiding.
When you enter on 4hour time frame sentiment.
Will you ever be right when predicting the weather?
Will you ever be right when predicting the market sentiment analysis?
These are some questions to 🤔 about.
Rocket boost 🚀 this content to learn more.
Disclaimer ⚠️ Trading is risky please learn about risk management and profit taking strategies.
Also feel free to use a simulation trading account before you use real money.