XAU/USD 30 January 2026 Intraday AnalysisH4 Analysis:
-> Swing: Bullish.
-> Internal: Bullish.
Price has printed as per analysis dated 22 January where I mentioned price to print bearish CHoCH to indicate bearish pullback phase initiation.
Price is now trading within an established internal range.
Intraday expectation:
Price to react at either discount of 50% internal EQ, or H4 supply zone before targeting weak internal high priced at 5,602,225.
Note:
The Federal Reserve’s renewed easing cycle, alongside a weaker U.S. dollar and persistent geopolitical tensions, continues to drive volatility in the gold market.
Traders should remain cautious and adjust risk management strategies to navigate sharp price swings.
Additionally, gold pricing is highly sensitive to U.S. policy under President Trump, where tariff measures, fiscal uncertainty, and shifting geopolitical strategy amplify market repricing risks and reinforce safe‑haven demand.
H4 Chart:
M15 Analysis:
-> Swing: Bullish.
-> Internal: Bullish.
Price has printed according to yesterday's analysis where I mentioned that price should print a bearish CHoCH to indicate bearish pullback phase initiation.
Price is currently contained within an established internal range.
Intraday expectation:
Price trade down to either M15 demand zone, or discount of 50% internal EQ before targeting weak internal high, priced at 5,602.225.
Alternative scenario: Price could potentially print a bearish iBOS as all HTF's require a pullback.
Note:
Gold continues to exhibit elevated volatility as markets digest the Federal Reserve’s ongoing dovish tilt and persistent global geopolitical tensions.
With uncertainty remaining a dominant theme across global risk assets, traders should prioritise disciplined risk management, as abrupt price swings and liquidity pockets may become increasingly common.
Furthermore, recent tariff announcements from President Trump, particularly those directed at China, have added another layer of instability to the macro landscape. These policy developments have the potential to intensify market turbulence, heighten risk‑off flows, and trigger sharp intraday reversals or whipsaw‑like behaviour in gold.
M15 Chart:
Multiple Time Frame Analysis

BitCoin long-term forecast 2026 dropping to $45k?Bitcoin monthly demand level is under attack. New low printed.
The yearly timeframe is trending up and the dump has started, hopefully. CRYPTOCAP:BTC can continue the dump as explained a few weeks ago.
Next stop is the monthly demand imbalance at $64k. No longs are adviced in the middle or a long-term dump.

EURUSD H1 HTF FVG Rejection and Bearish Scenario📝 Description
FX:EURUSD has reacted bearish after tapping into a higher-timeframe Fair Value Gap (H1 FVG) and failing to sustain bullish momentum. The recent impulsive downside move suggests distribution from a premium zone, with price now consolidating below key resistance.
________________________________________
📉 Signal / Analysis
Primary Bias: Bearish below the H1 FVG
Preferred Setup:
• Entry: 1.1923
• Stop Loss: Above 1.1948
• TP1: 1.1895
• TP2: 1.1867
• TP3: 1.1850
________________________________________
🧠 ICT & SMC Notes
• Rejection from H1 Fair Value Gap (premium area)
• Sell-side liquidity resting below recent lows
• Targets aligned with H1 Order Block and imbalance zones
________________________________________
📌 Summary
As long as price remains below the 1.1950 resistance and fails to reclaim the H1 FVG, bearish continuation is favored. Current structure supports a downside rotation toward lower liquidity pools and HTF demand levels.
________________________________________
🌍 Fundamental Notes / Sentiment
Ongoing USD resilience and the absence of strong bullish catalysts for the euro continue to weigh on EURUSD. Macro sentiment supports downside moves rather than sustained upside recovery in the short term.
________________________________________
⚠️ Risk Disclosure
Trading involves substantial risk and may result in capital loss. This analysis is for educational purposes only and does not constitute financial advice. Always apply proper risk management, predefined stop-loss levels, and disciplined position sizing aligned with your trading plan.

XAUUSD BullishI might be a little early, since I like to wait until the London or USA trade session , but the possibility of this happening is good. In reality, i would wait for more conformation before entering the trade, but so far everything looks good as the 15m, 1h and 4h are starting to align giving bullish signals. I just thought i should share this quick analysis as I'm trying to stay active away from home, Peace! OANDA:XAUUSD

HTF swing trade Daily gap fill, filled over 50%. Entry here with wide SL. Targeting 106 with partials along the way.
Cheers

Bullish AUDUSD - All technical no fundamental multi tf analysis. short the dollar wait for the 5m and 15m tf to bottom on and start turning bullish then scale in.


Bitcoin to crash 70% in 2026 to $35k? - January 2026This chart is so simple it should be illegal. Influencers push out super-cycle nonsense while the chart screams the most obvious return of gravity.
Two oscillators at the bottom of the above 1 month chart:
RSI
RSI closes below 54 on the monthly (red circles). If the month of January closes as is below 54, then the next 700 days will be a grand nothing burger. 2 years of zip. Look left, this time is not different. Influencers will still publish daily videos “Black rock is buying”.
Stochastic RSI
Here we see momentum crossing down 20 (Green circles) for the first time since January 2021. Each and every event throughout Bitcoin’s history saw 70% corrections at a minimum, 90% corrections at the maximum. A 70% correction could be conservative, with a forecast to $37k and 90% as low as $12k.
Is this time different?
No. Come on, seriously? How for gone are you?
Will I short?
No. I never short any market, there’s never any need to do that. Only long what is oversold and beaten down. And right now it’s Christmas come early as 99% of the market chase shinny objects. Me? I'm chasing 0.01% that's about to explode on ideas already published and yet so few have commented on.
Ww
==========================================
Disclaimer
Right. Listen up, you desperate, hopeful goblins. Before you read this and immediately sell your kids’ shoes to bet on a Bitcoin crash because some bloke on the internet drew some red circles… a word.
This isn’t financial advice. It’s not even good advice. It’s a chart with some lines and circles I made while avoiding proper work. Treat it with the same respect you’d give a horoscope written by a drunk pigeon.
I am a moron. Seriously, I tried to short Gold at $2k, din't you read the comments? I’m a stranger with a drawing tool. My greatest financial achievement this year was finding a 10 cent coin in the laundromat. Do not model your life on my squiggles. You wouldn’t let me perform surgery on you with a spoon, so don’t let me perform surgery on your portfolio with a stochastic RSI.
I Won’t Short It. I said I won’t short. Know why? Because I’m a coward. Or wise. It’s the same thing. So if it moons and you shorted because of me, you’re not only poorer, you’re also braver than I am. And bravery in finance is just a pretty word for “stupidity.”
In summary: This is for entertainment. If you lose all your money, you can’t have my 20 cents.

GBPUSD DAY-TRADING SETUPToday on the GBPUSD, our intra-day trend is still BULLISH, we also had a BEARISH CLOSURE on the DXY as confluences.
Going forward, we have spotted a B-Block on our Zone TF + We had our LTF entry confirmation, so we will be partaking in this 1R - 4R trade, don't forget to apply a good risk management on this trade.

S&P 500 - Scalping Opportunity Yielding 90-120 TicksMore Opportunities With S&P 500 (ES Futures Contract). Studying How Price Delivers To A Discount Below $6,982.50. Looking Out For Selling Pressure To Target Hourly Relative Equal Lows Inside Daily BISI. $6,977 - $6,964 Draw On Liquidity For Tomorrow

Gold to crash 60% in 2026? - January 2026Fort the 2nd time in history the Relative Strength Index (RSI) has touched 95 as shown on the above 6 week chart. The previous time was back in 1968, or 57 years ago.
After 1968 the highest RSI was 94, back in January 1980. Not long after the dollar came off the Gold standard. A -63% crash followed. The 2011 a -45% crash printed with an RSI at 84.
The Relative Strength Index (RSI) is a popular momentum oscillator used in technical analysis to measure the speed and magnitude of recent price changes. It helps traders identify overbought or oversold conditions in a stock or asset.
Range: 0 to 100.
Common Thresholds:
Above 70: Overbought (potential sell signal).
Below 30: Oversold (potential buy signal).
Should a value of 95 be considered a buying opportunity like many Gold bugs are calling for?
Short answer: No.
An RSI of 95 is extremely rare and almost never a buying opportunity based on the standard RSI rule. In fact, it's a strong warning signal for a potential pullback or reversal.
Here’s a detailed breakdown of why buying at RSI 95 is typically a bad idea:
1. Extreme Overbought Condition
RSI above 70 is considered overbought. At 95, the asset is in an extreme parabolic state. This often indicates a buying frenzy or a "blow-off top," which is unsustainable. A sharp correction is highly probable.
2. Momentum exhaustion
The Stochastic RSI measures momentum. A stochastic RSI reading of 80 and above is overbought. 90 is Apollo VI on launch, 99 where we are now, is the bit where mission control’s gone quiet, the monkey’s pressed all the buttons, and everyone’s pretending this was always part of the plan while gravity waits patiently to do what it does best.
For the 1st time ever momentum has just past 800 days over 80. The previous record was around 500 days.
3. High risk of mean reversion
The core principle behind RSI is mean reversion prices tend to return to their average. The farther the RSI moves from 50, the stronger the gravitational pull back toward it. An RSI of 95 is like a stretched rubber band ready to snap back violently. The mean price is currently around $3000
4. Potential for false signals in strong trends
While it's true that in a very strong bullish trend, the RSI can remain "overbought" (above 70) for extended periods, a reading of 95 is almost never sustainable. Even in a powerful uptrend, this level suggests a short-term peak is imminent.
Is Bitcoin a good rotation?
Short answer: No
In fact, there’s strong evidence Bitcoin will collapse as hard and as fast as Gold during 2026. Don’t fall for this super cycle nonsense influencers are pumping out.
Is this time different?
No. It’s still people reaching for the "emergency exit." when all hell breaks, and that is understandable. Look at the headlines around the world today. The United States government has never seemed more chaotic for us outsiders, policy determined via truth social posts, Allies threatened with economic penalties if they don’t take the knee, ICE agents with judicial executions if citizens if they look the wrong way, tariffs handed out like flyers, cost of everyday food stuffs exploding in price.. what a legacy.
Will I short gold?
No. I never short any market, there’s never any need to do that. Only long what is oversold and beaten down.
Ww
=================================================================
Disclaimer
Right. Before anyone starts screaming, crying, or remortgaging their house based on this, calm down. This isn’t financial advice. It’s not advice at all. It’s numbers, history, and a bit of common sense, laid out by someone who can still remember what happened the last time people said “this time is different.”
If you choose to ignore it because a bloke on YouTube with a laser-eyed thumbnail says gold (or Bitcoin, or tulips, or Beanie Babies) is going to the moon, fine. Crack on. That’s natural selection with candlesticks.
Markets don’t care about your fear, your politics, your hashtags, or your “emergency exit” fantasies. Gravity still works. Rubber bands still snap. And charts don’t suddenly develop feelings because the world’s gone a bit mad.
So read it, don’t worship it. Think for yourself. And if it all goes wrong, don’t email me. I’ll be busy not saying “I told you so,” while very much thinking it.

Short trade 📉 MNQH — Sell-Side Sentiment & News Analysis
Date: Thu 29th Jan 2026
Session: London Session AM
Time: 5:30 am
Trade Details
Entry: 26,220.00
Take Profit: 26,106.00 (0.43%)
Stop Loss: 26,229.50 (0.37%)
Risk–Reward: 11.67R
🔴 Directional Bias
Sell-side continuation (intraday corrective leg)
Market sentiment has shifted from expansion to distribution / mean-reversion, with buyers failing to sustain acceptance above prior London highs.
🧠 Market Sentiment Overview
London session pushed price into resting buyside liquidity (LND highs)
Upside attempt failed to hold acceptance
Immediate rejection back below the value indicates seller re-engagement
This is a sell-side response to a liquidity run, not trend failure — a tactical short within a broader bullish regime.https://www.tradingview.com/x/2bCUoXoG/
🧩 Structural Context
Buyside liquidity taken above the prior range
A lower high formed on LTF after the sweep
Bearish displacement back through equilibrium confirms intraday BOS
Structure supports a corrective sell-side leg, not continuation higher.
📊 Volume Profile & Value
Price rejected from the high-volume acceptance zone
Acceptance back below POC confirms bearish intraday auction
Buyers failed to defend value after the sweep
Value rotation is downward, favouring continuation lower.
⏱️ Session Behaviour (London AM)
Asia built the range
London ran high (liquidity grab)
Immediate failure = classic London fake-out
London AM is statistically prone to mean-reversion moves after early sweeps.
📰 News & Macro Context
Risk appetite is cooling after the prior US session strength
Nasdaq sensitive to: Elevated US yields, Ongoing positioning risk after recent expansion
No major bullish macro catalyst during London hours. European hours typically see profit-taking/re-balancing, not fresh risk-on. Macro conditions do not support sustained upside during LND, reinforcing sell-side intent.
🧾 Summary
MNQH shows sell-side sentiment following a London-session buyside liquidity sweep and failure to hold acceptance above value. Rejection from premium and a bearish intraday BOS support continuation toward downside liquidity, with macro conditions favouring mean reversion during LND hours.
⚠️ Invalidation Criteria
Strong bullish displacement reclaiming London highs
Sustained acceptance back above the premium
Failure to follow through in London
In the absence of these, sell-side bias remains valid.

Short trade 📉 BTCUSDT — Sell-Side Sentiment Analysis
Date: Wed 28th Jan 2026
Session: NY → Tokyo Overlap (PM)
Execution TF: 2-Minute
Trade Details
Entry: 89,174.2
Take Profit: 86,637.0 (2.84%)
Stop Loss: 89,449.6 (0.30%)
Risk–Reward: 9.21R
(asymmetric sell-side execution)
🔴 Directional Bias
Sell-side continuation
Market sentiment has transitioned from balance to distribution, with sellers regaining control after a failed upside attempt into liquidity.
🧠 Market Sentiment Overview
Upside attempts into prior highs failed to gain acceptance
Repeated rejection near unmitigated supply shows seller dominance
Buy-side liquidity was induced and absorbed, not expanded
This reflects distribution into strength, not bullish continuation.
🧩 Structural Context
Price formed a local double-top / failure high
Bearish displacement followed, confirming short-term BOS
Market rotated back below value → structure shifted bearish
📊 Volume Profile & Value
High-volume node rejected from above
Acceptance below POC confirms bearish auction conditions
Sellers are active on rallies, buyers are passive on pullbacks
⏱️ Session Behaviour (Why NY → Tokyo Matters)
NY PM engineered the distribution phase
Tokyo overlap often delivers continuation through thin liquidity
Lack of NY reclaim strongly favours downside follow-through
Session timing supports sell-side intent.
🧾 Summary
BTCUSDT shows clear sell-side sentiment following a failed buyside expansion and rejection from the premium. Acceptance below value during the NY–Tokyo overlap supports continuation toward downside liquidity.
⚠️ Invalidation Criteria
Strong bullish displacement reclaiming value
Sustained acceptance above prior highs
Failure to follow through - Tokyo
Until then, sell-side bias remains intact.

RIVER to 70 ? watch out the 50 level The 50 level has become the decisive battleground for bulls attempting to regain control of the broader structure.
Recent price action shows stabilization around this zone, with higher lows forming and selling pressure gradually weakening.
The volume profile highlights 50 as a developing value area, suggesting growing acceptance rather than rejection.
If buyers continue to defend this level and build support, it signals accumulation and a shift in short-term momentum.
Holding above 50 keeps the bullish recovery scenario intact, opening the door for a sustained move higher, with the 70 region standing out as the next major resistance and upside target.

EURNZD: Important Breakout 🇪🇺🇳🇿
EURNZD violated a significant rising trend line on a daily.
It opens up a potential for a further decline.
The next strong support that I see is 1.9646
❤️Please, support my work with like, thank you!❤️
I am part of Trade Nation's Influencer program and receive a monthly fee for using their TradingView charts in my analysis.

Algotrading 1inchusdtPress "Grab this chart", run strategy tester for entire history and make sure that is good time for a long to yellow line.
The same situation was here

XAU/USD 29 January 2026 Intraday AnalysisH4 Analysis:
-> Swing: Bullish.
-> Internal: Bullish.
As per analysis dated 22 January where I mentioned price could potentially continue bullish is how price printed.
CHoCH positioning has again been brought closer to current price action and is denoted with a blue dotted line.
Price is trading within an internal low and fractal high.
Intraday expectation:
Price to print bearish CHoCH to indicate bullish pullback phase initiation. Thereafter price to react at either discount of 50% internal EQ, or H4 supply zone before targeting weak internal high priced at 5,602,225.
Alternative scenario: Price could potentially continue bullish.
Note:
The Federal Reserve’s renewed easing cycle, alongside a weaker U.S. dollar and persistent geopolitical tensions, continues to drive volatility in the gold market.
Traders should remain cautious and adjust risk management strategies to navigate sharp price swings.
Additionally, gold pricing is highly sensitive to U.S. policy under President Trump, where tariff measures, fiscal uncertainty, and shifting geopolitical strategy amplify market repricing risks and reinforce safe‑haven demand.
H4 Chart:
M15 Analysis:
-> Swing: Bullish.
-> Internal: Bullish.
Price has continued to print bullish with very minimal pullback.
You will note price has printed a bullish iBOS, however, due to the insignificant depth of pullback I shall apply discretion and not classify it as such. This is marked in red.
Price is currently contained within an internal low and fractal high.
Intraday expectation:
Allow price to print bearish CHoCH to indicate bearish pullback phase initiation. CHoCH positioning is denoted with a blue horizontal dotted line.
At the current high, and if price prints a bearish CHoCH, price to then trade down to either M15 demand zone, or discount of 50% internal EQ before targeting weak internal high, priced at 5,602.225.
Alternative scenario: Price could potentially continue to print higher.
Note:
Gold continues to exhibit elevated volatility as markets digest the Federal Reserve’s ongoing dovish tilt and persistent global geopolitical tensions.
With uncertainty remaining a dominant theme across global risk assets, traders should prioritise disciplined risk management, as abrupt price swings and liquidity pockets may become increasingly common.
Furthermore, recent tariff announcements from President Trump, particularly those directed at China, have added another layer of instability to the macro landscape. These policy developments have the potential to intensify market turbulence, heighten risk‑off flows, and trigger sharp intraday reversals or whipsaw‑like behaviour in gold.
M15 Chart:

EURJPY Outlook My new area of interest for swing buys. I'll look for lower timeframe confirmation before buying.
Also if price gets to supply line first, then I'll look for sells to swing buys.
Manage risk

NQ: Stalking the 4H SupplyThe Macro Context
We are currently pushing into a significant 4-hour Supply Block. After the recent impulsive moves, the market is approaching a zone where institutional sell orders have historically lived. As a "sponge" to these lessons, I’m not interested in guessing the top—I’m waiting for the market to reveal its hand.
The Execution Plan
I am stalking a short entry with two specific "Hermit" requirements:
The Liquidity Hunt: Ideally, I want to see a wick above the high of this 4H supply zone to sweep out the early shorts.
Price Acceptance: I need to see a 4-hour candle close firmly inside or below the box after that wick. If we get a full candle close above this zone, the trade idea is invalidated and the "Macro Roadmap" gets a rewrite.
The Trigger
Once the 4H rejection is confirmed, I’m dropping down to the 15-minute timeframe to look for a Market Structure Shift to the downside.
No Shift = No Trade. * Patience is a position. We wait for the "handoff" from buyers to sellers to be documented on the tape.

USDJPY DAY TRADING SETUPOn this Pair, We are BULLISH, after a Drastic fall on the JPY INDEX, and a sharp buying momentum on the DXY, Now USDJPY as shown us a sign of strength, breaking previous high, whilst it trend as also shifted to the UPSIDE, we have a refined KEY LEVEL on the 30minutes timeframe we an inducement created, solidifying our entry. this is a 1R - 5.03R, We will give update as price continues to play forward.

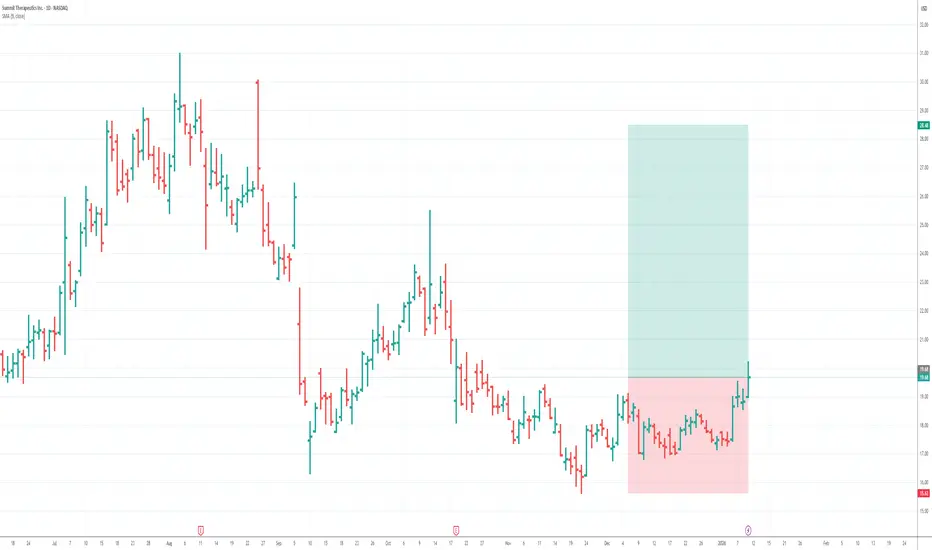
1/9/26 - SMMT: new BUY mechanical trading signal.1/9/26 - SMMT: new BUY signal chosen by a rules based, mechanical trading system.
SMMT - BUY
Stop Loss @ 15.62
Entry BUY @ 19.68
Target Profit @ 28.48
Analysis:
Higher timeframe: Prices have stayed above the lower channel line of the ATR (Average True Range) Keltner Channel and reversed.
Higher timeframe: Victor Sperandeo's (Trader Vic) classic 1-2-3/2B BUY pattern...where the current lowest bottom breakout price is greater or only slightly peaking lower than the preceding bottom price.
Higher timeframe: Price peaked below the ATR (Average True Range) breakout low and then reversed.
123 Quick Learn Trading Tips - Tip #9 Master the Daily BiasSuccessful traders do not follow every small price movement. Instead, they focus on the Daily Candle . The daily candle shows you the overall direction of the market for the entire day. If you cannot clearly see where the price is going on the daily chart, it is better to stay out of the market. 📈
By identifying the daily direction, you can achieve three things:
Reduce Stress: You stop chasing small, confusing price moves.
Find Better Entries: You only look for trades that match the daily trend.
Protect Capital: You avoid trading when the market has no clear direction.
Professional trading is not about being busy every hour. It is about waiting for a setup that is obvious. When the daily direction is clear, your intraday trades become much easier to manage.
" The daily chart is the compass that keeps you from getting lost in the stormy sea of lower timeframes."
Navid Jafarian
Why did the pirate trader refuse to look at the 15-minute chart?
Because he didn't want to get "sea-sick" from all the choppy waves! He only sails for the big treasure! 🏴☠️🌊
Keep your compass on the daily chart and get ready for our next tip on managing your risk!

NB Bullish Multi-Timeframe Swing Trade SetupNASDAQ:NB getting attention lately.
Bull trend is already established.
Strong monthly ADX. Prior 65% advance.
Constructive pullback, holding between rising 50 & 100 day SMAs.
Rounding structure.
Watching for expansion from here.
