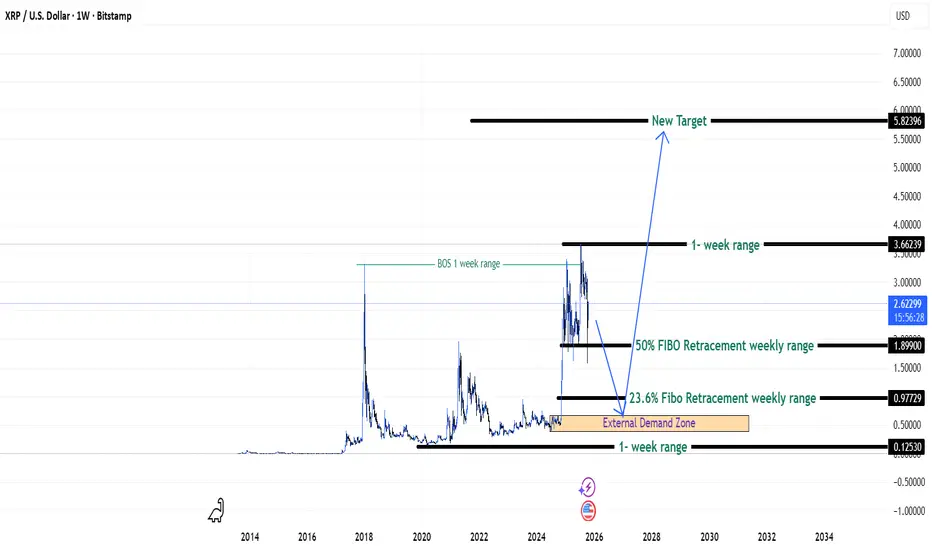
XRP Chasing New Highs - {26/10/2025}Educational Analysis says that XRPUSD or XRPUSDT (Crypto Pair) may give trend Trading opportunities from this range, according to my technical analysis.
Broker - Bitstamp
So, my analysis is based on a top-down approach from weekly to trend range to internal trend range.
So my analysis comprises of two structures: 1) Break of structure on weekly range and 2) Trading Range to fill the remaining fair value gap
Let's see what this Crypto Pair brings to the table for us in the future.
DISCLAIMER:-
This is not an entry signal. THIS IS FOR EDUCATIONAL PURPOSES ONLY.
I HAVE NO CONCERNS WITH YOUR PROFITS OR LOSS,
Happy Trading,
FX Pairs & Crypto Curreny Trade Analysis.
My Analysis is:-
Short term trend may be go to the external demand zone.
Long term trend breaks the new high after going from discount zone.
Multiple Time Frame Analysis
$AKTUSDT ANALYSIS Daily Outlook: Bearish
KUCOIN:AKTUSDT is still Bearish on the daily TF until, the daily high @ $0.857 is taken out.
4HR Outlook: Neutral/Bullish(N/B)
The 4HR TF is showing a N/B. The 4HR supply around $0.694 - $0.7156 was violated thereby creating a temporary switch in structure on the 4HR TF i.e N/B scenario.
ACTION: (SELL TO BUY)
Going down to M30 TF from our HTF a supply zone is identified around $0.78 - $0.796, I'll patiently look for a confirmation entry from the zone to send price down to the M30 OB created from the 4HR TF N/B scenario ( $0.677 - $0.66)
NOTE: Wait for confirmation from both zones before reaction and don't forget to apply proper risk management.

CADCHF Bearish SetupPrice is in strong bearish trend from MN,W1,D timeframes, price broke daily support level at (0.57071 - 0.56977) and retested it potentially forming double top at the zone.

Long trade
4Ht TF
📘 Trade Journal Entry
Pair: BTCUSDC.P (Bitcoin Perpetual Mix Contract)
Direction: Buyside Trade
Date: Sat, 18th Oct 2025
Time: 8.00 AM
Session: London to New York Session AM
Timeframe: 4-Hour
🔹 Trade Details
Entry: 107,571.0
Profit Target: 111,494.0 (+7.22%)
Stop Level: 106,095.5 (–0.88%)
Risk-Reward Ratio (RR): 8.4
🔹 Technical Context
Price rebounded from the Fibonacci 0.75 retracement zone, forming a clean swing low around 107,044 before reversal.
Kaufman Adaptive Moving Average (KAMA) starting to turn upward — confirmation of shifting short-term bias.
RSI is recovering strongly from oversold territory (~30) and now trading above 61, supporting bullish momentum.
Structure shift after consecutive higher-lows — potential CHOCH confirmation and accumulation phase breakout.
The previous range deviation and liquidity sweep below the 0.75 fib provide a solid accumulation context.
1Hr Timeframe (Discount range observed)
🔹 Narrative
This buyside setup forms after extended downside liquidity collection beneath the major swing low. The market structure indicates accumulation and early-stage reversal, supported by RSI divergence and EMA/KAMA realignment. A continuation toward the 111–112K zone remains the primary trajectory unless rejection occurs near 109.8K resistance.

NZDUSD 250 PIPS SELL OPPORTUNITY DEVELOPINGPrice is in strong bearish trend, price broke daily support level at (0.57547 - 0.57719) and retested with weak bull rally as price approached the level. Previous daily Close on Friday was bearish shooting star showing rejection at the level.

ICP @ 9/2023 support. Icp at 9/2023 support. Possible buy zone, if the zone breaks it could go to $1. If the zone holds it could rise dramatically. Trade wisely.

GBPJPY — Eyeing Reaction from 204.00Price swept buy-side liquidity and shifted structure, leaving a refined 15M order block nested inside a 1H breaker and aligned with the 4H bearish flow.
I’m watching that zone for lower-timeframe confirmation to join the next move down.
If the zone holds, it’s a continuation setup. If it breaks, I step aside — no bias, just structure and probability.
Liquidity feeds the patient.

CADCHF — 1H ChartCADCHF — 1H Chart 📉
Price has formed a Double Top at a key level.
If price returns for a retest, I’ll look to sell toward my take-profit target.
🎯 Sell Target → 0.56745
OANDA:CADCHF

NZDCAD SHORT Market structure bearish on HTFs 3
Entry at Both Weekly and Daily AOi
Weekly Rejection at AOi
Previous Weekly Structure Point
Daily Rejection at AOi
Daily Previous Structure Point
Around Psychological Level 0.80500
Touching EMA H4
H4 Candlestick rejection
Rejection from Previous structure
Levels
Entry 120%
REMEMBER : Trading is a Game Of Probability
: Manage Your Risk
: Be Patient
: Every Moment Is Unique
: Rinse, Wash, Repeat!
: Christ is King.

BTCUSDDaily TF looks to have found support around 107,000 and forming a double bottom with neckline around 110,700. There's also a daily support trendline starting last year in September.
On the H4, waiting for both horizontal and resistance trendline to be broken before looking for buys.

EURCAD: Another Trend Line Based Opportunity 🇪🇺🇨🇦
EURCAD may continue rising after a test of a solid
rising trend line on a daily.
A formation of a double bottom pattern accompanied by
a bullish Change of Character on an hourly time frame
indicates a strong buying interest.
Goal - 1.6305
❤️Please, support my work with like, thank you!❤️
I am part of Trade Nation's Influencer program and receive a monthly fee for using their TradingView charts in my analysis.

GBPNZD: Pullback From Trend Line 🇬🇧🇳🇿
GBPNZD may bounce from a strong rising trend line on a daily.
The price formed an inverted head and shoulders after its test
and violated its neckline this morning.
I expect a pullback to 2.3215
❤️Please, support my work with like, thank you!❤️
I am part of Trade Nation's Influencer program and receive a monthly fee for using their TradingView charts in my analysis.

EURUSD: H1 Momentum PlayDaily Timeframe:
Price is now below the EMAs, which is a technical downtrend according to my definition. Although this is weak, the past two days have been inside bars. This tells me there's barely any movement or strength to the upside.
The bar for this latest session will likely engulf the previous bars. If the current session's bar closes below and engulfs the prior session's bar, there's a stronger indication of momentum to the downside.
H1 Timeframe:
The confluence with the daily timeframe is that the current session's bar is likely to engulf the inside bar that occurred over the past two days.
Right now, price is crossing below the EMA band, which we I anticipate momentum to the downside will pick up.
Price has not crossed the daily level, but I'm not too concerned there. On the H1 timeframe, price failed to make a higher high, which further makes me lean towards having a bearish sentiment.

NICU - LONG - Magna Mining - Finally a FOMO releiving pullback. A well-earned pullback after a parabolic Wave 3 run, aligning perfectly with the Q3 production and Levack assay releases. The market read the updates as solid but not spectacular — a case of “good results, high expectations.” Price action tagged the 1.0 Fib extension near 2.57 CAD, right on top of the 50-day SMA, confirming early Wave 4 development inside the 2.35 – 2.65 CAD retracement zone. The 20 EMA has now rolled over to act as short-term resistance around 2.80 CAD, while the 50 SMA rises to provide confluence support beneath. This structure remains fully intact within the bullish Elliott model — a healthy mean reversion rather than trend failure. A daily close back above 2.80 CAD would suggest Wave 4 completion and signal the next advance toward the 3.14–3.30 CAD Wave 5 zone.

GLMRUSDT Macro Downtrend Intact, Key Levels DefinedGLMRUSDT remains in a firm macro downtrend. The key Main Sell-off zone ($2-$2.61) is the primary resistance to watch for any short to mid-term rallies. Until that area is broken, the path of least resistance is down. The Area of Interest for a potential long-term bottom lies between $0.0.0219 to $0.039 watch for a confirmed bullish reversal there. A break below $0.0185 signals a continuation of the downtrend.

GBP/JPY Support Flip in ActionLong-term vibe (2W chart):
GBP/JPY's been cursing upwards since 2020, riding that strong support line. It's like the pair's got a safety net, and as long as it holds above this line, the trend's buddy-buddy with the bulls.
Short-term play (1D chart):
Check it, on the daily chart, GBP/JPY broke above a key resistance zone, and now that level turn into support. It's like getting a green light for a potential push higher. We're chillin' around the 203-204 zone now, if this holds, we're prob looking at higher targets.
Putting it together:
Long-term trend's up, and short-term breakout saying "hey, maybe more upside". If GBP/JPY hangs out above 203-204, bulls might keep pushing it higher.
DYOR, NFA
Thanks for reading! Appreciate your support and engagement 🙏

GBPUSD SHORT Market structure bearish on HTFs 3
Entry at both Daily and Weekly AOi
Weekly Rejection at AOi
Daily Rejection at AOi
Daily EMA retest
Previous Structure point Daily
Around Psychological Level 1.34500
H4 Candlestick rejection
Rejection from Previous structure
Levels
Entry 110%
REMEMBER : Trading is a Game Of Probability
: Manage Your Risk
: Be Patient
: Every Moment Is Unique
: Rinse, Wash, Repeat!
: Christ is King.

CADJPY LONGMarket structure bullish on HTFs DW
Entry at both Weekly and Daily AOi
Weekly Rejection at AOi
Daily Rejection at AOi
Daily Previous Structure Point
Touching EMA Daily
Around Psychological Level 107.000
H4 Candlestick rejection
Levels 90%
REMEMBER : Trading is a Game Of Probability
: Manage Your Risk
: Be Patient
: Every Moment Is Unique
: Rinse, Wash, Repeat!
: Christ is King.


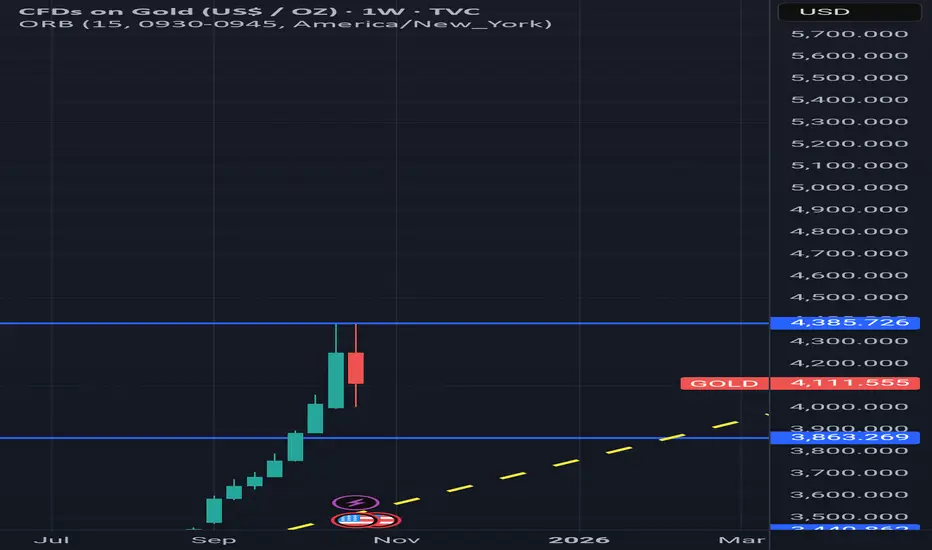
XAU/USD 23 October 2025 Intraday AnalysisH4 Analysis:
-> Swing: Bullish.
-> Internal: Bullish.
Analysis and bias remains the same as analysis dated 20 October 2025.
Price has printed as per previous intraday expectation by printing a bearish CHoCH which indicates, but not confirms, bullish pullback phase initiation.
Price is currently trading within an established internal range, however, I will continue to monitor price with regards to depth of pullback.
Intraday expectation:
Price to continue bearish, react at either discount of 50% internal EQ, or H4 supply zone before targeting weak internal high priced at 4,380. 990.
Note:
The Federal Reserve’s sustained dovish stance, coupled with ongoing geopolitical uncertainties, is likely to prolong heightened volatility in the gold market. Given this elevated risk environment, traders should exercise caution and recalibrate risk management strategies to navigate potential price fluctuations effectively.
Additionally, gold pricing remains sensitive to broader macroeconomic developments, including policy decisions under President Trump. Shifts in geopolitical strategy and economic directives could further amplify uncertainty, contributing to market repricing dynamics.
H4 Chart:
M15 Analysis:
-> Swing: Bullish.
-> Internal: Bearish.
Analysis and bias remains the same as yesterday's analysis dated 22 October 2025.
Price has printed according to my analysis dated 20 October 2025 where I mention that price is to continue bullish, react at either premium of 50% internal EQ, or M15 demand zone, before targeting weak internal low priced at 4,185.910.
Price has printed a bearish iBOS and subsequently a bullish CHoCH to indicate, but not confirm bullish pullback phase initiation.
Price is now trading within an established internal range.
Intraday expectation:
Price to react at either premium of 50% internal EQ, or M15 demand zone, before targeting weak internal low priced at 4,004.280.
Note:
Gold remains highly volatile amid the Federal Reserve's continued dovish stance, persistent and escalating geopolitical uncertainties. Traders should implement robust risk management strategies and remain vigilant, as price swings may become more pronounced in this elevated volatility environment.
Additionally, President Trump’s tariff announcements, particularly against China, are expected to further amplify market turbulence, potentially triggering sharp price fluctuations and whipsaws.
M15 Chart:

Gold finally has a supply range! Time for bullish correction?I talked about everything but the obvious inverse head and shoulders/Quasimodo forming the right shoulder now. If everything goes right can we expect an arm to extend upwards here during the stochastic buy cycle?
Let me know what you think and be sure to share and care for others if you found this helpful.
Also talked about the "REAPER WARNING" as we have a reaper inversion range actively terrorizing price 🧩

Gold buyers showing signs of activityHi traders and investors!
This analysis is based on the Initiative Analysis (IA) concept.
Daily Timeframe
We can see that volume is starting to appear from the buyer zone located at the base of the last buyer initiative.
Yesterday’s seller activity didn’t bring any visible result — the candle closed inside the previous one.
Still, this leaves hope that there is a buyer active in this area, and we may soon see a move from their side.
1-hour timeframe
On the 1-hour timeframe, a sideways range has formed.
The buyer initiative currently has a target at 4127 — let’s watch how this movement develops.
Inside this initiative, we now have a key seller bar - IC on the chart, which was absorbed by the buyer.
There has already been a first attempt of a rebound from this buyer zone, and it’s currently unfolding. We’ll see how it plays out.
If the first attempt fails, we can look for local long opportunities from the support level around 4065 or 4004.
Wishing you profitable trades!
