Mtfanalysis
XAUUSD 1H — Bearish Structure Meets 5000 POC Magnet🔍 Gold Spot (XAUUSD) — 1H SMC + Volume Profile Analysis | Mar 9, 2026
Price is at 5,098.55 — sitting inside a Discount Zone with
BOTH swing and internal structure aligned BEARISH. Yet the
MTF is split 2/2 and a major Volume POC sits just below at
5,000. This is the key battleground right now.
━━━━━━━━━━━━━━━━━━━━━━━━━━━
📊 THE CURRENT LEVELS
━━━━━━━━━━━━━━━━━━━━━━━━━━━
🔴 Bearish OB Zone 1: 5,380–5,440 (origin of the drop)
🔴 Bearish OB Zone 2: 5,160–5,200 (last rejection area)
📍 Current Pri
XShort
STRONG Trend - A “Severity Tag” That Helps You Rank TrendSTRONG Trend - A “Severity Tag” That Helps You Rank Trend Conditions (Not Just Detect Them)
Not all TREND regimes are equal. Some trends are fragile and easily chopped up.
Others are persistent, directional, and more “playable.”
AG Pro Trend Quality supports a STRONG severity concept:
- When the regime is TREND and the score clears a higher bar (Threshold + Strong Offset),
the script can display a STRONG tag.
- Optionally, STRONG can require HTF to be STRONG as well (more conservative).
Why
MTF Confirmation - Why “HTF Blocked” Can Save YouMTF Confirmation - Why “HTF Blocked” Can Save You from the Worst Trades
One of the most common trading mistakes is acting on a lower-timeframe trend that is actually moving against a higher-timeframe environment.
It often looks like this:
- LTF turns TREND → you enter
- HTF remains CHOP/defensive → price stalls, whipsaws, or reverses
- You blame the entry, but the real issue was context mismatch
AG Pro Trend Quality includes a practical MTF confirmation option:
- LTF computes its own score/re
MTF Trendlines - Why Lower TF “Noise” Often Reacts to Higher TFMTF Trendlines - Why Lower TF “Noise” Often Reacts to Higher TF Diagonals
If you trade lower timeframes, you’ve seen this:
A local diagonal breaks… then price snaps back as if “someone defended it.”
Often, the “defense” is simply higher timeframe structure.
This script supports multi-timeframe (MTF) context so you can compare:
- Local diagonals (execution context)
- Higher timeframe diagonals (bias context)
A clean top-down workflow:
1) Choose a higher timeframe for structure clarity (e.g.,
NASDAQ 1H - Recovering From 22,300 Lows, Bear OB at 23K Is Test🔍 NASDAQ COMPOSITE — 1H SMC Analysis | Feb 23, 2026
Monday Market Outlook | US Market Opens Today
Price is at 22,886 — bouncing strongly from the
22,300 lows. But before bulls get excited, there
is a major Bear OB sitting just 114 points above.
This week's direction gets decided right here.
━━━━━━━━━━━━━━━━━━━━━━━━━━━
📊 WHAT HAPPENED — THE FULL STORY
━━━━━━━━━━━━━━━━━━━━━━━━━━━
From the 23,900 Strong High, NASDAQ printed a
textbook Smart Money distribution:
→ CHoCH confirmed bearish at the t
BITCOIN 1H - 2/2 MTF Split at 0.5 Fib | Premium Zone De Point🔍 BITCOIN / USD — 1H SMC Analysis | Feb 21, 2026
Price is at 68,147 — sitting at a textbook decision point.
The 0.5 Fibonacci retracement from the 71,000 high to the
65,000 low. This is equilibrium of the entire move. What
happens here decides the next 2,000+ point direction.
━━━━━━━━━━━━━━━━━━━━━━━━━━━
📊 STRUCTURE READING
━━━━━━━━━━━━━━━━━━━━━━━━━━━
Swing Bias → BEARISH
Internal Bias → BULLISH
Confluence → MIXED ⚠️
The swing structure broke bearish from the 71,000 top —
multiple be
GOLD 1H - Premium Zone Warning | MTF Bull But Money Trap Ahead?🔍 GOLD SPOT — 1H SMC Analysis | Feb 20, 2026
Price is currently trading at 5,027 — sitting deep inside the
Premium Zone. This is the area where smart money historically
distributes, not accumulates. Let me break down exactly what
the structure is telling us right now.
━━━━━━━━━━━━━━━━━━━━━━━━━━━
📊 STRUCTURE READING
━━━━━━━━━━━━━━━━━━━━━━━━━━━
Swing Bias → BEARISH (swing high around 5,060 not yet broken)
Internal Bias → BULLISH (internal structure has been pushing up)
Confluence → MIXED ⚠️
X
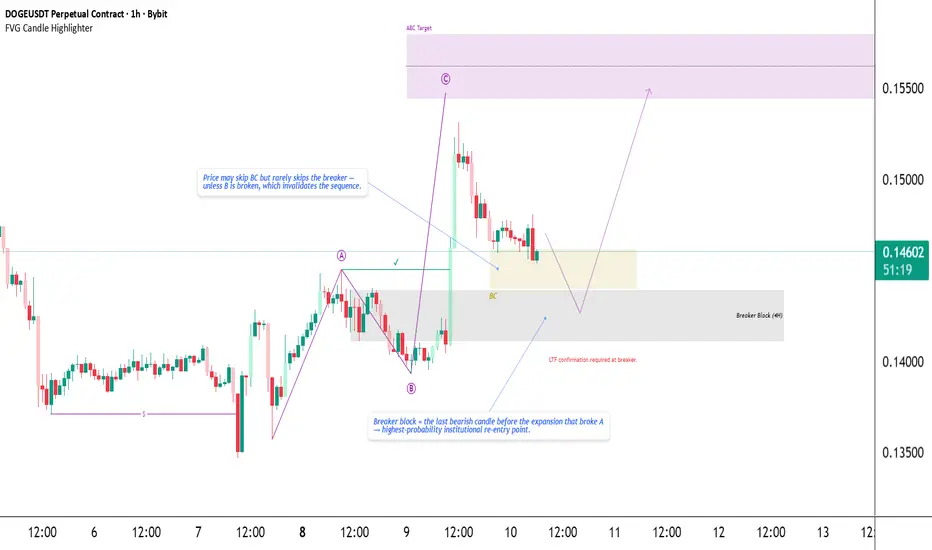
DOGE — SK Structure Breaker Block Re-Entry Toward C-TargetDOGE has completed a clean SK bullish sequence :
• A → B → C , with C breaking above A and confirming bullish intent.
• This expansion created two important reaction zones:
— BC zone → structural strength (broader discount area)
— Breaker Block → precision re-entry (highest probability)
From testing across assets, price may skip BC entirely, but it almost always respects the breaker block , as long as swing B remains protected.
➡️ If B breaks, the sequence is invalid.
Trade Plan
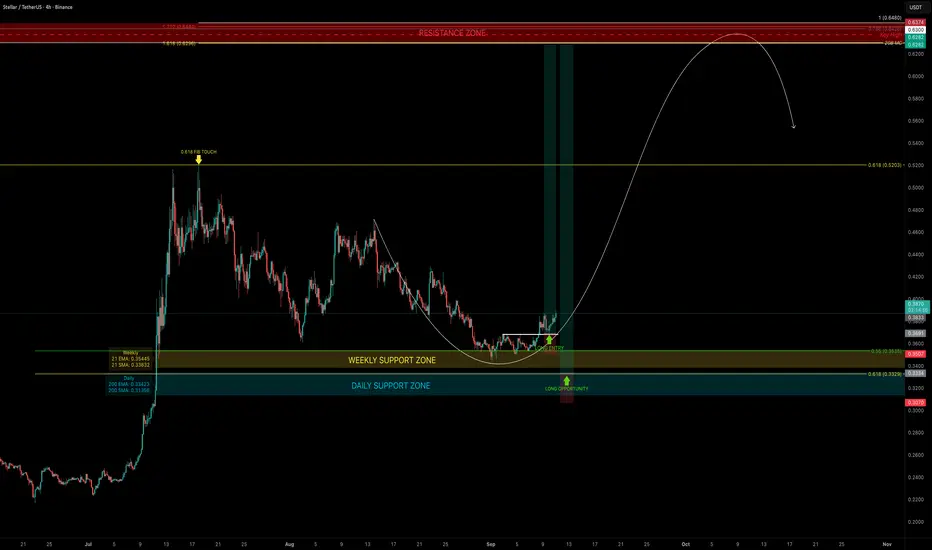
XLM — Correction Ending, Rally Loading?XLM recently found support at the 0.55 Fib retracement, in confluence with the 21 EMA/SMA on the weekly timeframe, triggering a bounce. The ideal 0.618 long entry unfortunately did not come into play.
Support Confluence
21 EMA (weekly): $0.3536
21 SMA (weekly): $0.3384
200 EMA (daily): $0.33425
200 SMA (daily): $0.3136
This cluster around $0.35–$0.31 forms a strong dynamic support zone and a great range for DCA laddering.
Resistance Confluence (Take Profit Zone $0.63–$0.65)
20B
How to Set Up Multi-Timeframe Analysis (MTF) in TradingViewThis tutorial video explains what a time frame is, why traders use multiple time frames for their analysis, and how to set them up in TradingView for futures and other products.
Disclaimer:
There is a substantial risk of loss in futures trading. Past performance is not indicative of future results. Please trade only with risk capital. We are not responsible for any third-party links, comments, or content shared on TradingView. Any opinions, links, or messages posted by users on TradingView do n
Multi-Timeframe XGBoost Approximation Templatewww.tradingview.com
Template Name:XGBoost Approx
Core Idea: This strategy attempts to mimic the output of an XGBoost model (a powerful machine learning algorithm) by combining several common technical indicators with the Rate of Change (ROC) , MACD, RSI and EMA across multiple timeframes. It uses a weighted sum of normalized indicators to generate a "composite indicator," and trades based on this indicator crossing predefined thresholds. The multi-timeframe ROC acts as a trend filter.
Key Fea
Amazon: Riding the E-Commerce and Cloud WaveAmazon is currently showing promising signs as it forms the right side of its base, presenting an excellent setup for long-term investors. With strong revenue streams from e-commerce and Amazon Web Services (AWS), the company remains a dominant force in multiple sectors. This diverse business model positions Amazon for sustained growth, even amid market fluctuations.
Technical Overview:
Recent price action shows Amazon bouncing off a strong support level around $182.38 , with its 21-day EMA
AAPL: About to shift the trend! (D & H chartts)Daily Chart (Left)
Head and Shoulders (H&S) Pattern: A potential Head and Shoulders pattern is forming on the daily chart, with a neckline around the $221.33 level. If this pattern completes and the price breaks below the neckline, it could indicate a bearish reversal, signaling further downside.
Pivot Point: The pivot point at $228.66 is acting as a near-term resistance level. A break above this level could invalidate the H&S pattern, leading to a continuation of the uptrend.
21-Da
TSLA: Insanely Bullish! What to Expect Next? | D & W charts.In our previous analysis, we identified that TSLA was looking for its 21-week EMA, a classic region of support, where a very good reversal signal materialized.
Now, the price has resumed its previous uptrend, and we see it breaking through the most crucial resistance point at $265, which we also warned about in our last public study, the link to which is below this post.
Now, let's update you on the key points to keep an eye on.
Daily Chart (Left)
Gap Closure: Tesla has closed a signific
AAPL: Reacting Above a Critical Support Level (D&W Charts).Daily Chart (Left)
ATH Resistance: The daily chart indicates a potential double top pattern near the all-time high (ATH) at around $237.23, signaling a possible resistance zone that could lead to a bearish reversal if not breached in the next few weeks.
Mid-Term Support: The $221.33 level is acting as a mid-term support. A break below this level could imply further downside potential reversing the long-term trend, while a hold above could suggest consolidation or a reversal attempt to
SPY: Watch Out For These Turning Points (D&W Charts).Daily Chart (Left)
Resistance and Support Levels : Both $574 and $565 have served as support and resistance points in the past, and are good examples of how the Principle of Polarity works in technical analysis - when broken, support points become resistance points, and vice versa. At the moment, SPY is struggling near $574, its current resistance, which is very close to the 21-day EMA. If it fails to break it, $565 is its next stop.
EMA and Price Action : The price has recently t
QQQ: A Rally Towards the ATH!Daily Chart (Left):
Resistance at $503.52: The price is approaching a key resistance zone around $503.52, the ATH, which may serve as a potential reversal area. A breakout above this could signal more bullish momentum.
Support at $493.15: There is immediate support at $493.15, where price action has consolidated briefly. This level might act as a pivot zone, where buyers could step in if there’s a pullback.
Momentum: The price is above the 21-day EMA, which is rising, indicating the
NIO: Losing a Critical Support Level!Daily Chart (Left):
Resistance at $6.05: The price lost the $6.05 level, which was previously acting as support along with the 21-day EMA. This rejection led to the current bearish momentum.
Support Level at $4.97: After failing to hold $6.05, the stock is likely to retest the $4.97 support level. A break below this could signal further downside momentum.
Downward Momentum: The 21-day EMA is curving downward, suggesting increased selling pressure. The bearish candle confirms a rejec
PLTR: Watch out for these turning points! (D&W charts)PLTR broke through the resistance at $38 that we warned about in our last study, triggering another bullish continuation pattern. It has also broken through an important resistance on the weekly chart, which further reinforces the bullish bias.
Now we have to update the main turning points to keep an eye on over the next few days. The link to our previous study is below this post, as usual.
Daily Chart (Left):
Higher Highs and Higher Lows: The price structure on the daily chart shows a co
P
NAS100 (OCTOBER 2024)New ALL TIME HIGH in the near future for NAS100???
While the possibility of a new All Time High and a push up further up for NAS100 is foreseeable. We have to keep in mind that there is a strong resistance level (0.618 shown) that has been holding its ground, to say the least.
October could set the tone for the remainder of the year, if it could go above and close the month off above that 0.618 level ($20 163.90). Should that happen, we could see a nice bull run to very nice and new highs for
TSLA: Insanely Bullish - Next Key Points to Watch.In our last TSLA analysis we warned about resistance at $233 and that a breakout would take us to the next target at $245 to close the gap. Now, two weeks later, our target has not only been reached, but broken.
So I'll update you on the next key points to keep an eye on. Our last public TSLA study was done two weeks ago here on TradingView, and the link to it is below this post.
Daily Chart (Left):
Resistance at $265.13: The price is climbing toward the resistance at $265.13, which is a
TSLA: Dangerous Price Action - Next Key Points to Watch.The daily chart displays a recent challenge at the main mid-term resistance level around $233.09, where the stock has struggled to maintain upward momentum, marking this as a significant resistance zone, which was a previous support level, another example of the Principle of Polarity in Technical Analaysis.
This resistance, coupled with multiple rejections at this level, suggests a strong overhead supply that could cap further price advances in the short term. What's more, this resistance area
SMCI: The Next Major Inflection Point! (D&W charts)On the daily chart, the stock experienced a notable downward breakout, moving sharply below a confluence of trendlines that had previously served as support. This breakout is significant as it suggests a strong bearish momentum, possibly indicating a shift in investor sentiment. The price is below the 21-day EMA, and there is no bottom signal on it yet.
In our previous public SMCI analysis, I warned you about this trend line, as a downwards breakout would frustrate any possibility of a bullish