Predictions and analysis
I know this would be a crazy move and I have no clue what would cause it, but the chart says that this is a possibility. As you can see, the chart has formed a H&S pattern and is breaking down. If you take the length of the pattern and extend it down past the breakdown, you get a price target of sub $2. Maybe this is a move that plays out like oil did in 2020?
$NGAS - Heading to our Target! What a prediction! Nailed this drop in Natural Gas. Europe and its its coin: The Euro, have been eating the fruits of this sudden drop. I expect support to come in very soon, after that I think #NaturalGas will start to play a smaller role.
$NGAS - HOW WILL EUROPE REACT? DOWNTREND STRONG.... Gas price is coming home. $3.00 is not too far away. But how will the European government react? It seems like they want to keep the consumer price high. #NaturalGas
$NGAS - Is the Gas Crisis Over? (SHORT) With the Economy slowing, a variety of commodities are showing weakness, think about $OIL and $COPPER. $NGAS is still retesting this channel breakdown. I'm looking for shorts in this area as the potential rewards are huge. The war in Ukraine may be coming to an end, and this could have an impact on the price of natural...
The gas currently faces a very strong resistance zone and has formed us DOUBLE TOP and start to come down very, very strong
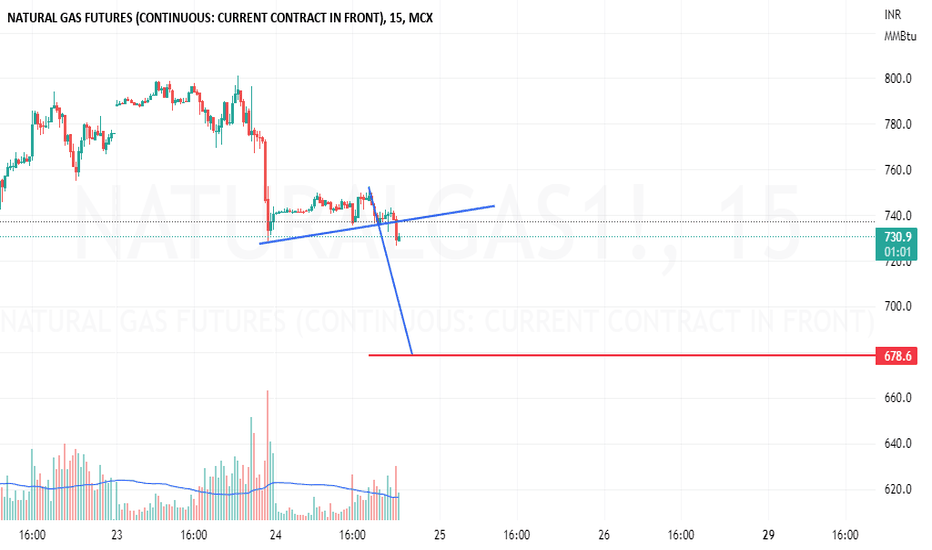
bear flag and its target for downside.before that as per wave it should go slight up hen fall like a knife...
Hello Traders! Check Related Idea for market context!! Looks like the structure will break the low, and then we can look for bullish clues to buy. I will update my idea as the trade progresses if any changes occur and my analysis is wrong, or need to be adapted to the new development of price-action. Thanks for the...
Hello Traders! Check Related Idea for market context!! I will update my idea as the trade progresses if any changes occur and my analysis is wrong, or need to be adapted to the new development of price-action. Thanks for the...
Hi again traders. If you trade natural gas you might wanna short it. On the daily time frame the main trend is down. The 50 moving average is acting as resistance and price happen to be at a level of structure. Do I think price will break through the ichimoku cloud? No, sometimes the cloud can act as a powerful resistance or support as we see in this case I...
This is An update, As I said Market will Star change direction this morning Don't Buy market today or tomorow and wait.., So my advice was Only short market below 2.38 SO our prediction was right, and market now at 2.35 Mathematically only Sell hard below 2.39 retrace. first target 2.30 second target 2.175 Good luck
Currently, Gas (NG) Moving sideways range and expecting more downside towards multi Year Support 1.480$ where we can some small correction upside. Alternative due to summer now demand level very low. 🛑SUPPORT/RESISTANCE ✅S1= 1.645 ✅S2=1.510 ✴️R1=1.725 ✴️R2=1.945 Please like, share, comments and follow me to get daily base analysis Thank you for your support, I...
TREND Still Downside towards major support level 1.520. Last week NG Break Fake as we mentioned previous analysis. We hit our 1st target and next target 150 points more downside. 🛑SUPPORT/RESISTANCE ✅S1= 1.700 ✅S2=1.520 ✴️R1=1.800 ✴️R2=2.100 Please like, share, comments and follow me to get daily base analysis Thank you for your support, I appreciate it.
NGAS in the descending channel Targets in the chart Best of luck
gap down fill to 2.96 by monday,falling from this price will be horrible. then afterwards filling the gap at 3.22


