Is NVIDIA showing signs of a potential momentum shift?Is NVIDIA starting to shift momentum after a strong uptrend since October 2022?
There’s a possibility of a retest toward $88 if price fails to break out above the $180 range.
Volume continues to decline, suggesting weakening participation. Only time will tell.
NVDA

Nvidia - The -25% correction starts now!✂️Nvidia ( NASDAQ:NVDA ) is about to create a correction:
🔎Analysis summary:
After Nvidia retested major support in mid 2025, we saw another rally of about +125%. But now, Nvidia is rejecting a major resistance trendline and is about to create bearish confirmation. Quite likely that Nvidia will create a major -25% correction in the future.
📝Levels to watch:
$140
SwingTraderPhil
SwingTrading.Simplified. | Investing.Simplified. | #LONGTERMVISION

Is NVIDIA’s AI Boom Hitting a Wall?NVIDIA is the engine behind the global AI boom. From data centers to gaming and high-performance computing, its chips power the most advanced technology on the planet. Over the last two years, NVDA became the market’s biggest winner. Now, it has suddenly slowed down, and investors are asking why.
The stock is down about 12 percent from its all-time high of 212 dollars and closed at 186.23 dollars on January 27, 2026. Even after the pullback, NVIDIA is valued at an eye-watering 4.53 trillion dollars and trades at a P/E ratio of 46. That valuation assumes near-perfect execution, and the market is no longer willing to blindly chase it. After one of the strongest rallies in tech history, NVDA has spent months moving sideways. On the chart, the price is trapped inside a symmetrical triangle, a classic sign of indecision. It is not breaking higher, and it is not breaking lower. Everyone is waiting for something to give.
The biggest reason for this pause is geopolitical, not technical. NVIDIA appeared to secure a massive win with reported orders for more than two million H200 chips from Chinese tech companies, potentially worth around 54 billion dollars. At roughly 27,000 dollars per chip, this deal could have pushed the stock into a new valuation zone. But reality hit fast. Chinese customs blocked H200 shipments just days after the U.S. approved exports under a 25 percent tariff. According to industry sources, the message from Beijing was severe enough to feel like a temporary ban. NVIDIA’s suppliers have already slowed production, and that massive opportunity could disappear almost overnight.
Even if China eventually allows the chips, the math is no longer attractive. A 25 percent tariff means NVIDIA would lose a large chunk of revenue to the U.S. government. Higher prices also make Chinese buyers less enthusiastic, especially as Beijing pushes companies toward domestic alternatives from players like Huawei. This situation risks accelerating China’s long-term shift away from U.S. technology, threatening a market worth tens of billions of dollars every year.
Despite these risks, Wall Street remains optimistic. Analysts still rate NVDA a Strong Buy, with an average price target near 259 dollars, implying roughly 36 percent upside. Some firms, including Evercore ISI, see far higher levels if execution stays flawless. Confidence was also reinforced after CEO Jensen Huang called AI the largest infrastructure buildout in human history and backed that view with a 2 billion dollar investment in CoreWeave to expand AI data centers.
The outlook is clear but tense. NVIDIA is not broken. It is dominant, expensive, and stuck between massive opportunity and serious geopolitical risk. The long consolidation suggests the next move could be powerful. Whether it breaks higher or resets lower will depend less on charts and more on politics, pricing, and how much perfection the market is still willing to pay for.

Stock Market Forecast | BTC TSLA NVDA AAPL AMZN META MSFTStock Market Forecast | CRYPTOCAP:BTC TSLA NVDA AAPL AMZN META MSFT
SP:SPX CME_MINI:ES1! CME_MINI:NQ1!
Weekly stock market analysis covering the S&P 500 (SPY), Nasdaq 100 (QQQ), Bitcoin (BTC), and major large-cap stocks. In this video, we break down technical charts, key support and resistance levels, sector rotation, market sentiment, dark pool activity, earnings, and macroeconomic data to identify high-probability market scenarios for the week ahead.
Timestamps are included below so you can jump directly to specific tickers and chart analysis.
0:00 Intro & Market Overview
0:58 Sector & Sentiment Data
2:10 MAG 7 ETF / Dark Pools
5:12 ARK / Innovation & Small Caps
6:34 Earnings & Economic Calendar
8:44 S&P 500 (SPY)
12:12 Nasdaq 100 (QQQ)
15:22 Bitcoin (BTC)
22:15 Tesla (TSLA)
25:00 Meta (META)
26:30 Amazon (AMZN)
28:00 Microsoft (MSFT)
32:58 Google (GOOGL)
36:27 Apple (AAPL)
39:38 Nvidia (NVDA)
42:40 Outro

$TSLA Earnings Surprise? Sub $400 perhapsWell... Hope everyone has been good since I've last seen everyone. I'm doing alright, thanks for asking. Had my first profitable year trading options and it feels fantastic. With that said, lets start the new year with a bang! I've got this bar pattern here, a direct bearish match. Invalidation with a close above the gap at $475. Any close below the gap fill will be considered bearish into Earnings where the pattern matches up for a mean drop sub $400 by the end of the first week of February. I'll be looking forward to catching this $70 move if possible.

The end of the NVDA run. Back below $100 incomingNVDA has had a great run over the last few years, but now that run looks to be coming to an end.
As you can see from the chart, we've tested the upper resistance and have now formed a head and shoulders top. If/once price breaks below the blue trend line, that should signify the end of the run for NVDA.
I think price is likely to go back to revisit the lower supports back down at $66-77.
Let's see what happens over the coming months.

NVDA may go bull during the market openHi,
If you know me you know i like to offer context.
Notice how price is making higher lows from below, while the highs are descending from above. These types of structures often result in aggressive price expansions with strong liquidity.
As we zoom in, we can see that price continues to climb and hold its structure, and the current 4-hour candle seems to suggest bullish intent. From a structural perspective, price is now above all the 200 EMAs, and above us we have sell-side order blocks acting like a magnet for price.
Since price has already moved significantly away from yesterday’s close and open, there is a high probability that price attempts to reach the 190.43 level.
Personally, I’ll wait to see how price behaves at the market open and what happens around the 186.89 zone, which so far appears to be holding.
At this moment, NVDA seems to be defending the 186.38 level, where liquidity was recently swept. Price remains above all 200 EMAs and shows no clear intention of mitigating the FVG left earlier.

NVIDIA – Head & Shoulders Forming | Trade Setup InsideNVIDIA NASDAQ:NVDA has been a market leader in AI and semiconductors, posting record revenue and earnings in recent quarters. Strong demand from data centers and enterprise AI continues to drive top-line growth. However, valuation remains elevated, and macro risks—especially around tariffs—are resurfacing.
🔍 On the chart, a Head & Shoulders pattern appears to be forming, signaling a potential reversal. If tariff-driven volatility picks up, a breakdown toward the $162–$163 support zone is possible. This level could offer a short-term bounce or signal deeper weakness depending on confirmation.
📊 Trade Setup:
Entry: $162–$163 (support zone)
Take Profit: $174, then $184
Stop Loss: $156
Long-term fundamentals remain strong, but technical caution is warranted here. Watch the neckline and macro headlines for clues on next moves.

Nvidia - This stock remains quite weak!🔮Nvidia ( NASDAQ:NVDA ) could still drop about -20%:
🔎Analysis summary:
While the entire stock market is heading for new all time highs, Nvidia is still consolidating. Considering the recent retest of the major resistance trendline, Nvidia remains quite weak. Maybe we will even see a short term -20% drop in the near future.
📝Levels to watch:
$150
SwingTraderPhil
SwingTrading.Simplified. | Investing.Simplified. | #LONGTERMVISION

TSLA D1 Institutional Buy/Sell Levels by ProjectSyndicate 🔱 TSLA DAILY SNAPSHOT — EXECUTIVE SUMMARY (NEW WEEK | JAN 2026)
✨ Dip-accumulation reversal setup is the focus — but upside is capped until overhead sell-side is cleared
🧲 Fresh overhead sell-side liquidity / fresh supply: 495 plus key level 460
📌 Context: price is range-bound between fresh supply 495 and fresh demand 300 → institutional levels define the map
🧲 Bull FVG + preferred reversal zone: 365 USD = best area to scale into longs (360–380)
🛡 Failure zone / risk-off trigger: loss of 340 opens downside to 300 fresh demand
🎯 Bull target: 495 fresh supply pocket overhead
🏦 Core play: accumulate on dips at/near 360/380, manage risk if 340 fails, take profit into 495
🗳️ TSLA Daily Scenarios — What’s Your Play?
Which path do you have for TSLA next week?
🅰️ Hold 360–380 → reversal works → reclaim 420 → rotation into 460
🅱️ Sweep below 360 → reclaim 365 FVG → squeeze into 420 → 460
🅲 Drive into 460 → stall/reject → pullback toward 420 → 380
🅳 Break/hold below 340 → weakness confirms → downside opens to 300
Your key levels: 460 / 420 / 380 / 340
Your FVGs: 365 (bulls)
Your fresh zones: 495 supply / 300 demand
Plot same levels on your TSLA chart with
Supply Demand Zones PRO | ProjectSyndicate

Nvidia: Downward PressureSince the end of last week, Nvidia has been facing increasing downward pressure. Our primary scenario, however, calls for a recovery and suggests that the stock should complete the green wave closer to but still below the resistance at $212.16. The subsequent wave should then finalize the larger correction of the beige wave IV above the support at $145.50. Afterward, we expect robust gains into our red Target Zone between $227.38 and $260.60, where the major uptrend of the lime-green wave is likely to conclude. Nonetheless, there's a 33% chance that NVDA already completed wave alt. at $212.16. In this case, the next move would dip below the $145.50 support.

NVDA mid-term TANvidia is in consolidation phase, the long-term uptrend is still intact, this could be a great area to buy, though the indicators are still struggling to turn around and continue the uptrend but they are not strictly bearish as some of the other stocks in this sector but rather lightly bullish. Weekly volumes remain bullish, let's keep an eye on Nvidia.

CoreWeave: The Trump-Backed AI Power PlayPresidential portfolios rarely scream "growth stock," but recent financial disclosures change the narrative. Donald Trump purchased over $50 million in corporate bonds, including debt from AI infrastructure unicorn CoreWeave (CRWV). This move places the GPU cloud provider alongside established industrial titans. Investors must now decide if this political endorsement aligns with fundamental value.
Geopolitics and Geostrategy
The executive branch views Artificial Intelligence as a sovereign asset. CoreWeave’s infrastructure directly supports U.S. dominance in the global AI arms race. By financing domestic GPU capabilities, the administration signals a strategic pivot away from foreign reliance. This investment acts as a tacit endorsement of CoreWeave’s role in national security. The company is no longer just a cloud provider; it is a critical national infrastructure.
Business Models and Economics
CoreWeave rejects the speculative excesses of the dot-com era. Management utilizes a disciplined "take-or-pay" revenue model. They only deploy capital expenditure after signing five-year customer contracts. These agreements cover infrastructure costs and debt service immediately. This strategy reduced financing costs significantly, securing recent funding at highly competitive rates. The company builds to meet existing demand, not anticipated hype.
Industry Trends and Financials
The financial data reveals explosive momentum. Third-quarter revenue hit $1.4 billion, a staggering 134% year-over-year increase. The revenue backlog swelled to $55 billion, nearly quadrupling since the year began. This backlog confirms that demand for high-performance computing far outstrips supply. Unlike legacy cloud providers, CoreWeave offers pure-play AI exposure.
Technology and Innovation
Hardware is useless without intelligent orchestration. CoreWeave’s proprietary software, "Mission Control," serves as its technological moat. This layer autonomously manages operations to maximize performance and extend GPU lifespan. Industry experts awarded CoreWeave the exclusive Platinum ClusterMAX ranking twice. No other cloud provider holds this distinction. This technical superiority drives customer retention, evidenced by early contract renewals at near-original prices.
Management and Leadership
Executive leadership actively mitigates concentration risk. At the start of 2025, a single customer held 85% of the backlog. Today, no client exceeds 35%. Furthermore, over 60% of this backlog now comes from investment-grade entities. Management proved their transparency by lowering 2025 guidance due to third-party construction delays. They prioritized realistic communication over inflating short-term expectations.
Macroeconomics and Future Outlook
The macroeconomic environment favors infrastructure builders. Forecasts suggest revenue will skyrocket to $29 billion by 2028. Adjusted earnings per share could swing from a loss to $4.51 in the same period. If the stock trades at a reasonable 35x forward earnings, CRWV offers over 55% upside. The market consensus rates the stock a "Strong Buy" with a $124.70 price target.
Conclusion
CoreWeave combines political tailwinds with elite technical execution. The Trump debt purchase validates the company's stability. However, the $55 billion backlog serves as the true buy signal. For investors seeking direct exposure to the engine room of the AI economy, CoreWeave represents a high-conviction opportunity.

NVDA cycle top?Time, price, and reflexivity at an inflection.
I’ve grown to distrust the perma-bear instinct to short strength. In most cases, it’s a fast track to underperformance and poverty. That said, ignoring time-price symmetry and macro context is equally dangerous. Both matter here.
NVDA appears to be operating on a remarkably consistent time-based cycle, almost script-like in nature. 2018–2021: ~1,094 days, ~10x return, cycle peak. 2022–2025: ~1,094 days, ~18x return, current phase.
We are now late in that second window.
Thesis: The "Circular Revenue" Red Flag (Fundamental Decay)
As of January 2026, NVDA’s Accounts Receivable has ballooned to over $33 Billion (up from just $8B two years ago).
They are shipping Blackwell chips, but the cash isn't hitting the bank yet. They are essentially "loaning" chips to startups they have invested in (like OpenAI and Anthropic).
When a company has to fund its own customers so they can buy its products, you aren't looking at organic growth; you’re looking at a liquidity treadmill that stops the moment Venture Capitalist (VCs) funding dries up.
The most dangerous part of the NVDA chart right now is the concentration. 60%+ of revenue comes from just four companies (Microsoft, Google, Meta, AWS).
All four are currently deploying their own silicon (Maia, Trainium, Axion). We are at "Peak Capex." These companies cannot spend $50B+ a quarter on chips forever. The moment they announce a "reduction in AI infrastructure spend" (likely in Q2/Q3 2026), the NVDA multiplier vanishes.
This structure is not new. It closely resembles the fiber-optic buildout of the late 1990s, where companies like Cisco and Nortel booked explosive top-line growth right up until the capital cycle reversed.
I am not calling for a collapse or a “short to zero” narrative. But the asymmetric upside that once existed is, in my view, largely exhausted for now.
From a broader market perspective, equities have transitioned into a weaker risk-efficiency regime. Sharpe ratios have deteriorated, and that shift has begun to propagate down the risk curve. NVDA itself has turned negative YTD, suggesting distribution rather than continuation at this stage.
There may still be volatility, retests, and tactical battles between bulls and bears at this inflection point. But reflexivity appears stretched. What remains supporting price increasingly looks like inertia rather than fresh marginal demand.
After an ~18x move in ~1,094 days, outperforming BTC, ETH, commodities, and most if not all single macro assets, expectations are saturated. Catalysts have largely been priced in. A correction, or at minimum a prolonged digestion phase, would not be bearish. It would be healthy.
Time will tell.

NFLX & NVDA = Hagia Sophia WARNING!🚨 WARNING! NVDA is the next NFLX
I first started warning about NFLX in the summer. You can see the formation setups step by step here. From H&S to the Hagia Sophia (rounding top) with a tower (head test)
The only time you will see such a pattern is at tops!
The H&S never failed. instead it head tested, which ended up being extreme. (Not uncommon in a raging, euphoric, bubbalicious market.)
What is most important about the Hagia Sophia pattern is that it signals that we are in the endgame stages of the move.
It's time to GTFO & STFO!
When exactly you GTFO is not as relevant as actually GTFO! You always need an exit strategy. Otherwise, you will ride it all the way back down, right into losses.
Shorting it on the other hand is differnet animal. This is the time to start picking your battles. Dipping your toe in the water, ready to take losses until it fails.
In this case, there were 3 key areas (CRACKS) to short. Two out of the 3 would have gotten you huge gains IF you understood the pattern.
NVDA looks the same today as NFLX looked back in the summer.
If you are long - GTFO RUN with Profits & STFO!
If you want to short wait for the next key area to CRACK!
Lastly, I bet you are wondering if NFLX is done going down? Answer is NO!
NFLX is now at 4️⃣ Deep Decline (-30%) — Moral Pressure Phase
“Buy when there’s blood in the streets”
“This is how generational wealth is made”
“The smart money is buying”
“Be greedy when others are fearful”
“This is once-in-a-decade”
📌 Translation: We need new buyers to absorb forced selling.
#FAFO
If you enjoy the work:
👉 Drop a solid comment
Let’s push it to 6,000 and keep building a community grounded in raw truth, not hype.

NVDA in Observation Mode — Katy AI Predicts Minor ShiftNVDA QuantSignals Katy 1M Prediction 2026-01-19
Analyzed 1 stock(s): NVDA
📈 NVDA Analysis
Current Price: $186.25
Final Prediction: $186.32 (+0.04%)
30min Target: $187.09 (+0.45%)
Trend: NEUTRAL
Confidence: 47.9%
Volatility: 7.1%
Summary: Katy AI predicts almost no short-term price change. No trade signal generated, so no call or put entry is recommended.

NVDA (swingtrading) Downtrend break outSame as the title: NVDA broke its downtrend and is now retesting the trendline. We can wait for an entry.
I’ll add one more thing —the larger pattern.

NVIDIA (NVDA) Price Charts Well-Known Reversal PatternBack in November, I shared with you the bearish outlook on NVDA
Recently we've got an early harbinger as I spotted a well-known reversal pattern that regularly appears after impulse reaches its climax and starts to reverse
Head & Shoulders reversal pattern (orange lines) is in the making on the weekly chart
We have 3 peaks with the highest in between forming the Head
The right shoulder was not built yet as the price should drop back to the Neckline
The bearish trigger set at the breakdown of the Neckline around $173
The target for H&S pattern is located at $129
It is calculated as the height of the Head subtracted from the Neckline breakdown point

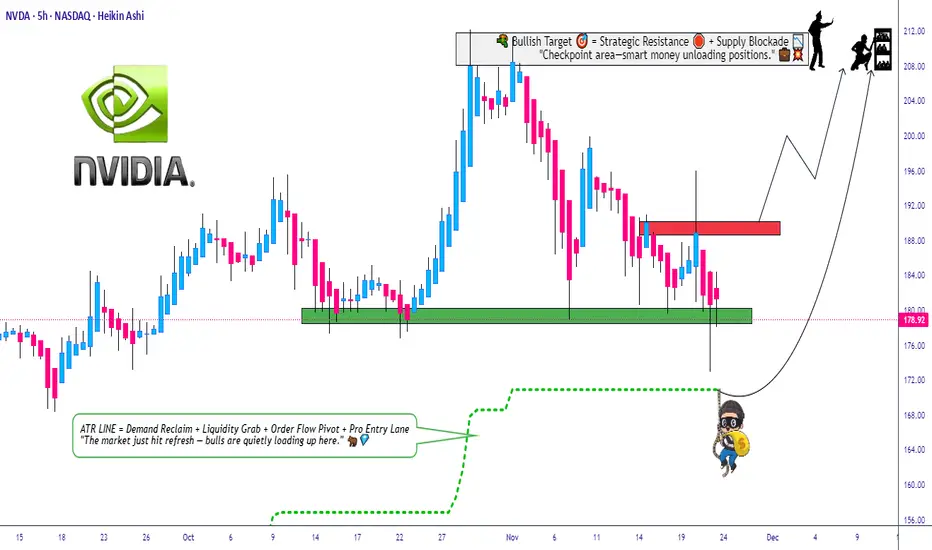
Can NVDA Hold the Pullback Zone and Extend the Uptrend?🔥 NVDA Bullish Pullback Playbook – Thief-Style Swing Setup 🚀🕵️♂️
Hey traders & my fellow Thief OG’s 😎🕶️ — here’s a clean, polished, TradingView-friendly version of my NVDA Swing Trade Playbook with a professional + funny touch. Let’s get to the setup 👇🔥
📌 Asset
NVDA – NVIDIA Corporation (NASDAQ)
Swing Trade | Momentum | Trend-Following Setup
📈 Plan: Bullish Pullback Strategy (Pending Orders Active)
The trend is strong, the buyers are steady, and NVDA is still delivering clean higher-lows. We're waiting for either a breakout continuation or a discounted pullback entry. 📊⚡
🎯 Entry Zones
1️⃣ Breakout Entry – Momentum Thief Mode 🥷⚡
Enter after clearing the nearest resistance at $191.00
• Clean breakout
• Volume confirmation
• Trend continuation strength
2️⃣ Pullback Entry – SuperTrend ATR Sniper Entry 🎯📉
Watch for a discounted pullback near $170.00 around the SuperTrend ATR zone.
• Trend support retest
• Lower-risk entry
• Ideal for swing traders who wait for “patience-pays entries” 😎
🛡️ Stop-Loss (Thief Style – Risk First)
Breakout Entry SL → $180.00
SuperTrend Pullback SL → $160.00
Note: Dear Ladies & Gentlemen (Thief OG’s) ❤️
I’m NOT recommending you use only my SL. Choose your own levels — you make the money, you protect the money. Trade at your own risk 🔐⚠️
🎯 Target (Take-Profit Zone)
Our target → $210.00
Why?
• Strong resistance zone
• Overbought region historically
• Buyer trap zone where police force 🚔👮♂️ usually waits — so escape with profits early 😂💨
Note: Dear Ladies & Gentlemen (Thief OG’s) 🙌
I’m NOT recommending you set my TP only. Choose your own TP — your money, your exit. Trade with responsibility 💼💰
🔍 Related Pairs to Watch (Correlation Insights + Key Notes)
NASDAQ:AMD
• High positive correlation with NVDA
• When AMD shows volume expansion, NVDA often follows
• Good for momentum confirmation 🔥
NASDAQ:SOXX (iShares Semiconductor ETF)
• NVDA is a major weighted component
• ETF direction confirms big-money flow 🧠💸
• Great for spotting sector-wide risk-on / risk-off shifts
NASDAQ:QQQ (NASDAQ 100 ETF)
• NVDA is one of the heaviest weights
• If QQQ trends strongly → NVDA often mirrors
• Macro sentiment index for tech strength 📊⚡
NASDAQ:SMH (VanEck Semiconductor ETF)
• Clean supply/demand signals
• NVDA mirrors SMH breakouts frequently
• Helps confirm breakout validity before taking the trade
All these help you avoid fakeouts and align with overall semiconductor market strength.
✨ “If you find value in my analysis, a 👍 and 🚀 boost is much appreciated — it helps me share more setups with the community!”
⚠️ This is a thief-style trading strategy created just for fun. Trade responsibly.
Stock Market Forecast | BTC TSLA NVDA AAPL AMZN META MSFT0:00 Intro & Overview
0:22 Sector Data & Sentiment
2:42 Dark Pools (RSP & MAG7)
6:44 S&P 500 (SPY)
9:21 Nasdaq 100 (QQQ)
11:37 Bitcoin (BTC)
15:04 Tesla (TSLA)
18:17 Meta (META)
22:03 Amazon (AMZN)
23:25 Microsoft (MSFT)
26:54 Google (GOOGL)
31:16 Apple (AAPL)
34:58 Nvidia (NVDA)
37:26 Outro
Stock Market Forecast | BTC TSLA NVDA AAPL AMZN META MSFT
SP:SPX AMEX:SPY CME_MINI:ES1! CME_MINI:NQ1!

Target 40% CAGR: 2026 High-Alpha PortfolioObjective: I’m targeting a 40% CAGR with this allocation. It’s an aggressive goal, but I believe it’s achievable by concentrating capital into "monopoly-moat" tech while using a structural hedge to buy the dips.
The Asset Mix:
Growth Engine (75%):
The AI Backbone: NVDA (20%) / AVGO (15%) / TSM (10%). Pure infrastructure play.
Software Scale: PLTR (10%) / MSFT (5%) / AMZN (5%). High-margin recurring revenue.
Disruptor: TSLA (10%). High-beta kicker for autonomy/robotics.
Capital Preservation (25%):
BRK.B (10%) / GLD (10%) / GS (5%). These are my "shock absorbers." They provide the liquidity and stability needed to survive volatility.
Execution Logic: By pairing high-beta assets with non-correlated hedges, I’m optimizing the Sharpe Ratio to ensure I can stay fully invested even during market corrections.
Management:
Quarterly Rebalancing: I will rebalance weights back to these targets every 90 days. This systematically forces me to sell overvalued winners and rotate into undervalued laggards.
Public Record: Logged on IBKR/OKX. Posting here for real-time transparency and accountability.

$NVDA Breakout to $231Posted this a while back but post was removed. $182 I said is a confluence of 50 Fib and my algo bias zone. Price bounced off this level and moved higher. Looking for a breakout higher.

Direxion Semiconductor 3x Bull | SOXL | Long at $30.00So many semiconductor companies... which one to choose? Enter AMEX:SOXL - not for the faint of heart. Losses and gains triple compared to most semiconductor ETFs, so stay away if high-risk plays aren't your thing. The top three holdings are NASDAQ:AMD , NASDAQ:AVGO , and NASDAQ:NVDA - two of which are at all-time highs...
I wouldn't be shocked if AMEX:SOXL enters the low $20's to test the base of my historical simple moving average area, but I don't think we are done hearing about AI and the semi demand. There are large gaps to fill above and below the current price and we are at the 50/50 stage (i.e. historical simple moving average zone) for a price move up or down.
My bet is up, especially with the new presidential administration. If politicians start dumping semis, I'm out. Thus, at $30.00 AMEX:SOXL is in a personal buy zone.
Target #1 = $35
Target #2 = $40
Target #3 = $50
Target #4 = $60
