AMD (2025+) Catalysts & Risks: 300 USD PT Bulls🟥 AMD (2025+) Catalysts & Risks: Analyst Views
________________________________________
🔑 Key Catalysts Driving AMD’s Stock Growth (2025+)
🌌 Quantum-Centric Supercomputing with IBM
AMD’s collaboration with IBM to merge CPUs/GPUs with quantum computing promises a whole new class of hybrid architectures. If successful, this could unlock brand-new compute markets in research, defense, and enterprise.
Impact Score: 9.5/10
🏗️ Hyperscaler Traction & Data-Center GPU Gains
AMD’s MI355 and upcoming MI400 accelerators are gaining traction with big cloud players. Even a modest 10% market share in AI GPUs would be transformative for AMD’s revenue mix.
Impact Score: 9/10
📈 Analyst Upgrades & Bullish Price Targets
Wall Street has turned bullish—multiple PT hikes point to 20–40% upside. Analyst enthusiasm often accelerates institutional inflows, reinforcing AMD’s momentum.
Impact Score: 7.5/10
🌍 Global AI Accelerator Growth & Middle East Expansion
AMD is securing multi-billion sovereign AI infrastructure deals in the Gulf (Saudi, UAE). These large-scale contracts validate AMD’s credibility as a true Nvidia alternative.
Impact Score: 8.5/10
💰 Strong Financial Performance & Executive Optimism
Q1 results crushed expectations with revenue and profit growth across data center and AI. Sustained beats strengthen AMD’s credibility and support multiple expansion.
Impact Score: 8/10
🔗 Broad Ecosystem & Strategic Acquisitions
Acquisitions like Xilinx and Silo AI give AMD a richer portfolio spanning FPGAs, AI software, and custom servers (Helios). This positions AMD as more than just a chipmaker—an AI infrastructure player.
Impact Score: 7/10
________________________________________
⚠️ Key Negative Drivers & Risks
🇨🇳 China Export Restrictions
AMD is losing access to a massive end market due to US export rules. This already shaved off ~$1B in projected sales and could worsen with future policy shifts.
Risk Severity: 9/10
📉 Under-whelming AI GPU Sell-In
Past misses on data-center GPU sales remind investors that adoption is not guaranteed. If hyperscalers hesitate, AMD’s AI growth story could stall.
Risk Severity: 7.5/10
💸 Valuation & Excess Rally Risks
Shares are up massively YTD—if results don’t keep pace, profit-taking could spark sharp pullbacks.
Risk Severity: 7/10
⚡ Short-Term Volatility & Earnings Reaction
Even with growth, near-term misses or cautious guidance could swing the stock hard.
Risk Severity: 6.5/10
🥊 Competitive Pressure
Nvidia’s CUDA ecosystem remains deeply entrenched, while custom silicon from hyperscalers (Google TPUs, AWS Trainium) eats into the TAM. AMD is fighting uphill.
Risk Severity: 8/10
________________________________________
📝 Summary Outlook (Sept 2025)
AMD is no longer the underdog—it’s becoming a legitimate AI infrastructure contender. The IBM quantum partnership and hyperscaler adoption of MI400 GPUs could be game-changers. Sovereign AI deals in the Middle East and ecosystem-expanding acquisitions amplify the story.
But execution risk is high—China export bans, entrenched Nvidia dominance, and valuation stretch leave little room for error. Success hinges on AMD proving it can scale its AI GPUs and secure recurring demand.
Rank Catalyst 🚀 Score (0–10)
1⃣ 🌌 Quantum-Centric Supercomputing with IBM 9.5
2⃣ 🏗️ Hyperscaler GPU Adoption (MI355/MI400) 9
3⃣ 🌍 Middle East AI Mega Deals 8.5
4⃣ 💰 Strong Financial Growth 8
5⃣ 📈 Analyst Upgrades & PT Revisions 7.5
6⃣ 🔗 Ecosystem & Acquisitions (Xilinx, Silo AI, Helios) 7
NVDA

NVIDIA Has Some Reversal SignsNVDA has formed a double top and stochastic oscillator divergance on the dailyt chart. ON the monthly chart it has a it has formed a shooting star candle.
Good luck for all of you
Markets Titan

Nvidia (NVDA) Shows Bearish Signs After Earnings ReleaseNvidia (NVDA) Shows Bearish Signs After Earnings Release
On Wednesday, Nvidia published a fairly strong quarterly report:
→ Revenue for the second quarter came in at $46.74 billion (record), up 56% compared with the same period last year;
→ Adjusted earnings per share (EPS) were $1.05, a 54% year-on-year increase and above analysts’ expectations of $1.01–$1.02.
However, in the Data Centre segment (closely watched by the market), results fell slightly short of Wall Street forecasts, which may suggest a slowdown in capital flows into AI infrastructure. This factor could explain why Nvidia (NVDA) underperformed the index later in the week: for instance, the S&P 500 hit a record high on Thursday, while NVDA closed lower.
Technical analysis of Nvidia (NVDA) chart
Six days ago, we:
→ Drew an upward channel (shown in blue), capturing NVDA’s price swings after the bullish surge at the end of June;
→ Highlighted the importance of support at $170 and resistance at $183.
Indeed, $183 looks like a solid barrier:
→ The numbers (1, 2, 3) mark failed attempts by the bulls to break through this resistance, giving grounds to view the chart in the context of a triple top pattern.
→ The third peak only slightly exceeds the previous highs, which resembles a bull trap and the Upthrust After Distribution (UTAD) pattern in Richard Wyckoff’s methodology, signalling the prospect of lower prices. A bearish gap the following day (shown by the red arrow) and a weak Friday close underline the bears’ aggression.
Given the above, we could assume that the bulls may try to keep the price within the channel, relying on support at its lower boundary. Yet the mentioned signals suggest that the bears are intensifying pressure. If we see only a weak rebound from the lower boundary at the start of September, the current channel could be at risk. In the event of a bearish breakout, a move down to test the $170 support could happen.
This article represents the opinion of the Companies operating under the FXOpen brand only. It is not to be construed as an offer, solicitation, or recommendation with respect to products and services provided by the Companies operating under the FXOpen brand, nor is it to be considered financial advice.

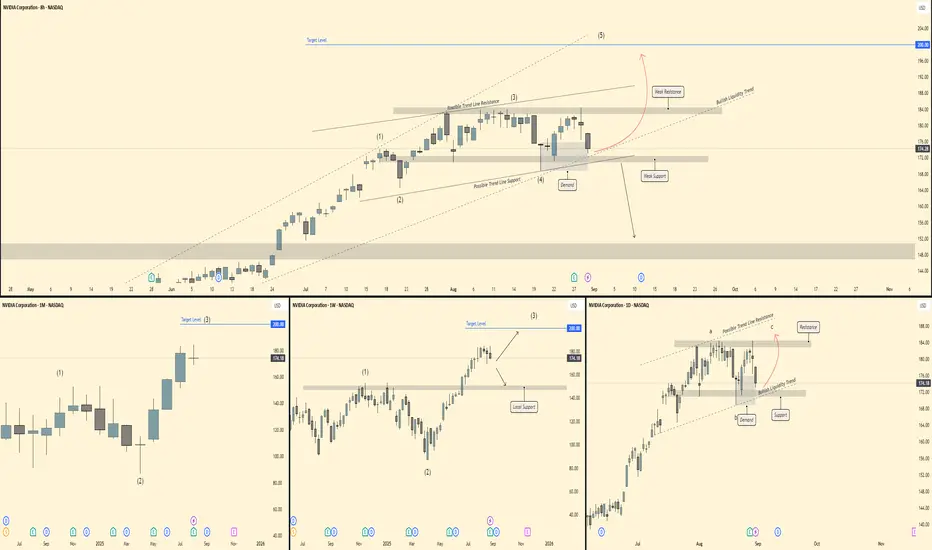
NVDA - Critical Point right now! Back to 150 OR we make new high📊 NVDA – Multi-Timeframe Outlook
🔎 Monthly (1M)
Strong bullish structure with clear Elliott Wave progression (1)-(3) unfolding.
Current candle shows retracement after a parabolic push, but higher timeframe structure remains intact.
Target level stands at 200 USD, aligning with Wave (3) completion zone.
🕰 Weekly (1W)
NVDA completed Wave (3) near 184, now pulling back into a local support zone ~160 – 165.
Structure suggests a corrective Wave (4) before potential continuation higher.
As long as support holds, expectation remains for a Wave (5) push towards 200+.
⏱ Daily (1D)
Price coiling inside a corrective a-b-c structure under trendline resistance.
Demand/support zone ~170 – 172 is acting as the base.
Break above 184 resistance confirms bullish continuation, while loss of support opens risk towards 152 (deeper retrace).
⏳ 8H
Clear retracement into demand after Wave (3) high.
Price holding trendline support + demand confluence.
If buyers step in, expect a rally into Wave (5) targeting 190 – 200.
Breakdown of demand would shift momentum bearish short-term.
🎯 Trade Plan
Bias: Bullish continuation (Wave 5 setup)
Entry Zone: 170 – 175 (demand/support)
Targets: 184 (short-term), 200 (medium-term)
Invalidation: Break & close below 160 support
Is September For the Bears?QQQ CME_MINI:NQ1! CME_MINI:ES1! stock market Forecast
Nvidia Stock NASDAQ:NVDA Forecast
Apple Stock NASDAQ:AAPL Forecast
Microsoft Stock MSFT Forecast
Google Stock GOOGL Forecast
Amazon Stock AMZN Forecast
Meta Forecast Technical Analysis
Tesla Stock TSLA Forecast
Magnificent 7 stocks forecast

XRP LABOR DAY SALEXRP HIT A CRITICAL SUPPORT ZONE BETWEEN $2.80-$2.76
Xrp can head back towards $3 to test resistance. If xrp breaks $3 it can head to $3.50 and breakout towards $5 on the weekly charting
This is not financial advice. Good luck!
-R2C

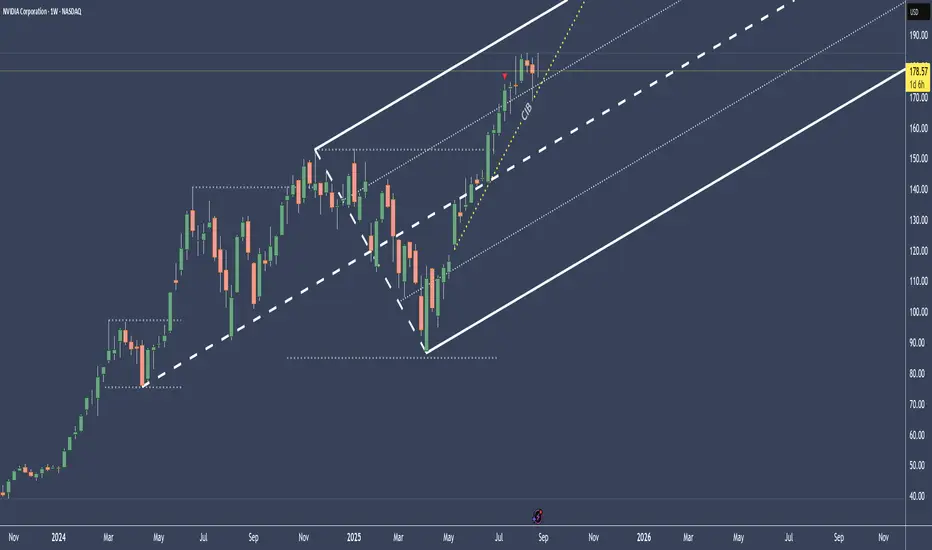
NVDA - Watch the show, until the Sh** hits the FanThe expected “end of hype” around Nvidia stems from its current inability to forecast H20 chip sales to China, forced production halts, and growing political friction—despite its strong financial performance elsewhere.
The tension between U.S. export policy and China’s technological self-reliance is creating real operational and strategic obstacles for Nvidia.
In this weekly chart we still have an upward projection.
Nonetheless do we all know what a Game NVDA is playing by selling to its one companies.
The air is thin, very thin up there.
And after the Earnings Report we all know how the books are pimped.
A breach of the CIB line would make me go "hmmm....", and starting to look for a short.
Until then, just relax and watch the show.
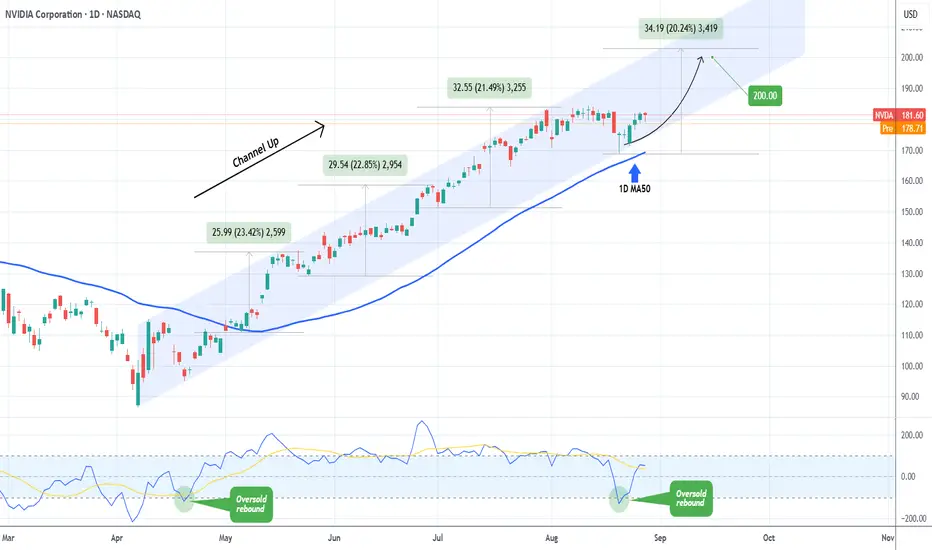
NVIDIA Is it still a buy after its Earnings release?NVIDIA Corporation (NVDA) delivered stronger-than-expected second-quarter earnings on Wednesday, but its data center revenue came in slightly below forecasts as U.S. restrictions on H20 chip sales to China weighed on results. The result was a 3.1% fall on the company's stock in after-hours trading following the report.
The obvious question is this: Is it still a buy?
The answer can be given by purely looking at the technicals. Based on the bigger picture, the stock's 5-month pattern remains a Channel Up since the April 07 bottom, and in fact the recent dip on August 20 was a Higher Low exactly on the pattern's bottom and almost on the 1D MA50 (blue trend-line), which has been intact since May 06.
Given also the fact that the 1D CCI rebounded with aggression after marginally breaking below its oversold level (-100.00), similar to April 21, we expect NVIDIA to resume the bullish trend and extend this new Bullish Leg.
Since the last three Bullish Legs have all increased by a little more than +20%, we expect the price to easily reach our $200.00 long-term Target, before the next technical correction occurs.
-------------------------------------------------------------------------------
** Please LIKE 👍, FOLLOW ✅, SHARE 🙌 and COMMENT ✍ if you enjoy this idea! Also share your ideas and charts in the comments section below! This is best way to keep it relevant, support us, keep the content here free and allow the idea to reach as many people as possible. **
-------------------------------------------------------------------------------
💸💸💸💸💸💸
👇 👇 👇 👇 👇 👇
NVDA Range BoundMonth of August Range Bound
After market since Earnings...holding previous support/resistance level $172.

NVDA LIVE 27 AUG 2025This is my analysis for NVDA . i am not touching it all. I have discussed my reasons as per data. If you have any doubts, feel free to DM me
NOTE: AVOIDING NVDA

All Eyes on NVIDIA Earnings – Will AI Boom or Bust?👀 All Eyes on NVIDIA Earnings – Will AI Boom or Bust? 🎯
Hey guys, Kiri here – the FX Professor.
NVIDIA is at a crucial technical resistance around 182.85 . At the same time, the S&P 500 is already pumped above 6433 — showing strength, for now .
So, what happens next?
🧠 Let’s break it down:
• NVIDIA = The AI barometer 📊
• S&P = Already reacting positively 📈
• Crypto = Waiting in line 🪙
🤖 Earnings Scenarios:
1️⃣ Normal earnings:
Market holds — NVIDIA may stay sideways. Risk-on sentiment stays intact.
2️⃣ Good (even slightly good) earnings:
Likely breakout above 182.85.
S&P 500 could push higher.
Crypto benefits — especially AI-related coins.
3️⃣ Bad earnings:
🚨 Be very, very careful.
Could trigger a rotation out of AI, bring in “overvaluation” FUD.
Combine that with weak GPT-5 reviews? We might see a sharp correction.
Remember: Earnings don’t obey technical setups. This is a fundamental catalyst — and anything can happen. Toss a coin, roll the dice — it’s that kind of game.
📍 My Position:
I'm bullish until NVIDIA earnings drop .
But I’m not blind — the popcorn is ready 🍿 and I’m watching every tick.
The chart shows the key levels – support, parabola, re-entry zones, and risk-reward scenarios.
Stay sharp. This one matters.
One Love,
The FXPROFESSOR 💙
Disclosure: I am happy to be a HUMAN and as an AI-dev let me tell you this: AI will NEVER be able to come close to Human power: no feelings, no thinking, no intuition, no soul. YOU, my fellow human are the biggest strongest piece of Code. You are the best blockchain, your kids, your work, your hobbies, your pets and your Wisdom are the best Altcoins. Remember to live with Love and respect for yourself and for others.🌟🤝📈

NVDA Earnings Play | \$190C– Don’t Miss Out
# 🚀 NVDA Earnings Play | \$190C @ 2.49 | 200–400% Target 🎯
### 📝 Quick Take (TL;DR)
* **Bias:** Moderate-Bullish (78% confidence).
* **Rationale:** Fundamentals 🔥 + Options flow skewed bullish 📈 + Technicals constructive.
* **Main Risk:** China export \~\$8B headwind in guidance.
---
### 🎯 Trade Idea
* **Buy** NVDA **2025-08-29 \$190 Call**
* 📌 Entry: \$2.49 (ask) — enter **pre-earnings close** (Aug 26 AMC).
* 🛑 Stop: \$1.25 (−50%).
* 🎯 Targets:
* +200% → \$7.47
* +300% → \$9.96
* ⏳ Exit Rule: If neither stop/target hit, **close within 2h post-earnings open**.
* ⚖️ Risk: \$249 per contract (max loss).
---
### 📊 Why This Setup?
**Fundamentals (9/10)**
* Revenue growth: +69% TTM 🚀
* Margins elite (gross 70%, net 52%) 💰
* Beat history: 8/8 last quarters ✅
* Balance sheet strong (cash \~\$54B).
**Options Flow (8/10)**
* Implied move ~~5.9% (~~\$10.5).
* Call OI heavy @ \$185–\$200 (gamma cluster).
* Liquidity excellent at \$190 strike (OI >64k).
**Technicals (8/10)**
* Price \$179.83, holding above 20/50/200 MAs.
* RSI neutral (53).
* Resistance: \$184.5 / \$190 / \$200.
* Coiling under highs 🔄.
**Macro (6/10)**
* AI/data center demand = secular tailwind.
* China ban risk headline.
* VIX \~15 → complacency = bigger gap risk.
---
### ⚠️ Risks
* Guidance may highlight China hit (\$8B) → bearish gap.
* IV crush 30–50% post-print.
* Gap risk may bypass stop.
* Single-leg naked = high variance → **size small (≤2% portfolio).**
---
### 📌 Execution Checklist
✅ Confirm ask = 2.49 @ close.
✅ Expiry = 2025-08-29 (weekly).
✅ Size ≤ 2% acct.
✅ Close within 2h post-earnings if no trigger.
---
### 📊 TRADE JSON
```json
{
"instrument": "NVDA",
"direction": "call",
"strike": 190.0,
"expiry": "2025-08-29",
"confidence": 78,
"entry_price": 2.49,
"stop_loss": 1.245,
"profit_target": 7.47,
"size": 1,
"entry_timing": "pre_earnings_close",
"earnings_date": "2025-08-26",
"earnings_time": "AMC",
"expected_move": 5.9,
"iv_rank": 0.75,
"signal_publish_time": "2025-08-26 14:00:37 UTC-04:00"
}
```
---
### 🔖 Hashtags
\#NVDA #EarningsPlay #OptionsTrading #CallOptions #StockMarket #AIStocks #Futures #SwingTrade #TradingSignals #RiskReward #OptionsFlow #SP500 #TechStocks

NVDA NVIDIA Corporation Options Ahead of EarningsIf you haven`t bought NVDA before the split:
Now analyzing the options chain and the chart patterns of NVDA NVIDIA Corporation prior to the earnings report this week,
I would consider purchasing the 200usd strike price Calls with
an expiration date of 2025-12-19,
for a premium of approximately $10.30.
If these options prove to be profitable prior to the earnings release, I would sell at least half of them.
Disclosure: I am part of Trade Nation's Influencer program and receive a monthly fee for using their TradingView charts in my analysis.

NVDA \$200C→ Big Move Loading?
# 🚀 NVDA Weekly Options Setup | \$200 Call 🎯 (High Risk / High Reward)
📊 **TRADE SNAPSHOT**
* **Ticker**: NVDA
* **Direction**: 📈 CALL (LONG)
* **Strike**: \$200
* **Entry Price**: \$1.44
* **Profit Target**: \$2.16 (50% gain)
* **Stop Loss**: \$0.58 (40% risk)
* **Expiry**: 2025-08-29
* **Confidence**: 65%
* **Timing**: Enter at Open
* **Signal Time**: 2025-08-23 11:11 EDT
---
### 🔎 Market Analysis
✅ **Weekly RSI**: 87.2 (RISING → Strong Bullish)
⚠️ **Daily RSI**: 63.3 (FALLING → Short-term caution)
📉 **Volume**: 0.9x last week (Weak confirmation)
🔥 **Options Flow**: Calls 617k vs. Puts 383k → **1.61 ratio (Bullish Bias)**
---
### 📈 Bias & Strategy
* **Overall Sentiment**: **Moderate Bullish** 🚀
* Bullish institutions loading Calls → supports upside.
* Weak daily momentum + low volume = ⚠️ caution.
* High gamma risk → manage tight with stop loss.
🏷 **Tags**:
\#NVDA #OptionsTrading #SwingTrade #WeeklyOptions #TradingView #StockMarket #EarningsPlay #MomentumTrading #OptionsFlow #GammaRisk
Nvidia (NVDA) Upcoming Earnings ReportNvidia (NVDA) Upcoming Earnings Report
Tomorrow after hours, Nvidia will release its quarterly report, attracting heightened attention given its position as:
→ the world’s largest company (market capitalisation of around $4.39 trillion);
→ a leader in the development of AI-related industries;
→ strong stock price performance — approximately +33% year-to-date, +108% from the yearly low.
Bullish Expectations
Analysts anticipate Nvidia will report revenue of around $46 billion, more than 50% higher than the same period last year.
Investors are counting on confirmation of robust demand for Nvidia’s chips from tech giants such as Microsoft, Google, Amazon, and Meta, all of which continue to expand capital expenditure on data centres to power AI workloads.
Further support for NVDA’s share price could come from positive news about demand for the new Blackwell chips and the resumption of sales in China following a recent agreement with the US government.
Bearish Concerns
Even strong results may fall short of “sky-high” optimistic expectations, potentially triggering profit-taking and a decline in Nvidia’s (NVDA) stock price. The stock trades at a high P/E multiple (price-to-earnings ratio), making it vulnerable to any negative news or even a minor miss against forecasts.
The primary concern is that Nvidia’s forward guidance might point to a slowdown in AI infrastructure spending growth by its key clients. Any hint of this could negatively affect not only Nvidia’s shares but also the broader technology sector.
Technical Analysis of Nvidia (NVDA) Chart
NVDA’s share price remains within an upward channel (shown in blue), with the following configuration:
→ until mid-August, the price remained within the upper half of the channel;
→ in August, the price declined towards the lower boundary (point A).
The $170 level appears to be a key support:
→ it is a round psychological level;
→ the low at point A looks like an aggressive test of this level, after which the price reversed upward.
From a bullish perspective:
→ support is provided by the lower boundary of the channel;
→ a long bullish candlestick (2) signals persistent demand.
From a bearish perspective, the $183 level looks like key resistance: NVDA’s share price slowed its advance here in early August, with repeated unsuccessful attempts to break higher.
Given the above, we could assume that the bulls may attempt to push through the $183 resistance on the back of the earnings release, but to do so, Nvidia’s results and guidance must at least meet the market’s extremely optimistic expectations.
This article represents the opinion of the Companies operating under the FXOpen brand only. It is not to be construed as an offer, solicitation, or recommendation with respect to products and services provided by the Companies operating under the FXOpen brand, nor is it to be considered financial advice.

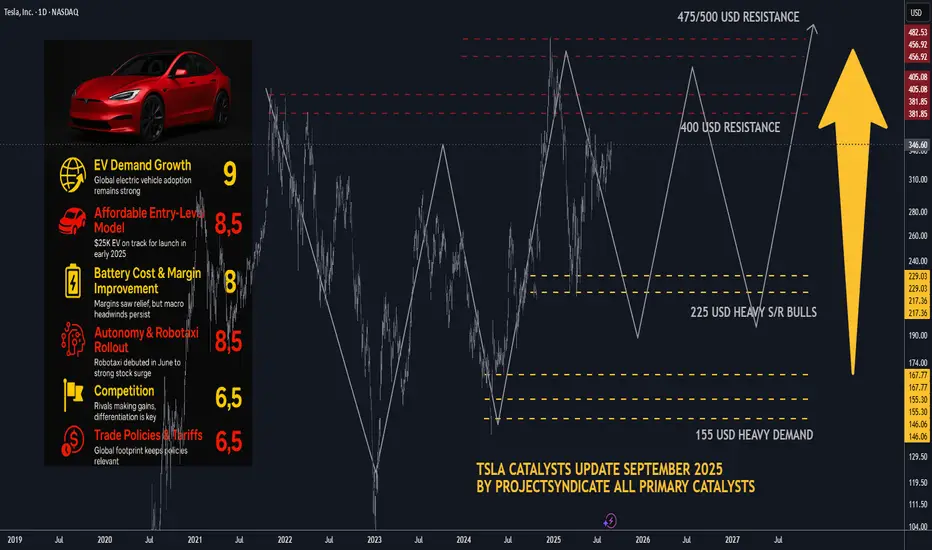
TSLA Catalysts Ranking: September 2025 update and Path ForwardHere's an updated/revised outlook for TSLA including all the primary
catalyst ranking and analyst ratings and overview of latest developments
this was updated for September 2025 with all the viable market data.
🤖1. Autonomous & Robotaxi Execution (↑ from 8.5 to 9/10)
• Why it matters: Tesla officially launched its Robotaxi service in Austin on June 22, 2025, deploying a small fleet of 10–20 invite-only Model Ys operating within a geofence and featuring human safety monitors..
• The stock rallied impressively—up 9%–11% on launch day..
• Regulatory scrutiny intensified as the NHTSA launched probes into delayed crash reporting and other safety concerns..
• Musk also touted FSD v14 as 2–3× safer than humans, with v15 aiming to be 10× safer—but cautioned debugging would take "several months.".
• Why the bump to 9/10? The real-world rollout is finally underway, drawing heavy investor focus—even amidst safety questions.
________________________________________
🌍2. EV Demand Growth & Geographic Recovery (holds at 9/10)
• Despite a 13% year over year global sales drop in H1 2025, future demand hinges on Amazon of lower priced models and tax credit extensions..
• Strong upward investor sentiment: TSLA is up 54% over the past year, despite being down ~16% YTD..
• Why still 9/10? Long-term EV momentum remains solid; a rebound may follow new launches or incentive shifts.
________________________________________
💸3. U.S. EV Tax Credits & Incentives (↑ from 6 to 7.5/10)
• The $7,500 EV tax credit—set to expire September 30—has been extended: now, buyers can qualify with a signed purchase agreement, even before delivery..
• However, expiration still looms and could dampen demand..
• Why bump to 7.5/10? The extension buys breathing room and could stabilize near-term demand.
________________________________________
📉4. Fed & Interest Rates (↑ from 5 to 6.5/10)
• On August 22, Tesla led a mega cap tech rally (up 6%+) after Fed chair hinted at possible rate cuts—lower borrowing costs may aid EV financing..
• Why improved score? Lower rates remain a key catalyst for big-ticket items like EVs.
________________________________________
🎭5. Affordable Entry-Level Model / Next-Gen Platform (holds at 8.5/10)
• Musk revealed the upcoming affordable model may resemble a Model Y and could launch slower than expected post tax credit expiration..
• The “next gen” platform—including the so called “Model 2/Q” or Cybercab—targets mid 2025 production..
• With delays likely, expectations remain high but execution risk persists.
________________________________________
🔋6. Battery Cost & Margin Improvement (holds at 8/10)
• Q2 margins improved modestly, supported by cost cuts and energy business growth..
• Yet, regulatory credits continue to decline (–51%), pressuring margins..
________________________________________
🤖7. Energy & AI Upside (new 8/10)
• Tesla is doubling down on autonomy and energy. Musk highlighted robotaxi, energy storage, and its humanoid Optimus robot, slated for early 2026..
• Wedbush’s Dan Ives sees Tesla as an “embodied AI compounder,” while William Blair estimates self driving could be worth nearly $1 trillion..
• This iterative AI and energy focus is a compelling re-rating vector.
________________________________________
📊 8. Safety, Regulatory & Governance Risk (↑ to 7/10)
• NHTSA’s probe into crash-report delays, plus ongoing FSD safety concerns, elevate tail risk..
• Musk’s political entanglements have had adverse brand impacts; while stepping back from new political initiatives helped marginally, skepticism persists..
• Added governance scrutiny and Musk’s external ventures continue to weigh on sentiment.
________________________________________
🚩9. Competition & Global Sales Slump (holds at 6.5/10)
• EV rivalry heats up, and Tesla’s European and Chinese market share slumped significantly.
• Still a notable headwind.
________________________________________
✅10. Commodities & Raw Material Costs (holds at 5.5/10)
• Volatile raw material prices continue to affect margins; hedges help but don't eliminate the risk.
________________________________________
🚀11. Macro & Trade Policies (new 6/10)
• Tariff risks and global trade instability persist. Musk has warned of “rough quarters” ahead linked to these macro risks..
• Considered separately, worth tracking but less immediate than others.
________________________________________
Updated Catalyst Scorecard
Rank Catalyst Score
1 Autonomous & Robotaxi Execution 9
2 EV Demand Growth 9
3 Affordable Entry-Level Model 8.5
4 Battery Cost & Margin Improvement 8
5 Energy & AI Upside 8
6 U.S. EV Incentives 7.5
7 Safety, Regulatory & Governance Risk 7
8 Fed & Interest Rates 6.5
9 Competition & Global Sales Slump 6.5
10 Macro & Trade Policy Risks 6
11 Commodities & Raw Material Costs 5.5
________________________________________
📊Analyst Ratings & Price Targets (Updated)
• Median 12-month price target: ~$303–$307, implying slight downside from current ~$346..
• High-end bulls: Dan Ives (Wedbush) at $500; Benchmark raised to $475..
• Cautious voices: UBS remains bearish at $215, saying robotaxi upside may be priced-in..
• Wolfe Research: warns near-term earnings estimates are too optimistic, free cash flow may remain under pressure..
________________________________________
🔍Recent Headlines You Should Know
• Robotaxi launch in Austin, promoting optimism but drawing scrutiny..
• FSD & Optimus focus, backed by bullish commentary like “embodied AI compounder.”.
• EV credit tweak buys time for deliveries and demand..
• Fed hinting at rate cuts, offering cyclical lift..
• Q2 earnings miss on EPS and revenue, but autonomy/energy pushed narrative..
________________________________________
• Bull Case: Robotaxi and AI drive restore investor confidence, pushing targets toward $475–$500.
• Base Case: Steady but cautious—watch for execution on autonomous and cost-efficiency.
• Bear Case: Renewed delivery slumps, regulatory blowback, or failed rollout could weigh toward downside support in the $300–$330 range.
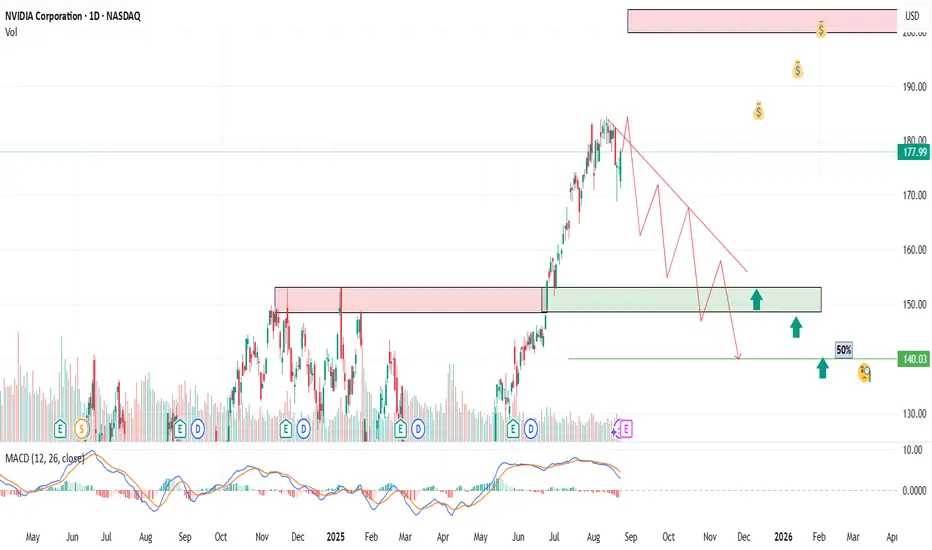
NVDA Earnings, US GDP, US Core PCE - August Wrap-UpAs if Jackson Hole noise wasn't enough, sprinkle in some additional major news
for this week.
NVDA Earnings (After Close Wednesday)
US GDP (Thursday)
US Unemployment Claims (Thursday)
US PCE / US Core PCE (Friday)
NVDA at nearly 8% market cap for S&P can certainly move the market
Look at NVDA, MAGS, SPY, QQQ and they all look like 50/50 charts - price could
go either direction
NVDA expecting +/- 11.00 points on the week, average earnings move is around 12.66 points
I'm looking to fade any big gap on NVDA into September monthly and quarterly expirations with low risk options trades and I'm also deleveraging some of my naked puts and ratio spreads
to take profits and add more buying power for the end of year
I'll be watching - let's see how everything shakes out

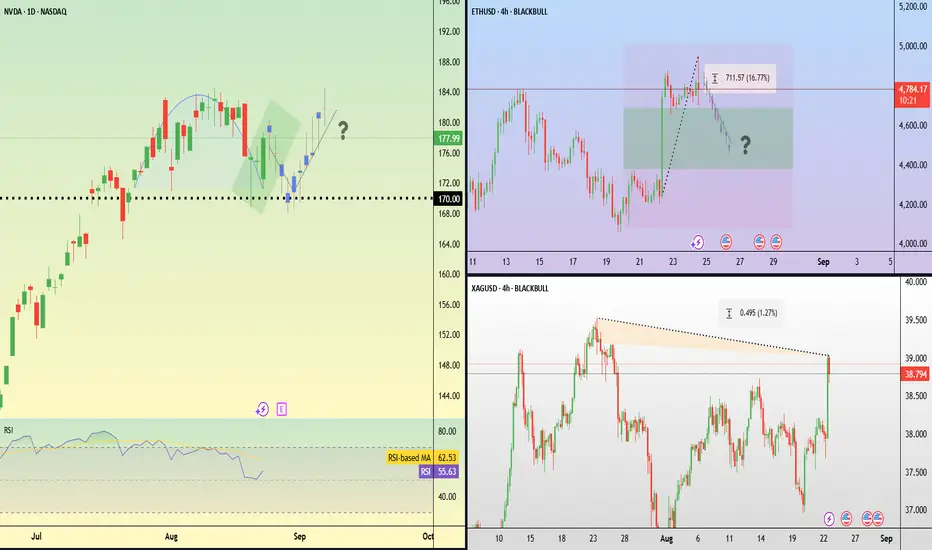
Traders caught off guard --- Now NVDA's Reverse Cup and HandleTraders were caught off guard by Federal Reserve Chairman Jerome Powell’s unexpectedly dovish tone at the Jackson Hole symposium.
In his keynote, Powell highlighted softening inflation risks and growing concerns over the labour market, boosting market expectations of a 25-basis point rate cut in September.
The speech ignited a strong cross-asset rally. Equities surged, with the S&P 500 up 1.5% and the Nasdaq advancing 1.9%. Ethereum led digital assets higher, soaring 15%, climbing as high as $4,950 and surpassing its previous November 2021 high of $4,866. Silver also rallied, touching $39 per ounce and moving closer to its 14-year peak of $39.5 reached at the end of July.
Looking ahead, U.S. markets will turn their focus to Nvidia’s upcoming earnings results. Price action shows a series of higher highs and higher lows, but the stock has recently faced resistance near $190. Price potentially remains supported around $170, which aligns with the breakout zone from early August.
XRP BULLISH CONTINUATION ! XRP has been consolidated between the areas of $3.30 and $2.82. The SEC has finally concluded its appeal and settled on a fine on Ripples end. Immediately after, about 7 ETF’s were filed on behalf of XRP, as well as SWIFT announcing the introduction of XRP and HBAR in cross border payments. As mentioned in recent posts, XRP should be headed above the resistance at $3.31 and break towards $4, $5 and possibly above. I believe this will be a quick and solid crypto season, before a possible exhaustion in this next wave.
This is not financial advice.
Good luck! -R2C

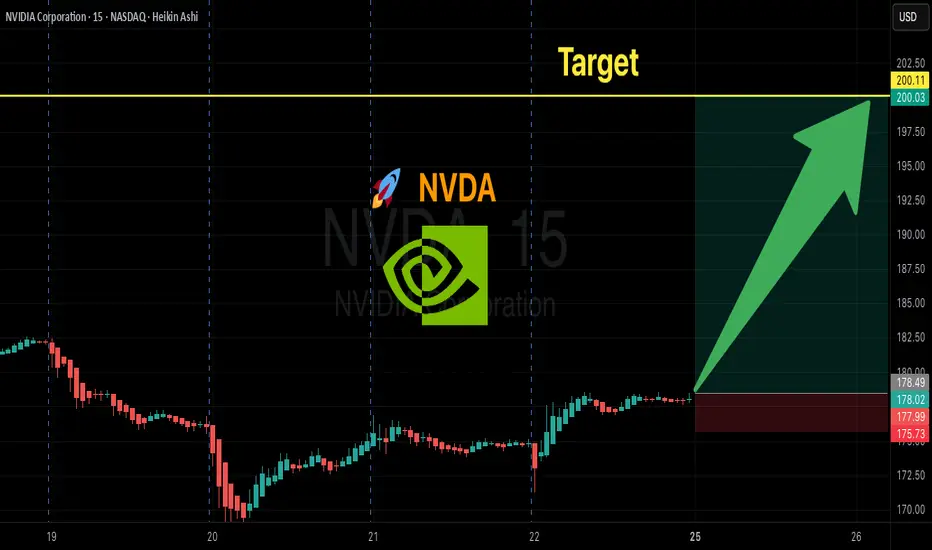
NVDA – Decision Week Ahead $200 or $140?NVIDIA (NVDA) has been on an incredible bull run, climbing from $140 to nearly $180+ in just 2–3 months. Now, with earnings coming this week, the market is at a decision point: Will the AI leader extend its rally toward $200 🚀, or will profit-taking and cautious guidance send it back toward $150 📉?
🟢 Bullish Scenario
Entry points: 170→165→160
Targets: $185 → $190 → $200+
Lose $170? I’ll wait patiently for $150–140 before sizing back in.
🔴 Bearish Scenario – Pullback to $150–140
If earnings disappoint or guidance weakens (China restrictions, slowing demand), NVDA could unwind toward prior support.
Entry Points (for long re-entry after correction):
$160
$150
$140
Targets on recovery: $160 → $175 → $190
📌 Disclaimer: This post reflects my personal trading plan, not financial advice. Always do your own research and use proper risk management.
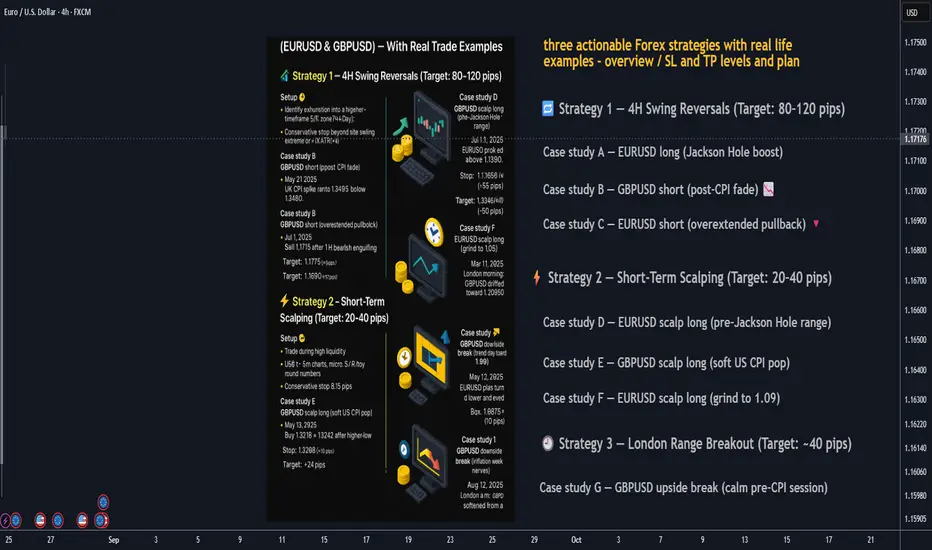
3 Actionable FX Strategies — With Real Trade Examples👋 Below are three practical strategies you can plug into your playbook today:
1. swing reversals (80+ pips), 2) short-term scalps (20–40 pips), and 3) the London range breakout (≈40 pips). Each section includes rules of engagement, risk management, and three real-market case studies on EURUSD and GBPUSD with conservative stops.
________________________________________
🔁 Strategy 1 — 4H Swing Reversals (Target: 80–120 pips)
Setup 🧩
• Identify exhaustion into a higher-timeframe S/R zone (4H/Day).
• Look for a reversal signal (engulfing/pin bar, momentum shift, or divergence) and a confirmation close.
• Conservative stop: beyond the swing extreme or ~1× ATR(14) on the entry timeframe.
• Take-profit: next HTF level or ≥ 1.8R, aiming for 80+ pips.
Case study A — EURUSD long (Jackson Hole boost) 📈
• When: Aug 22, 2025, NY session after Powell; EURUSD pushed above 1.1700 on broad USD weakness.
• Plan: After a 4H close back above 1.1700, buy a retest ~1.1705.
• Stop: 1.1650 (≈55 pips).
• Target: 1.1790 (≈85 pips).
Case study B — GBPUSD short (post-CPI fade) 📉
• When: May 21, 2025, UK CPI spike ran to 1.34695 then faded.
• Plan: After a 15–30m lower high below 1.3460, sell break of 1.3435.
• Stop: 1.3490 (≈55 pips).
• Target: 1.3345 (≈90 pips).
Case study C — EURUSD short (overextended pullback) 🔻
• When: Jul 1, 2025, EURUSD briefly poked above 1.1800 then eased.
• Plan: Sell 1.1775 after a 1H bearish engulfing.
• Stop: 1.1825 (≈50 pips).
• Target: 1.1690 (≈85 pips).
________________________________________
⚡ Strategy 2 — Short-Term Scalping (Target: 20–40 pips)
Setup 🧩
• Trade during high liquidity (London open or London/NY overlap).
• Use 1–5m charts: micro S/R + round numbers, quick momentum bursts.
• Conservative stop: 8–15 pips (just beyond the micro structure).
• Take-profit: 20–40 pips or to next intraday level.
Case study D — EURUSD scalp long (pre-Jackson Hole range) ⏱️
• When: Aug 21, 2025, Europe a.m.; EURUSD near 1.1650.
• Plan: Buy break-and-retest 1.1665.
• Stop: 1.1652 (≈13 pips).
• Target: 1.1687 (≈22 pips).
Case study E — GBPUSD scalp long (soft US CPI pop) 💥
• When: May 13, 2025, post-US CPI tone lifted risk; GBPUSD ~1.3226.
• Plan: Buy 1.3218 → 1.3242 after higher-low.
• Stop: 1.3208 (≈10 pips).
• Target: +24 pips.
Case study F — EURUSD scalp long (grind to 1.09) 🚀
• When: Mar 11, 2025, London morning; EURUSD nudged to 1.0890 / kissed 1.0900.
• Plan: Buy 1.0885 on retest.
• Stop: 1.0875 (≈10 pips).
• Target: 1.0905 (≈20 pips).
________________________________________
🕘 Strategy 3 — London Range Breakout (Target: ~40 pips)
Setup 🧩
• Mark the Asian/Late-Asia range before 08:00 London.
• Trade the first clean break/close outside the box.
• Entry: stop order beyond the box high/low.
• Conservative stop: opposite side of the box or box size + buffer (≤40–50 pips).
• Take-profit: ~40 pips (scale at 20 pips).
Case study G — GBPUSD upside break (calm pre-CPI session) 📦➡️📈
• When: Mar 25, 2025, London a.m.; GBPUSD drifted toward 1.2950.
• Box: 05:00–08:00 London ~22 pips.
• Plan: Buy box high +3 pips (≈1.2953).
• Stop: 1.2930 (≈23 pips).
• Target: 1.2993 (≈40 pips).
Case study H — EURUSD downside break (trend day toward 1.09) 📦➡️📉
• When: May 12, 2025, EURUSD bias turned lower and eyed the 1.09 handle.
• Box: 05:00–08:00 London ~28 pips.
• Plan: Sell box low −3 pips (≈1.0978).
• Stop: 1.1008 (≈30 pips).
• Target: 1.0938 (≈40 pips).
Case study I — GBPUSD downside break (inflation-week nerves) 📦➡️🔻
• When: Aug 12, 2025, London a.m.; GBPUSD softened from a two-week high.
• Box: 05:00–08:00 London ~24 pips.
• Plan: Sell box low −2 pips (≈1.3446).
• Stop: 1.3472 (≈26 pips).
• Target: 1.3406 (≈40 pips).
________________________________________
🛡️ Risk Management (applies to all three)
• Risk small per trade (e.g., 0.5–1%).
• Stops beyond structure: previous swing/box edge or ATR-based to avoid noise.
• News filter: avoid fresh entries seconds before major economic data.
________________________________________
🧰 Quick Checklists
Swing reversal (4H) ✅
🎯 Level picked • 📉 Reversal signal • 🛑 Stop beyond swing/ATR • 📐 ≥1.8R • 📰 No imminent shock
Scalp (1–5m) ✅
⏱️ Active session • 🔍 Micro S/R & round numbers • 🛑 8–15 pip stop • 🎯 20–40 pips • ✂️ Partial at +10–15
London breakout ✅
🕗 Box 05:00–08:00 • 📦 Reasonable width • 🚀 First break/close • 🛑 Stop other side • 🎯 ≈40 pips
________________________________________
⚠️ Final word
These examples show how setups map onto real market context. Adapt entries/levels to your feed and spreads. Nothing here is financial advice—test and size appropriately.
________________________________________
Is Fridays Bounce a Bull Trap?CME_MINI:NQ1! CME_MINI:ES1! stock market Forecast
Nvidia Stock NASDAQ:NVDA Forecast
Apple Stock NASDAQ:AAPL Forecast
Microsoft Stock MSFT Forecast
Google Stock GOOGL Forecast
Amazon Stock AMZN Forecast
Meta Forecast Technical Analysis
Tesla Stock TSLA Forecast
Magnificent 7 stocks forecast

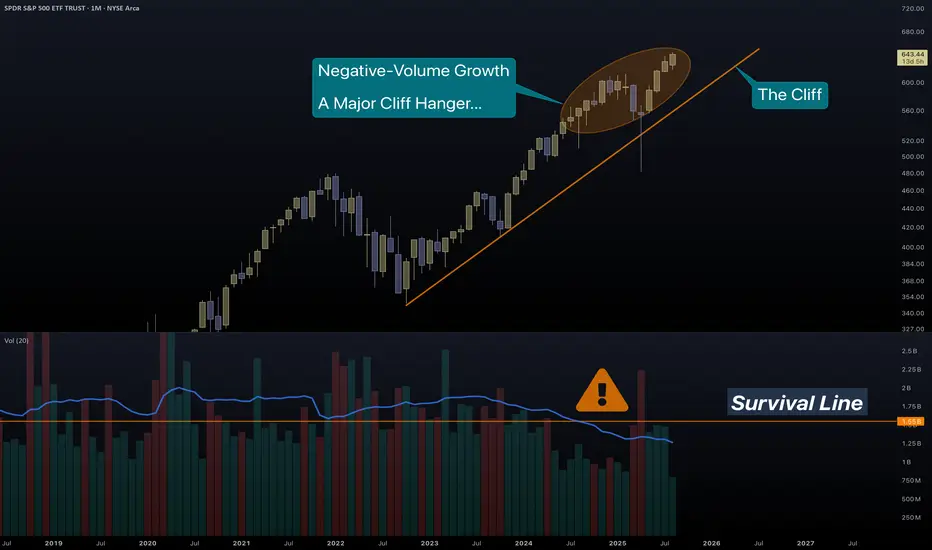
SPY | Leap of Doom?SPY just jumped...
The wrong way up!
To sustain you must conserve. To climb up a hill, you need energy, resources like food and water. The energy they give you far out-weighs their absolute mass. Therefore it makes sense for you to carry them.
And they have taken you very far...
But now you have run out of energy.
Price growth needs transaction volume to have strength and meaning.
You are too light(headed) to realize that moving further up is a dead-end.
THIS IS NOT SOMETHING SMALL.
SPY is one of the largest Funds in the world. A first-ever major violation of volume trend, in such a big index, must not be ignored. Imagine what is happening underneath...
Look at some examples:
NVDA
The most massive of companies, has a multi-year issue with volume.
MSFT
Unlike its first growth, Microsoft has a tremendous loss of strength in volume metrics.
Such long-term drop in volume means that companies offload real stocks for cheap futures .
We witness the same with Bitcoin...
And gold...
Not quite doomed yet, but troublesome still.
TSLA
Tesla with their shiny and financially pointless cars, has made a pointless growth. Just like many stocks as you will soon realize.
AAPL
The masses, even though their name suggests that they have some matter, in reality they don't. 10% of people have 90% of wealth. Investors have long left Apple, leaving the hoard inside to bubble up the dream.
There is more and more proof that the Fab5 (well the Fab500 as we can see from SPY/SPX) are replacing stocks with derivatives. Real money replaced by weapons of mass destruction, just like Warren Buffett said.
Good luck to us all...
PS. Something irrelevant to stocks, but relevant to the fundamentals of investing in AAPL.
Judging by the recent UI decisions, they trapped the users in bubbles and they are unable to see the truth. Brilliantly, they changed the name of soap bubbles to liquid glass. (bubbles are shiny, crystals are rough).
As a long-time Apple user, now not much of an Apple lover, I know quite well the changing philosophy of them. iPhone (and all products) began as a phone for the "smart" ones and ended up the No1 desire for the masses.
After a decade, I have switched to Fedora Silverblue for 90% of my leisure.